
An application of 3 D seismic refraction traveltime
- Slides: 12
An application of 3 -D seismic refraction traveltime tomography to a shallow (<20 m) groundwater contamination site Colin Zelt Aron Azaria (M. S. student) Alan Levander Dept. Earth Science Rice University Zelt et al. 2006; Geophysics, 71, H 67 -H 78
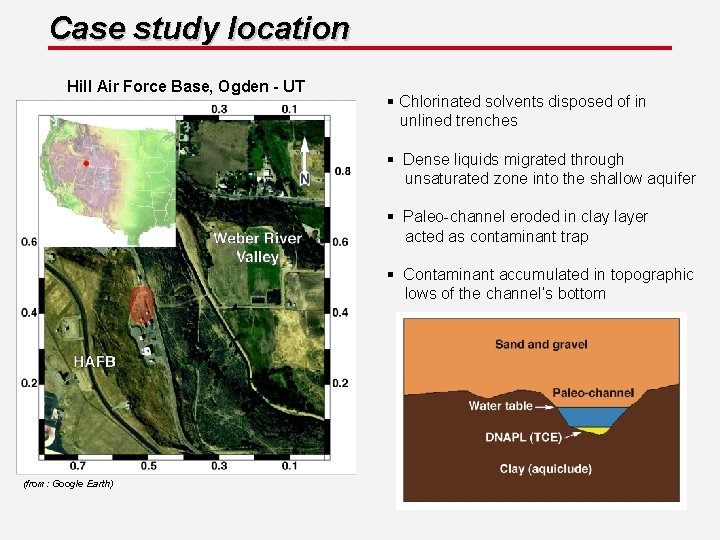
Case study location Hill Air Force Base, Ogden - UT § Chlorinated solvents disposed of in unlined trenches § Dense liquids migrated through unsaturated zone into the shallow aquifer § Paleo-channel eroded in clay layer acted as contaminant trap § Contaminant accumulated in topographic lows of the channel’s bottom (from: Google Earth)
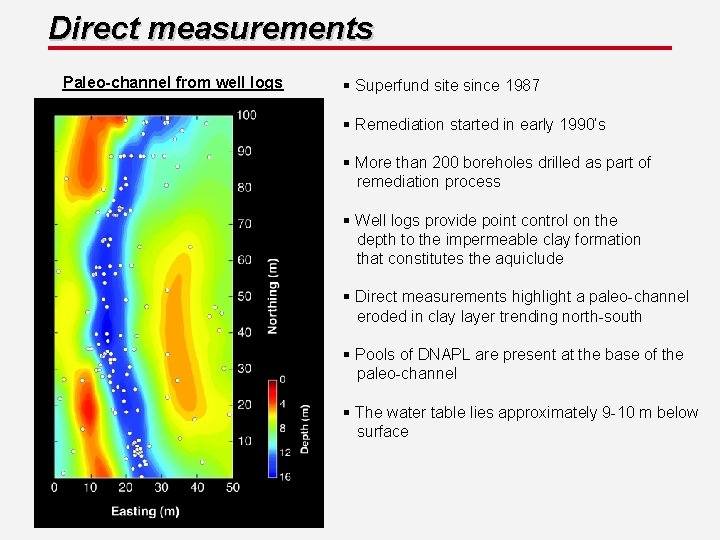
Direct measurements Paleo-channel from well logs § Superfund site since 1987 § Remediation started in early 1990’s § More than 200 boreholes drilled as part of remediation process § Well logs provide point control on the depth to the impermeable clay formation that constitutes the aquiclude § Direct measurements highlight a paleo-channel eroded in clay layer trending north-south § Pools of DNAPL are present at the base of the paleo-channel § The water table lies approximately 9 -10 m below surface
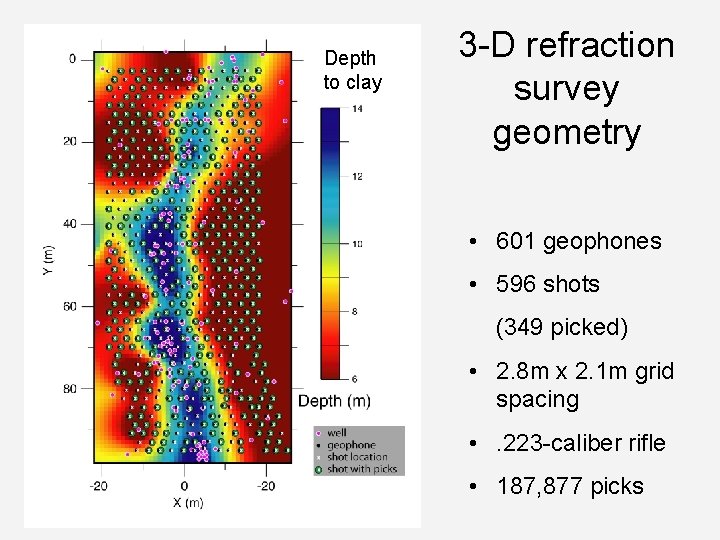
Depth to clay 3 -D refraction survey geometry • 601 geophones • 596 shots (349 picked) • 2. 8 m x 2. 1 m grid spacing • . 223 -caliber rifle • 187, 877 picks
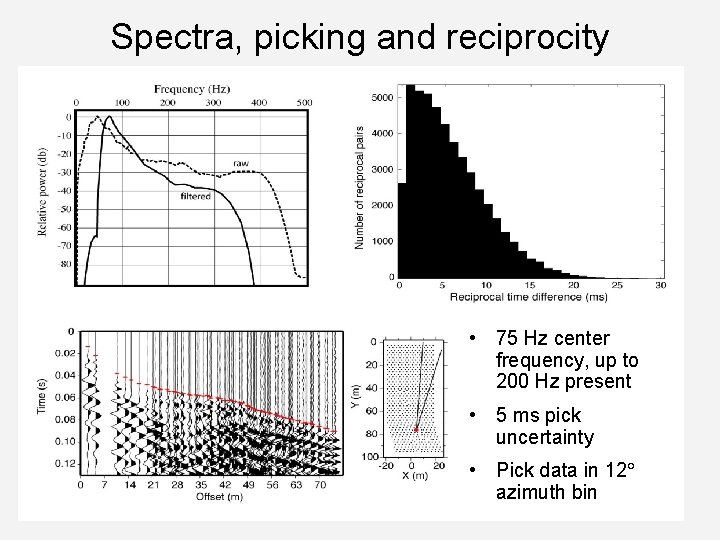
Spectra, picking and reciprocity • 75 Hz center frequency, up to 200 Hz present • 5 ms pick uncertainty • Pick data in 12 azimuth bin
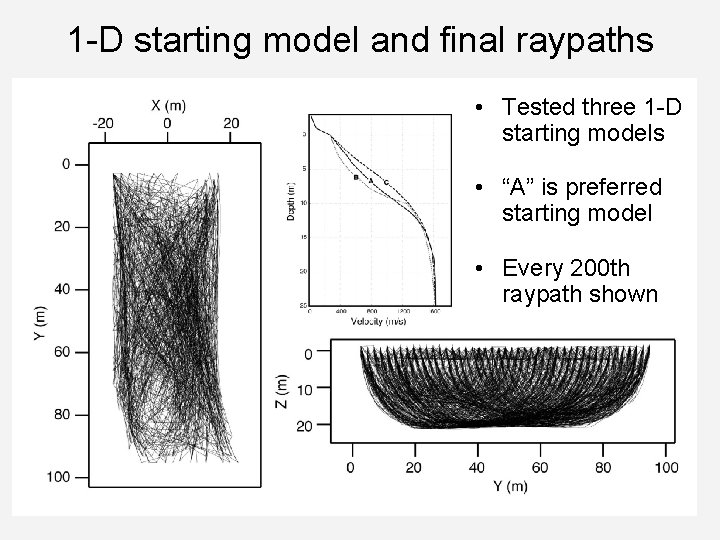
1 -D starting model and final raypaths • Tested three 1 -D starting models • “A” is preferred starting model • Every 200 th raypath shown
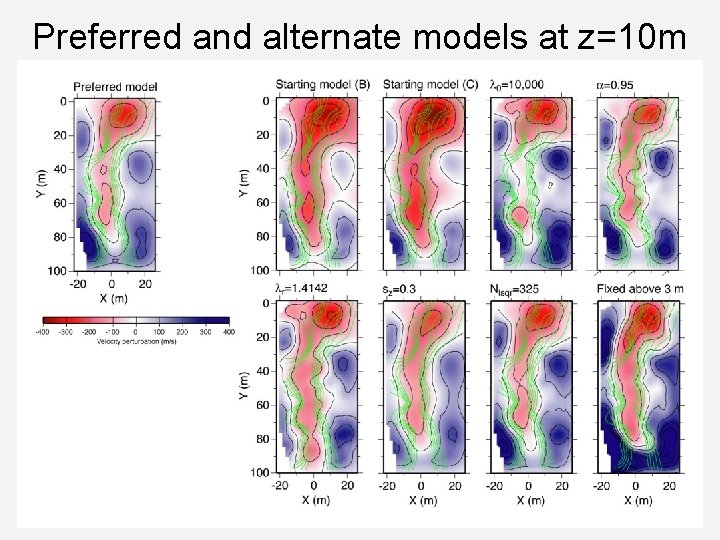
Preferred and alternate models at z=10 m
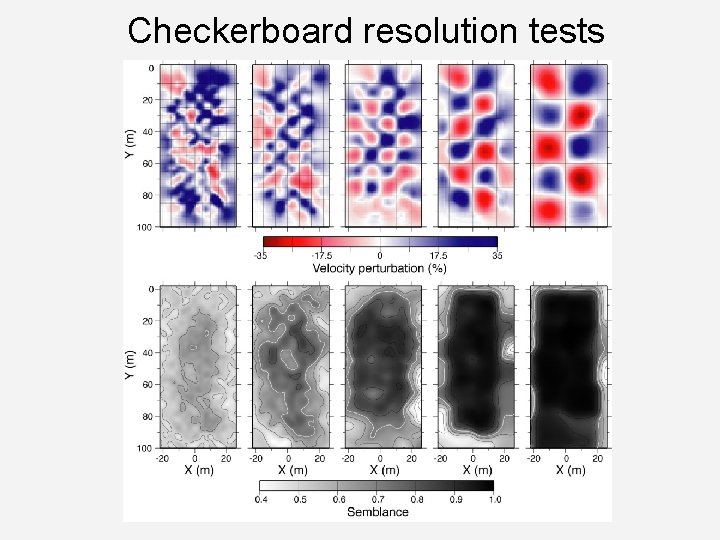
Checkerboard resolution tests
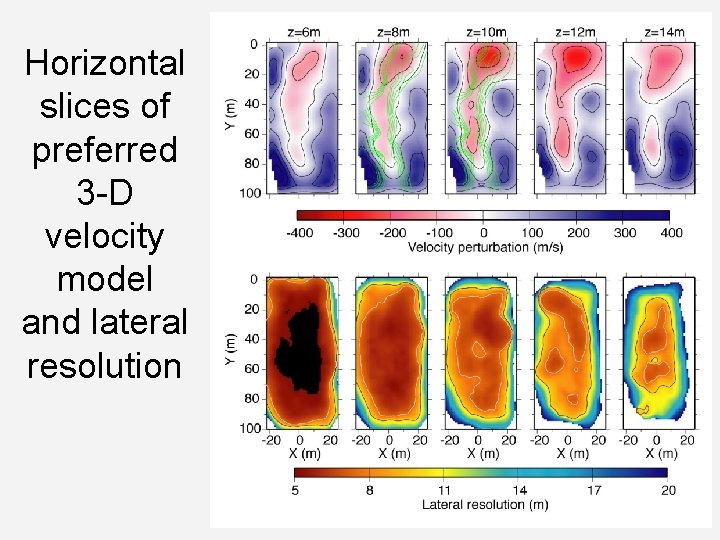
Horizontal slices of preferred 3 -D velocity model and lateral resolution
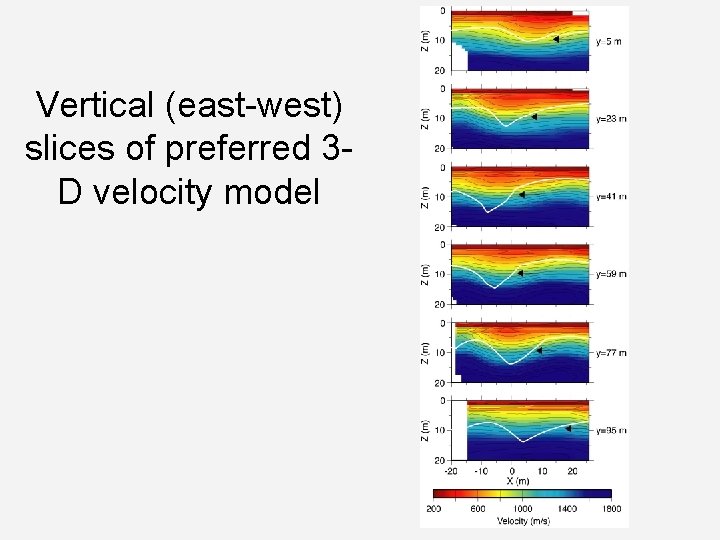
Vertical (east-west) slices of preferred 3 D velocity model
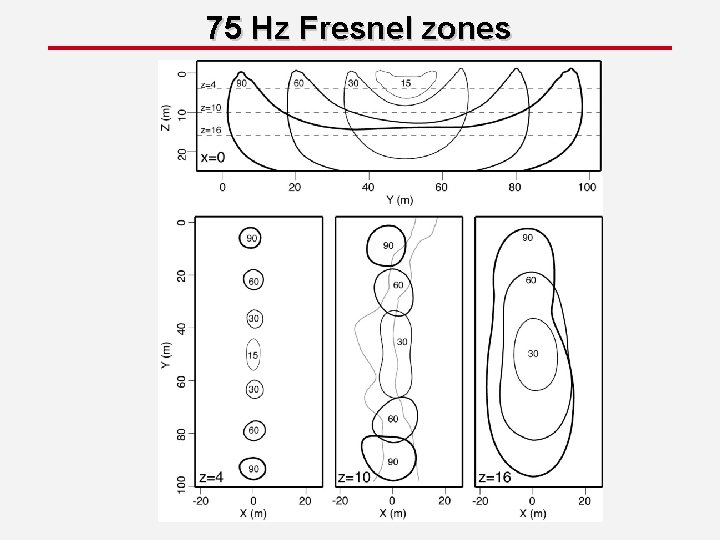
75 Hz Fresnel zones
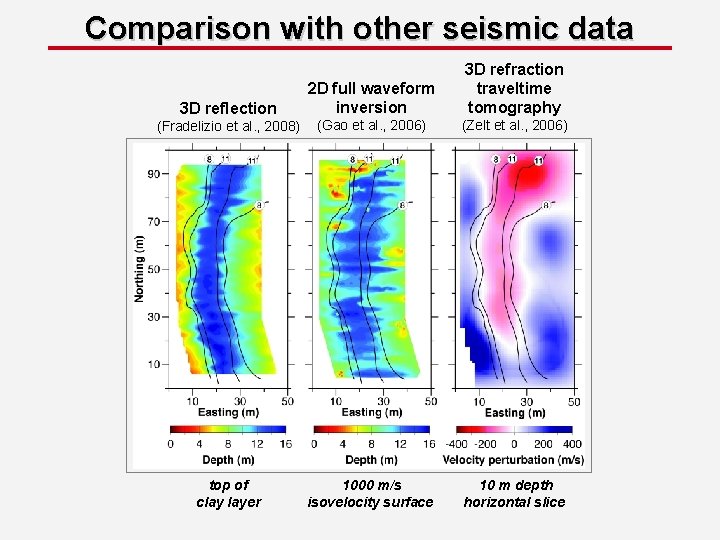
Comparison with other seismic data 3 D reflection 2 D full waveform inversion 3 D refraction traveltime tomography (Fradelizio et al. , 2008) (Gao et al. , 2006) (Zelt et al. , 2006) top of clay layer 1000 m/s isovelocity surface 10 m depth horizontal slice