
An angle resolved dissociative photoionization study of the
- Slides: 1
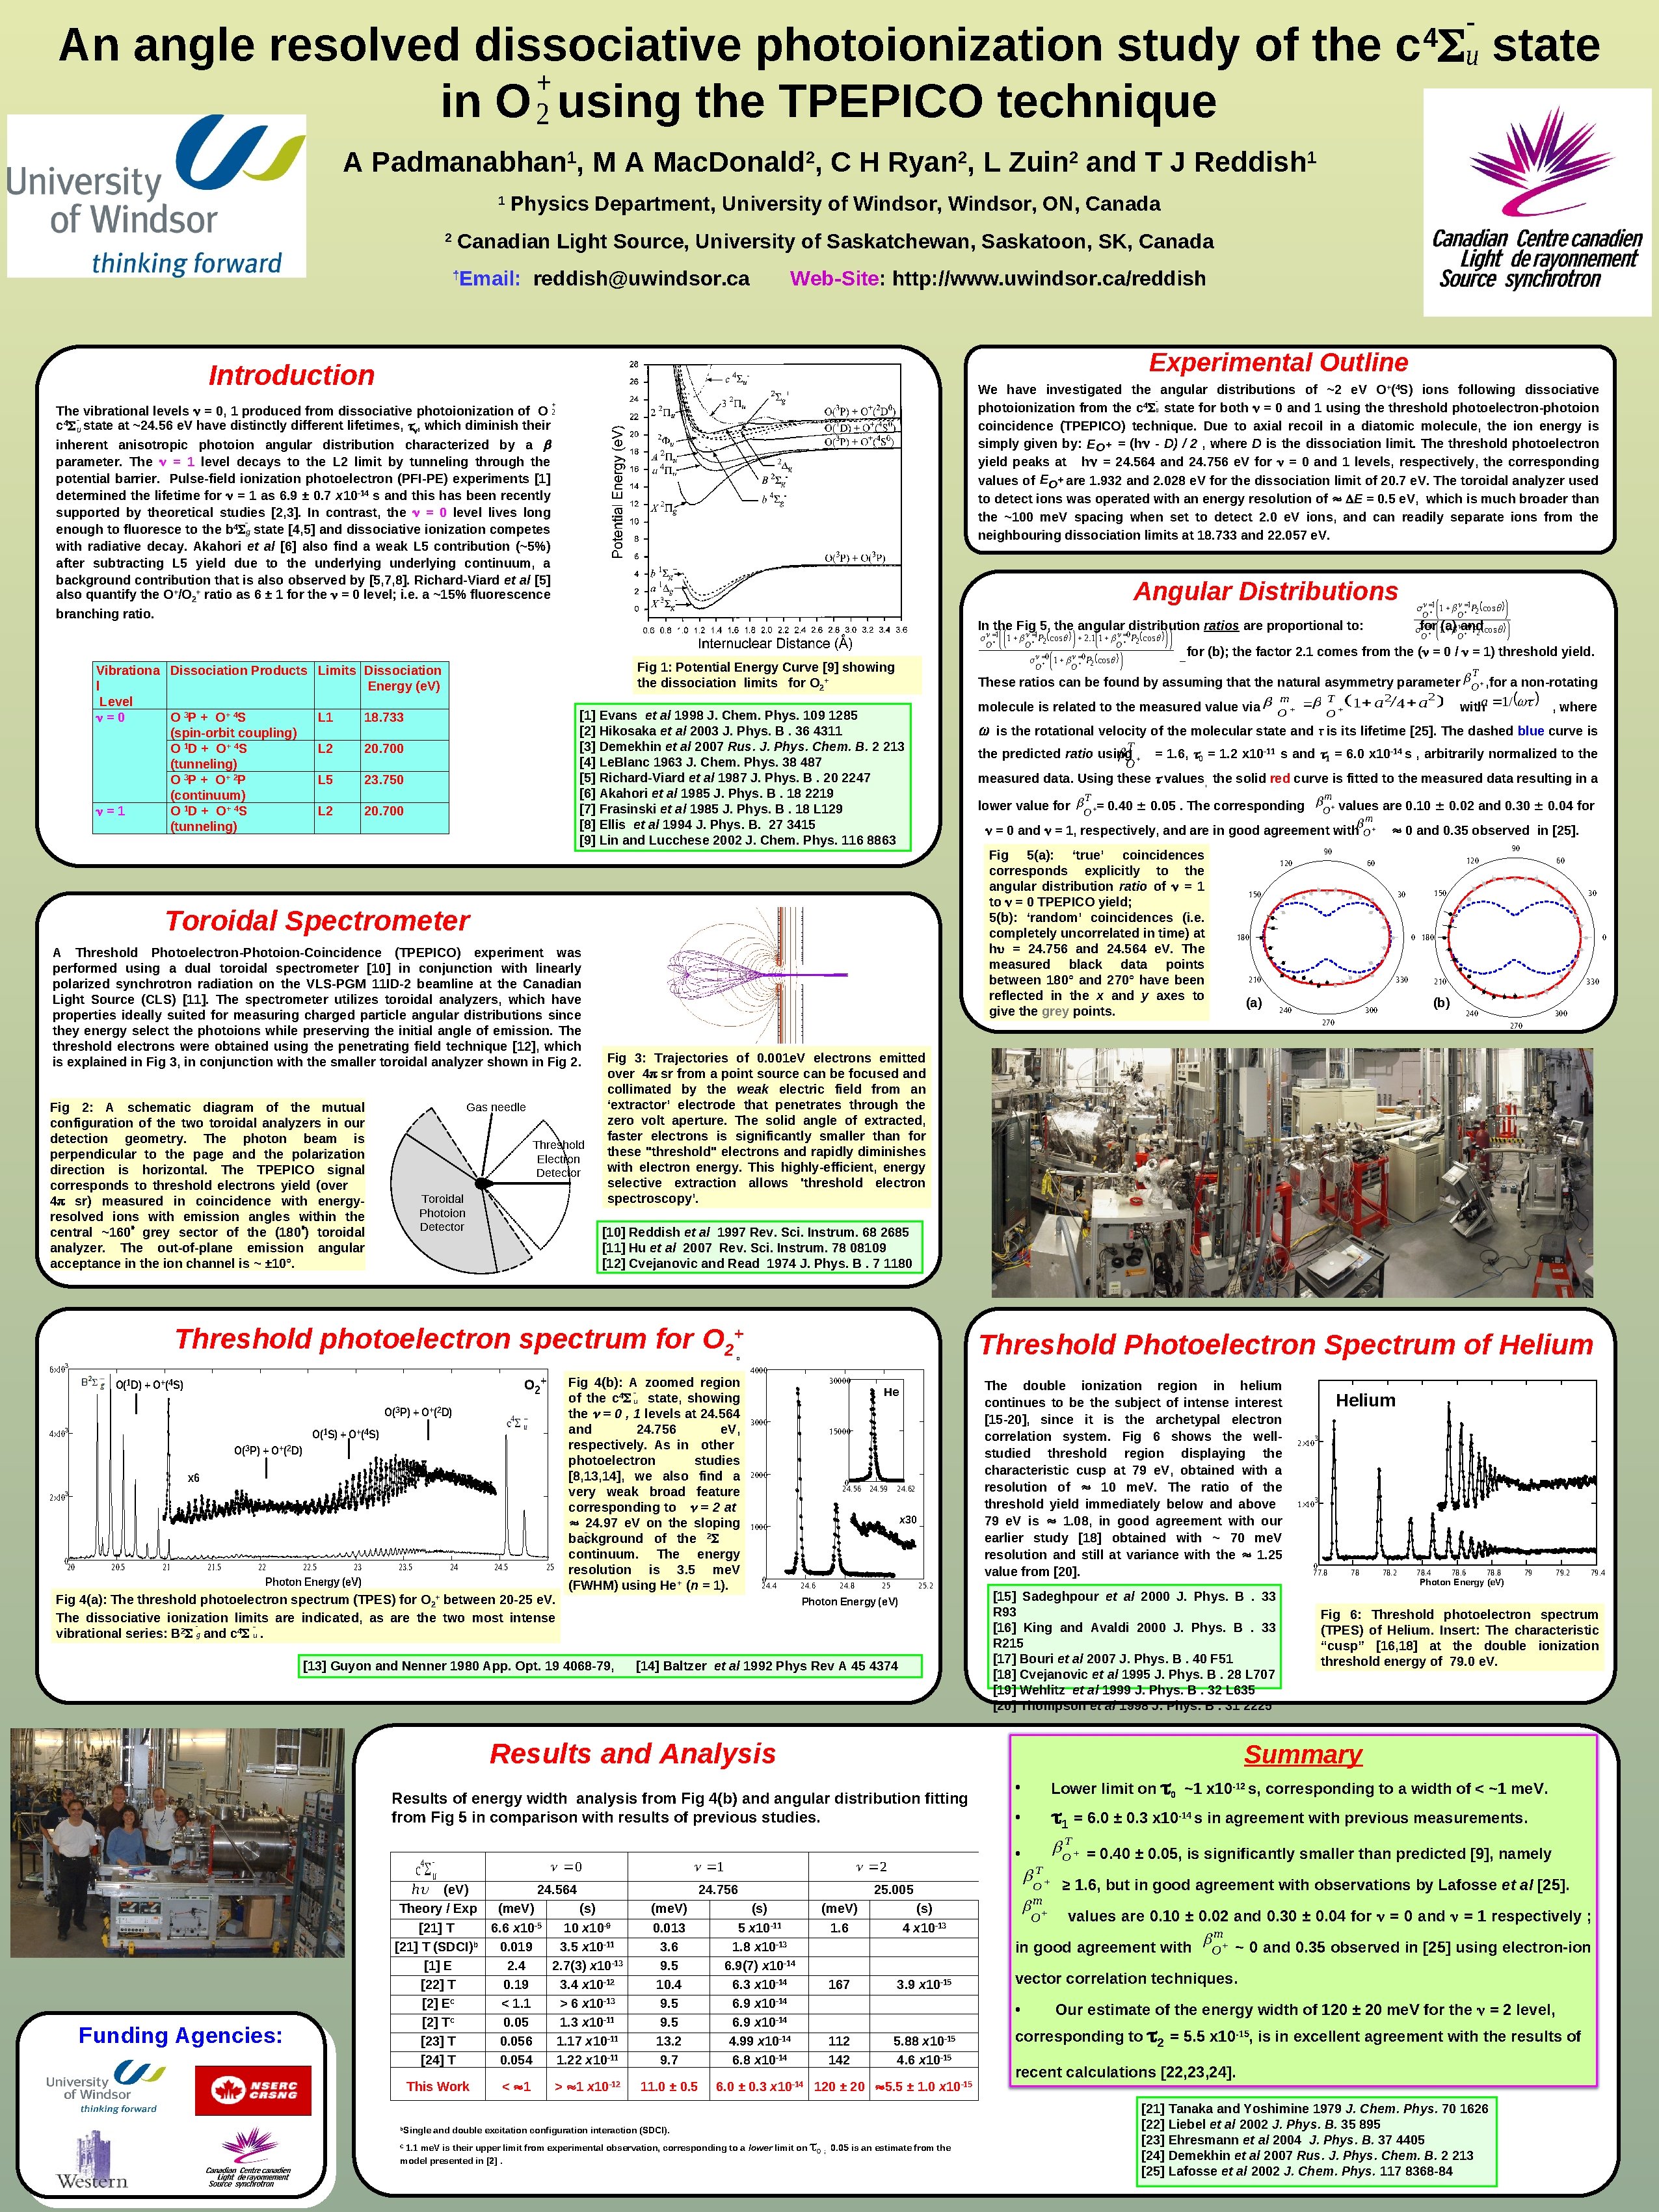
An angle resolved dissociative photoionization study of the in O 2 using the TPEPICO technique A Padmanabhan , M A Mac. Donald , C H Ryan , L Zuin and T J Reddish 1 1 2 2 Email: reddish@uwindsor. ca Web-Site: http: //www. uwindsor. ca/reddish Experimental Outline Introduction We have investigated the angular distributions of ~2 e. V O+(4 S) ions following dissociative photoionization from the c 4 u state for both = 0 and 1 using the threshold photoelectron-photoion coincidence (TPEPICO) technique. Due to axial recoil in a diatomic molecule, the ion energy is simply given by: E O = (h - D) / 2 , where D is the dissociation limit. The threshold photoelectron yield peaks at h = 24. 564 and 24. 756 e. V for = 0 and 1 levels, respectively, the corresponding are 1. 932 and 2. 028 e. V for the dissociation limit of 20. 7 e. V. The toroidal analyzer used values of EO to detect ions was operated with an energy resolution of E = 0. 5 e. V, which is much broader than the ~100 me. V spacing when set to detect 2. 0 e. V ions, and can readily separate ions from the neighbouring dissociation limits at 18. 733 and 22. 057 e. V. The vibrational levels = 0, 1 produced from dissociative photoionization of O 2 c 4 u state at ~24. 56 e. V have distinctly different lifetimes, , which diminish their inherent anisotropic photoion angular distribution characterized by a parameter. The = 1 level decays to the L 2 limit by tunneling through the potential barrier. Pulse-field ionization photoelectron (PFI-PE) experiments [1] determined the lifetime for = 1 as 6. 9 ± 0. 7 x 10 -14 s and this has been recently supported by theoretical studies [2, 3]. In contrast, the = 0 level lives long enough to fluoresce to the b 4 g state [4, 5] and dissociative ionization competes with radiative decay. Akahori et al [6] also find a weak L 5 contribution (~5%) after subtracting L 5 yield due to the underlying continuum, a background contribution that is also observed by [5, 7, 8]. Richard-Viard et al [5] also quantify the O+/O 2+ ratio as 6 ± 1 for the = 0 level; i. e. a ~15% fluorescence branching ratio. Angular Distributions In the Fig 5, the angular distribution ratios are proportional to: Fig 1: Potential Energy Curve [9] showing the dissociation limits for O 2+ Limits Dissociation Energy (e. V) L 1 18. 733 L 2 20. 700 L 5 23. 750 1 1 0 1 P 2 cos 2. 1 1 P 2 cos O O O for 0 0 1 P cos 2 O O T These ratios can be found by A Threshold Photoelectron-Photoion-Coincidence (TPEPICO) experiment was performed using a dual toroidal spectrometer [10] in conjunction with linearly polarized synchrotron radiation on the VLS-PGM 11 ID-2 beamline at the Canadian Light Source (CLS) [11]. The spectrometer utilizes toroidal analyzers, which have properties ideally suited for measuring charged particle angular distributions since they energy select the photoions while preserving the initial angle of emission. The threshold electrons were obtained using the penetrating field technique [12], which is explained in Fig 3, in conjunction with the smaller toroidal analyzer shown in Fig 2: A schematic diagram of the mutual configuration of the two toroidal analyzers in our detection geometry. The photon beam is perpendicular to the page and the polarization direction is horizontal. The TPEPICO signal corresponds to threshold electrons yield (over 4 sr) measured in coincidence with energyresolved ions with emission angles within the central ~160 grey sector of the (180 ) toroidal analyzer. The out-of-plane emission angular acceptance in the ion channel is ~ ± 10°. Gas needle Threshold Electron Detector Toroidal Photoion Detector T O the predicted ratio using O(3 P) + O+(2 D) O(1 S) + O+(4 S) O(3 P) + O+(2 D) x 6 3 2 10 21. 5 22 22. 5 23 23. 5 24 24. 5 25 Photon Energy (e. V) Fig 4(a): The threshold photoelectron spectrum (TPES) for O 2+ between 20 -25 e. V. The dissociative ionization limits are indicated, as are the two most intense vibrational series: B 2 g and c 4 u. measured data. Using these values, the solid red curve is fitted to the measured data resulting in a m T lower value for O = 0. 40 0. 05. The corresponding O values are 0. 10 0. 02 and 0. 30 0. 04 for m = 0 and = 1, respectively, and are in good agreement with O 0 and 0. 35 observed in [25]. 120 4 Fig 4(b): A zoomed region of the c 4 u state, showing the = 0 , 1 levels at 24. 564 and 24. 756 e. V, respectively. As in other photoelectron studies [8, 13, 14], we also find a very weak broad feature corresponding to = 2 at 24. 97 e. V on the sloping background of the 2 u continuum. The energy resolution is 3. 5 me. V (FWHM) using He+ (n = 1). 30000 150 h 3000 15000 2000 0 24. 56 24. 59 24. 62 x 30 1000 0 24. 4 24. 6 24. 8 25 25. 2 [14] Baltzer et al 1992 Phys Rev A 45 4374 210 330 240 0 210 (b) 300 330 240 300 270 [15] Sadeghpour et al 2000 J. Phys. B. 33 R 93 [16] King and Avaldi 2000 J. Phys. B. 33 R 215 [17] Bouri et al 2007 J. Phys. B. 40 F 51 [18] Cvejanovic et al 1995 J. Phys. B. 28 L 707 [19] Wehlitz et al 1999 J. Phys. B. 32 L 635 [20] Thompson et al 1998 J. Phys. B. 31 2225 1 24. 564 (me. V) (s) 6. 6 x 10 -5 10 x 10 -9 0. 019 3. 5 x 10 -11 2. 4 2. 7(3) x 10 -13 0. 19 3. 4 x 10 -12 < 1. 1 > 6 x 10 -13 0. 05 1. 3 x 10 -11 0. 056 1. 17 x 10 -11 0. 054 1. 22 x 10 -11 < 1 > 1 x 10 -12 2 24. 756 (me. V) 0. 013 3. 6 9. 5 10. 4 9. 5 13. 2 9. 7 11. 0 ± 0. 5 3 2 10 3 1 10 0 77. 8 78 78. 2 78. 4 78. 6 78. 8 Photon Energy (e. V) 79 79. 2 79. 4 Fig 6: Threshold photoelectron spectrum (TPES) of Helium. Insert: The characteristic “cusp” [16, 18] at the double ionization threshold energy of 79. 0 e. V. • Lower limit on 0 ~1 x 10 -12 s, corresponding to a width of < ~1 me. V. • 1 = 6. 0 ± 0. 3 x 10 -14 s in agreement with previous measurements. • T = 0. 40 ± 0. 05, is significantly smaller than predicted [9], namely O T O 25. 005 (s) 5 x 10 -11 1. 8 x 10 -13 6. 9(7) x 10 -14 6. 3 x 10 -14 6. 9 x 10 -14 4. 99 x 10 -14 6. 8 x 10 -14 (me. V) 1. 6 (s) 4 x 10 -13 167 3. 9 x 10 -15 m 112 142 5. 88 x 10 -15 4. 6 x 10 -15 0 ; 0. 05 is an estimate from the ≥ 1. 6, but in good agreement with observations by Lafosse et al [25]. values are 0. 10 ± 0. 02 and 0. 30 ± 0. 04 for = 0 and = 1 respectively ; m in good agreement with O ~ 0 and 0. 35 observed in [25] using electron-ion O vector correlation techniques. • 6. 0 ± 0. 3 x 10 -14 120 ± 20 5. 5 ± 1. 0 x 10 -15 1. 1 me. V is their upper limit from experimental observation, corresponding to a lower limit on model presented in [2]. Helium Summary Single and double excitation configuration interaction (SDCI). C 30 0 180 (a) 60 150 30 The double ionization region in helium continues to be the subject of intense interest [15 -20], since it is the archetypal electron correlation system. Fig 6 shows the wellstudied threshold region displaying the characteristic cusp at 79 e. V, obtained with a resolution of 10 me. V. The ratio of the threshold yield immediately below and above 79 e. V is 1. 08, in good agreement with our earlier study [18] obtained with ~ 70 me. V resolution and still at variance with the 1. 25 value from [20]. He Photon Energy (e. V) 0 c u b 120 60 Threshold Photoelectron Spectrum of Helium Results of energy width analysis from Fig 4(b) and angular distribution fitting from Fig 5 in comparison with results of previous studies. This Work 90 90 Results and Analysis Funding Agencies: , where Fig 3: Trajectories of 0. 001 e. V electrons emitted over 4 sr from a point source can be focused and collimated by the weak electric field from an ‘extractor’ electrode that penetrates through the zero volt aperture. The solid angle of extracted, faster electrons is significantly smaller than for these "threshold" electrons and rapidly diminishes with electron energy. This highly-efficient, energy selective extraction allows 'threshold electron spectroscopy’. [13] Guyon and Nenner 1980 App. Opt. 19 4068 -79, (e. V) Theory / Exp [21] T (SDCI)b [1] E [22] T [2] Ec [2] Tc [23] T [24] T witha 1 / 4000 O 2+ O(1 D) + O+(4 S) 21 O O = 1. 6, 0 = 1. 2 x 10 -11 s and 1 = 6. 0 x 10 -14 s , arbitrarily normalized to the Fig 5(a): ‘true’ coincidences corresponds explicitly to the angular distribution ratio of = 1 to = 0 TPEPICO yield; 5(b): ‘random’ coincidences (i. e. completely uncorrelated in time) at h = 24. 756 and 24. 564 e. V. The measured black data points between 180° and 270° have been reflected in the x and y axes to give the grey points. 3 20. 5 T that the natural asymmetry parameter , for a non-rotating [10] Reddish et al 1997 Rev. Sci. Instrum. 68 2685 [11] Hu et al 2007 Rev. Sci. Instrum. 78 08109 [12] Cvejanovic and Read 1974 J. Phys. B. 7 1180 6 10 0 20 O assuming is the rotational velocity of the molecular state and τ is its lifetime [25]. The dashed blue curve is Threshold photoelectron spectrum for O 2+ 4 10 (b); the factor 2. 1 comes from the ( = 0 / = 1) threshold yield. O [1] Evans et al 1998 J. Chem. Phys. 109 1285 [2] Hikosaka et al 2003 J. Phys. B. 36 4311 [3] Demekhin et al 2007 Rus. J. Phys. Chem. B. 2 213 [4] Le. Blanc 1963 J. Chem. Phys. 38 487 [5] Richard-Viard et al 1987 J. Phys. B. 20 2247 [6] Akahori et al 1985 J. Phys. B. 18 2219 [7] Frasinski et al 1985 J. Phys. B. 18 L 129 [8] Ellis et al 1994 J. Phys. B. 27 3415 [9] Lin and Lucchese 2002 J. Chem. Phys. 116 8863 20. 700 1 1 1 P 2 cos O O 0 (a) and 0 for 1 P 2 cos O O m T 1 a 2/4 a 2 molecule is related to the measured value via Toroidal Spectrometer 3 1 Physics Department, University of Windsor, ON, Canada † L 2 state Canadian Light Source, University of Saskatchewan, Saskatoon, SK, Canada 2 Vibrationa Dissociation Products l Level =0 O 3 P + O+ 4 S (spin-orbit coupling) O 1 D + O+ 4 S (tunneling) O 3 P + O+ 2 P (continuum) =1 O 1 D + O+ 4 S (tunneling) 2 4 c u Our estimate of the energy width of 120 ± 20 me. V for the = 2 level, corresponding to 2 = 5. 5 x 10 -15, is in excellent agreement with the results of recent calculations [22, 23, 24]. [21] Tanaka and Yoshimine 1979 J. Chem. Phys. 70 1626 [22] Liebel et al 2002 J. Phys. B. 35 895 [23] Ehresmann et al 2004 J. Phys. B. 37 4405 [24] Demekhin et al 2007 Rus. J. Phys. Chem. B. 2 213 [25] Lafosse et al 2002 J. Chem. Phys. 117 8368 -84