
AMPLITUDE AND POWER SPECTRA COMPARISON BETWEEN DIFFERENT TYPES
AMPLITUDE AND POWER SPECTRA COMPARISON BETWEEN DIFFERENT TYPES OF LONGITUDINAL BUNCH PROFILES FOR THE SPS MKE KICKER HEATING E. Métral (10 min) u u u This is a follow-up of the APC presentation of Jan Uythoven on 17/09/04 (presented at RLC meeting on 01/10/04) Theory Comparison with measured spectra in 2003 and 2004 (given by Jan Uythoven) Elias Métral, APC meeting, 09/06/2005 1
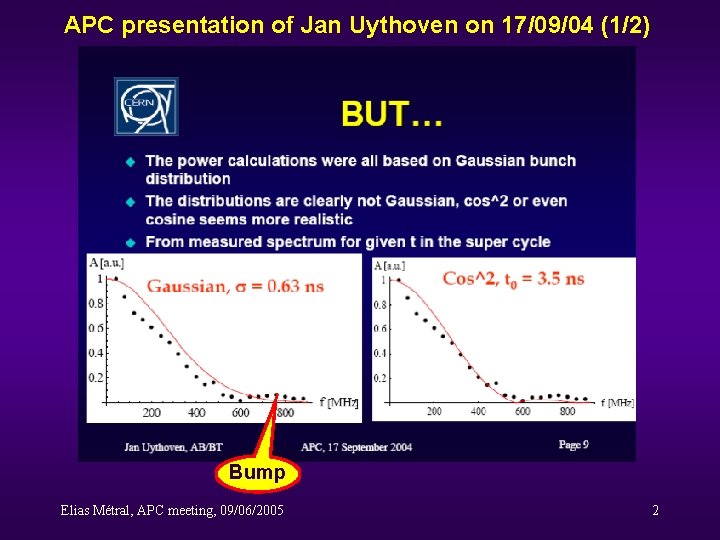
APC presentation of Jan Uythoven on 17/09/04 (1/2) Bump Elias Métral, APC meeting, 09/06/2005 2
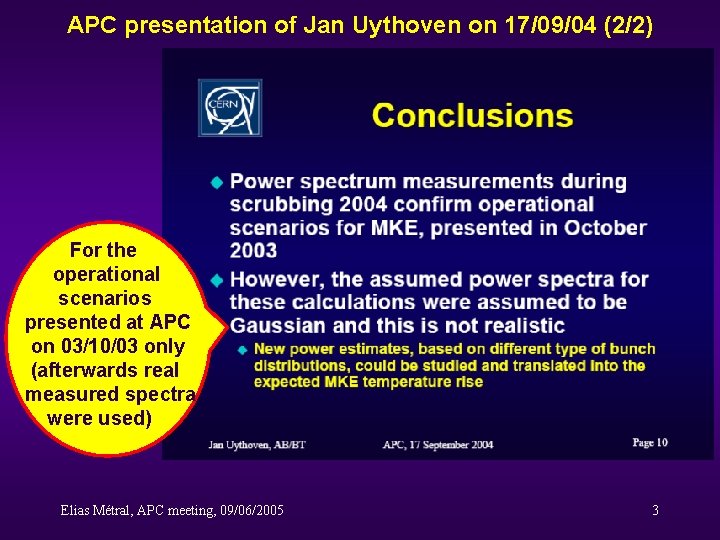
APC presentation of Jan Uythoven on 17/09/04 (2/2) For the operational scenarios presented at APC on 03/10/03 only (afterwards real measured spectra were used) Elias Métral, APC meeting, 09/06/2005 3
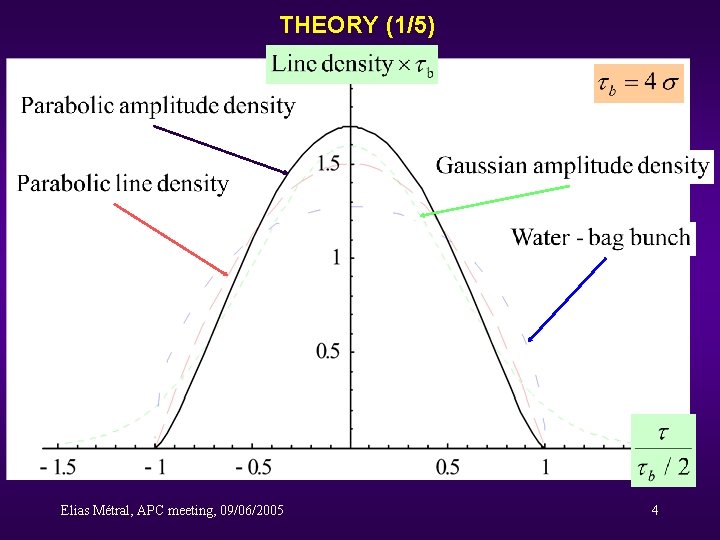
THEORY (1/5) Elias Métral, APC meeting, 09/06/2005 4
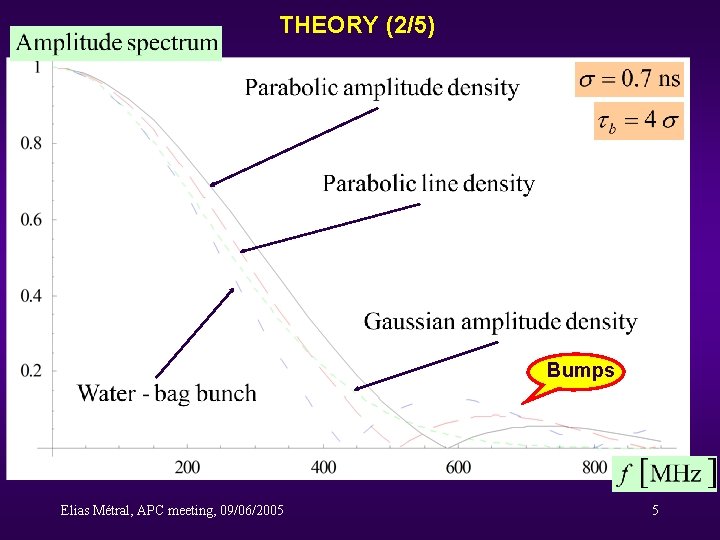
THEORY (2/5) Bumps Elias Métral, APC meeting, 09/06/2005 5
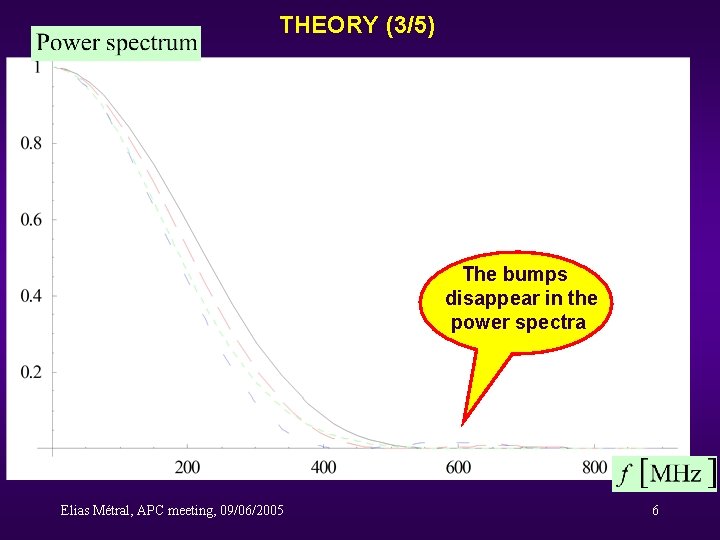
THEORY (3/5) The bumps disappear in the power spectra Elias Métral, APC meeting, 09/06/2005 6
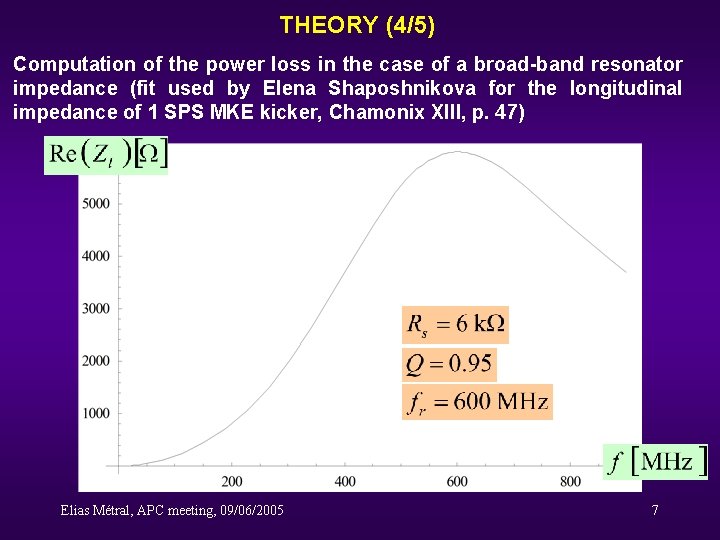
THEORY (4/5) Computation of the power loss in the case of a broad-band resonator impedance (fit used by Elena Shaposhnikova for the longitudinal impedance of 1 SPS MKE kicker, Chamonix XIII, p. 47) Elias Métral, APC meeting, 09/06/2005 7
![THEORY (5/5) Average power deposited per unit length [W/m] from theory u u Parabolic](http://slidetodoc.com/presentation_image_h2/0bac0f5abe5ab8516bb68b8938475ea9/image-8.jpg "THEORY (5/5) Average power deposited per unit length [W/m] from theory u u Parabolic")
THEORY (5/5) Average power deposited per unit length [W/m] from theory u u Parabolic amplitude density = 893 Parabolic line density = 677 Gaussian amplitude density = 605 Water-bag bunch = 530 § Power (Parabolic amplitude density) = 1. 48 × Power (Gaussian) § Power (Parabolic line density) = 1. 12 × Power (Gaussian) § Power (Water-bag bunch) = 0. 88 × Power (Gaussian) Elias Métral, APC meeting, 09/06/2005 8
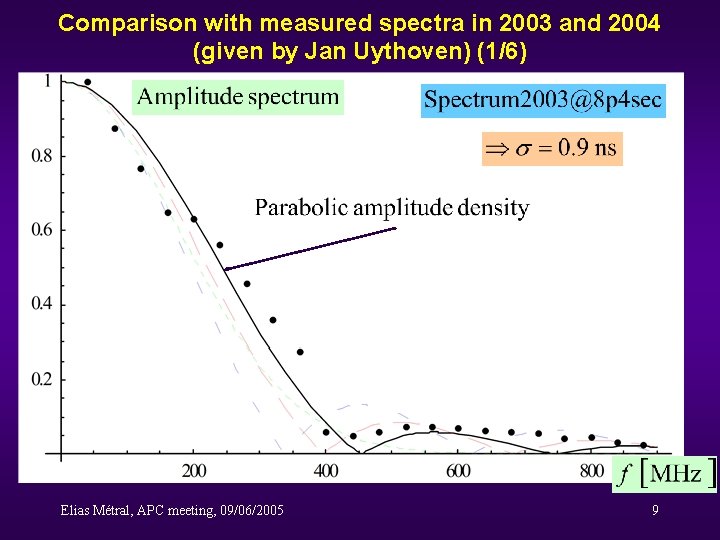
Comparison with measured spectra in 2003 and 2004 (given by Jan Uythoven) (1/6) Elias Métral, APC meeting, 09/06/2005 9
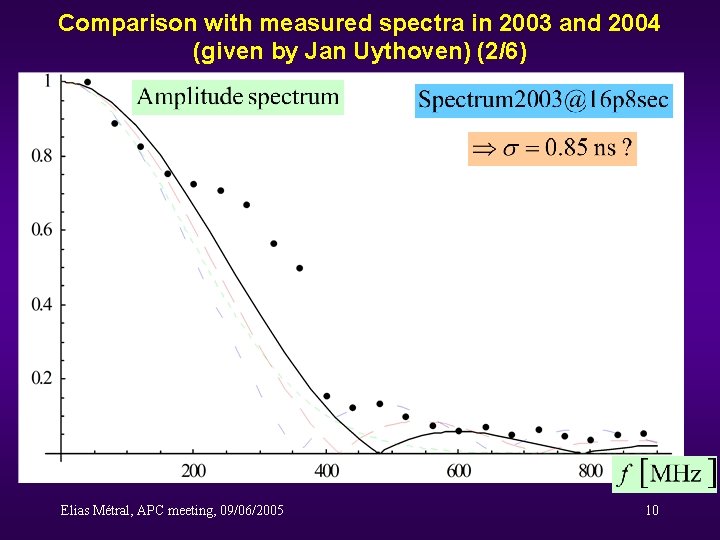
Comparison with measured spectra in 2003 and 2004 (given by Jan Uythoven) (2/6) Elias Métral, APC meeting, 09/06/2005 10
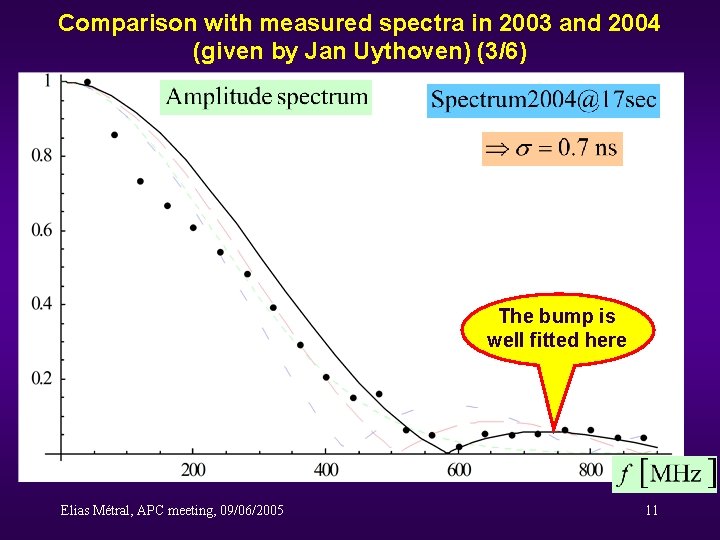
Comparison with measured spectra in 2003 and 2004 (given by Jan Uythoven) (3/6) The bump is well fitted here Elias Métral, APC meeting, 09/06/2005 11
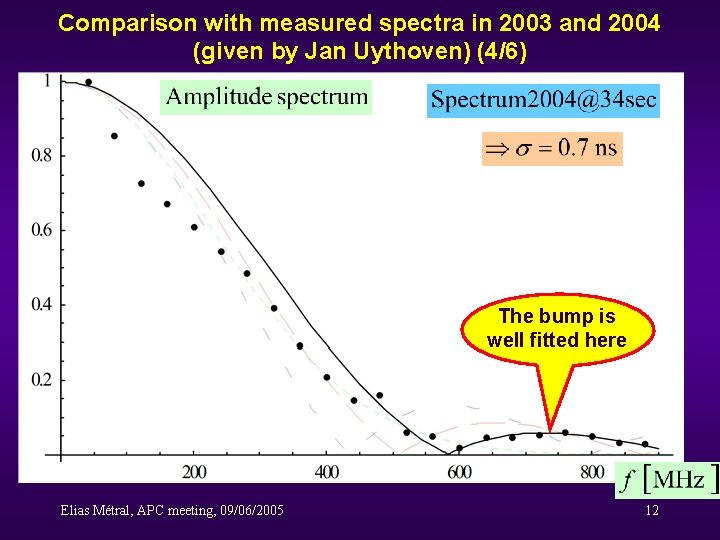
Comparison with measured spectra in 2003 and 2004 (given by Jan Uythoven) (4/6) The bump is well fitted here Elias Métral, APC meeting, 09/06/2005 12
Comparison with measured spectra in 2003 and 2004 (given by Jan Uythoven) (5/6) Average power deposited per unit length [W/m] from measured spectra u u Spectrum 2003@8 p 4 sec = 509 Spectrum 2003@16 p 8 sec = 958 Spectrum 2004@17 sec = 593 Spectrum 2004@34 sec = 590 Elias Métral, APC meeting, 09/06/2005 ~600 W/m for 2004, with more stable spectra 13
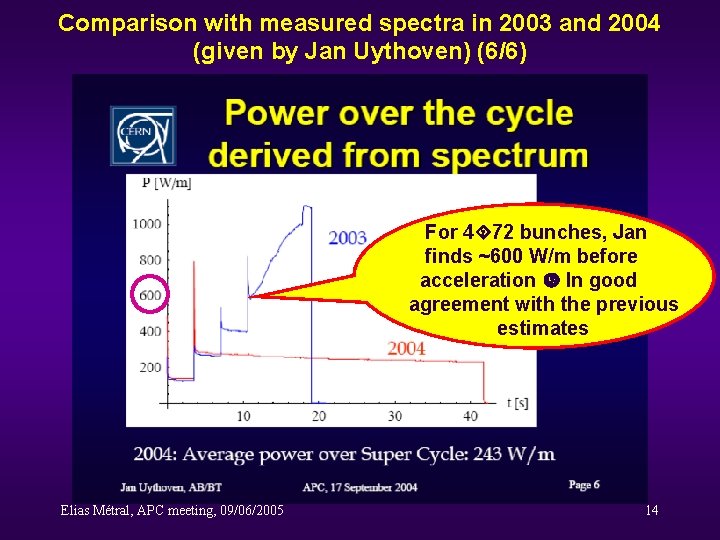
Comparison with measured spectra in 2003 and 2004 (given by Jan Uythoven) (6/6) For 4 72 bunches, Jan finds ~600 W/m before acceleration In good agreement with the previous estimates Elias Métral, APC meeting, 09/06/2005 14
CONCLUSION u Good agreement between Jan and myself u The estimates of Jan are made using the real measured spectra (one cannot do better than that if the spectra measurement is reliable) u ~600 W/m are found for 4 72 bunches, with 1. 2 1011 p/b, using either the measured spectrum or the measured bunch length (0. 7 ns rms) assuming a Gaussian distribution u No bumps appear in the amplitude spectrum for a Gaussian bunch, but these bumps are not important for the power loss as they disappear in the power spectrum! Elias Métral, APC meeting, 09/06/2005 15
- Slides: 15