
Amina Kariminia Ph D Oncology Lab Child Family

Amina Kariminia Ph. D. Oncology Lab, Child & Family Research Institute, Department of Pediatrics, Faculty of Medicine University of British Columbia ICIA 2014 Milad Tower, Tehran
Outlines • A glance to multi-color flow cytometry • Tregs in whole blood sample • Kinetic of NFk. B phosphorylation in pre B-cell leukemia • Monitoring immuno-suprressor drugs • Multi-color flow cytometry for normal human B-cell sub-populations • MIFlow. Cyt • Introducing Cy-TOF: mass-cytometry
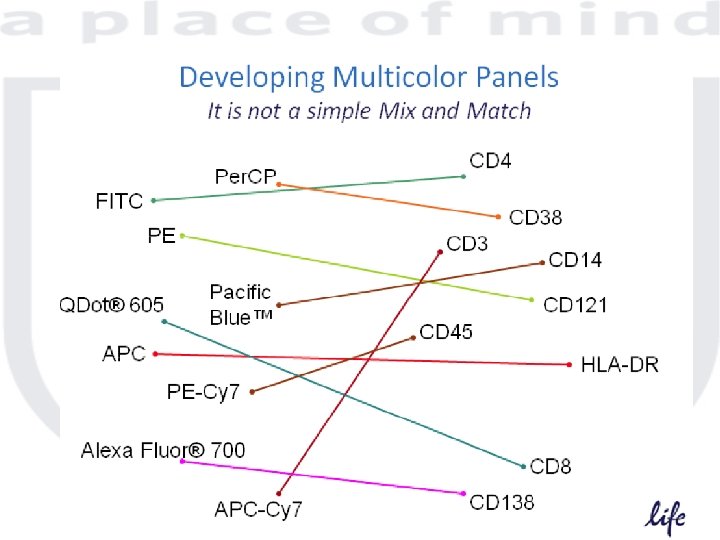
Types of controls • Instrument set up control – PMT voltage settings – Compensation • Gating controls – Isotype controls – FMO controls • Biological controls – Unstimulated samples – Healthy donors
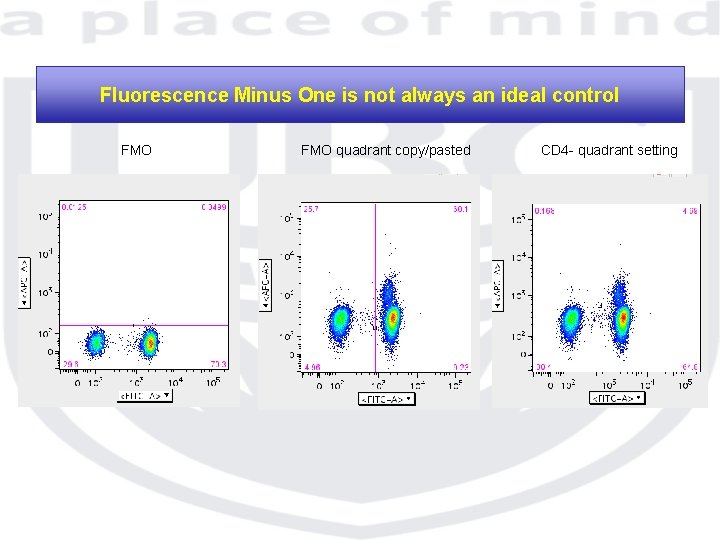
Fluorescence Minus One is not always an ideal control FMO quadrant copy/pasted CD 4 - quadrant setting
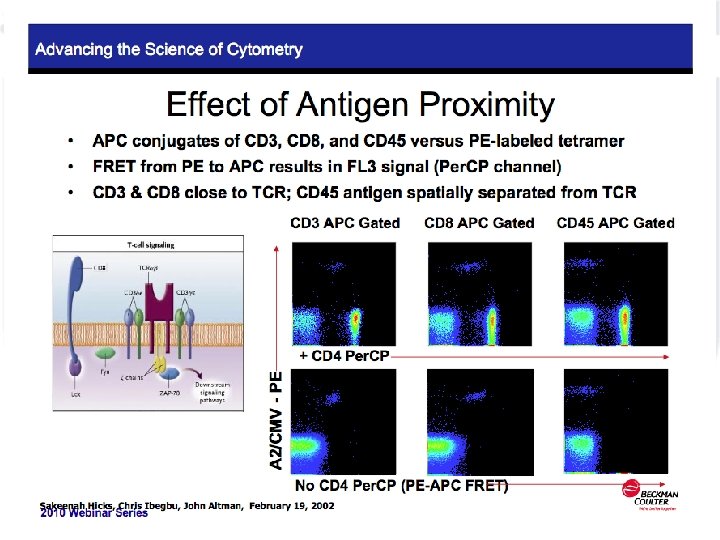
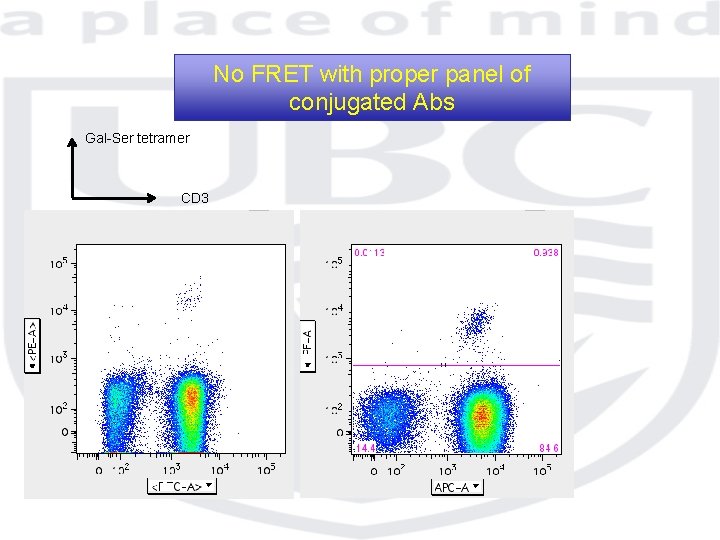
No FRET with proper panel of conjugated Abs Gal-Ser tetramer CD 3
Flow cytometry of rare populations ü Minimal Residual Disease ü GFP ü PBL stem cells ü BM stem cells ü Tetramers: Ag specific T cells
Rare population & Flow cytometry Practical Considerations ü Number of events should be increased for statistical accuracy 200, 000 -1, 000 ü Proper controls ü Proper instrument setting
Intracellular staining Cytokine & Phospho protein
Intracellular staining • Cytokines ü ü ü ü Type of stimulator Time point Type of protein transport inhibitor Level of production Background level Type of Fix/perm Color selection
Intracellular staining • TH 1/2/17 ü ü ü Frozen PBMCs from healthy donors PMA/I stimulation for 6 hr , CO 2 incubator In presence of monensin 6 color staining BD fix/perm 500, 000 cells acquired
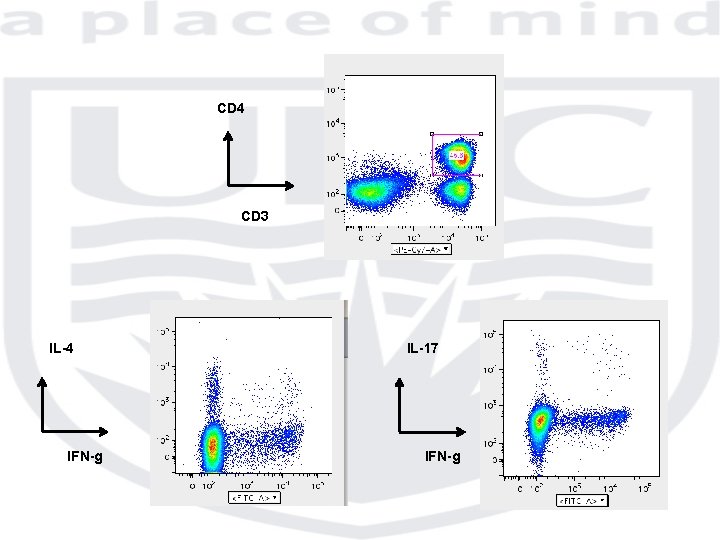
CD 4 CD 3 IL-4 IFN-g IL-17 IFN-g
Phospho-protein detection • Phospho-protein ü ü ü Type of stimulator Time point Level of production Background level Type of Fix/perm Color selection
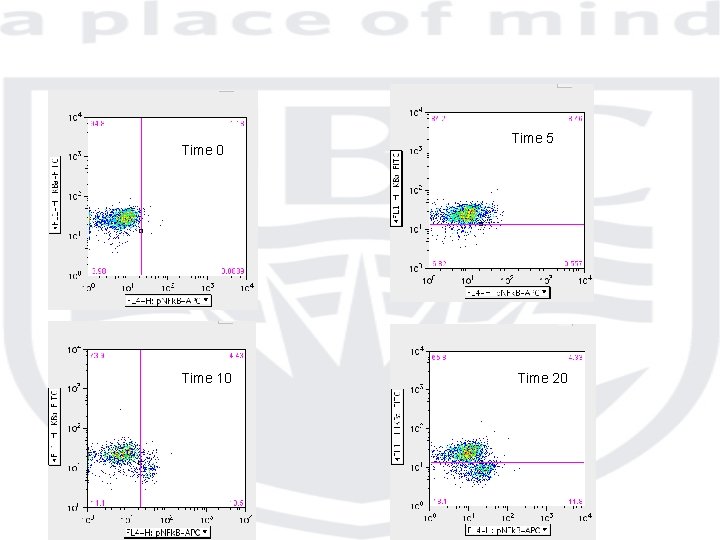
B-cell Acute lymphoblastic leukemia cell lines • Phospho-protein ü TLR 2 ligand Pam 2 CSK ü Pre B-cell leukemia cell lines ü Phosphorylation of NFk. B & degradation of Ik. B
Time 0 Time 10 Time 5 Time 20
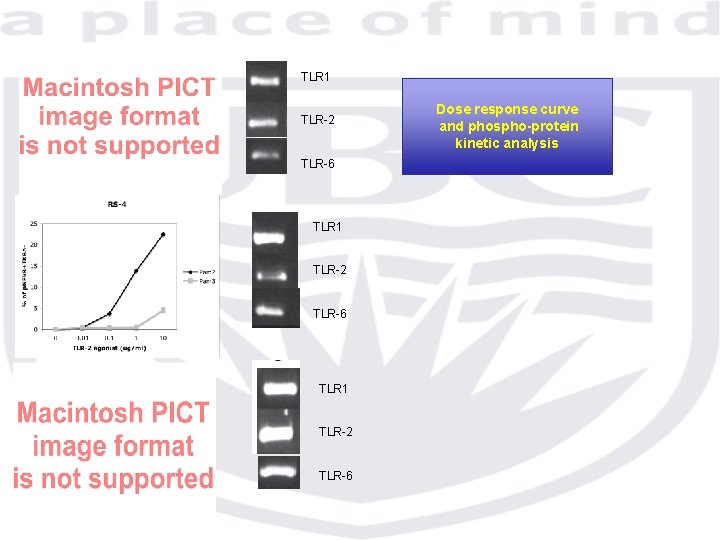
TLR 1 TLR-2 TLR-6 Dose response curve and phospho-protein kinetic analysis
B-cell acute lymphoblastic leukemia: IL-7 R expression Healthy control Ig Light chain B-ALL relapse IL-7 Ra
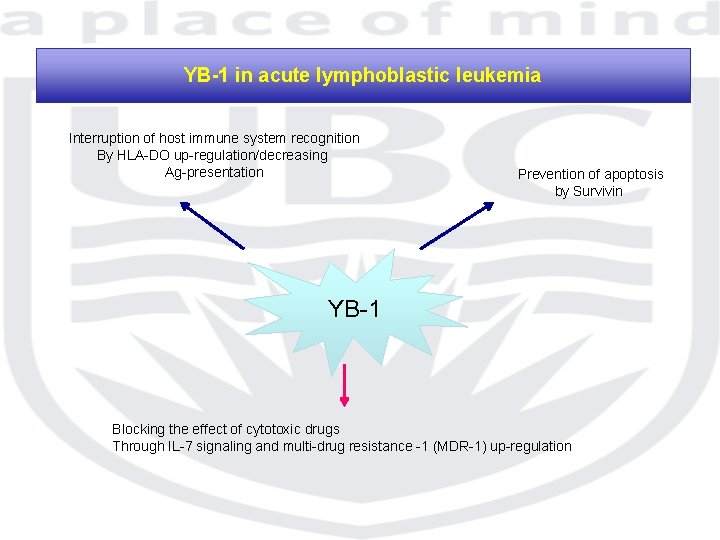
YB-1 in acute lymphoblastic leukemia Interruption of host immune system recognition By HLA-DO up-regulation/decreasing Ag-presentation Prevention of apoptosis by Survivin YB-1 Blocking the effect of cytotoxic drugs Through IL-7 signaling and multi-drug resistance -1 (MDR-1) up-regulation
Novel IL-7 signaling pathway in B-cell ALL Phosphorylation of YB-1 p. YB-1 No IL-7 stimulated CD 19
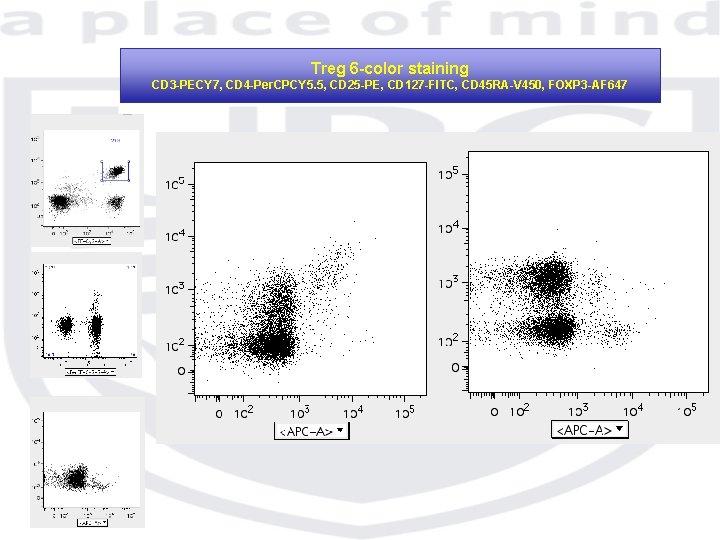
Treg 6 -color staining CD 3 -PECY 7, CD 4 -Per. CPCY 5. 5, CD 25 -PE, CD 127 -FITC, CD 45 RA-V 450, FOXP 3 -AF 647
Immunophenotyping on preserved whole blood sample using Cyto-Chex BCT tube
B-cell Immunophenotyping
CD 19+ (Pacific Blue) gated cells Peripheral Blood Bone marrow Ig. D-FITC CD 27 -PE CD 10 -APC CD 27 -PE
Whole blood Treg phenotyping using e. Bioscience Kit CD 3 -APCH 7, CD 4 -AF 700, CD 25 -PE, Helios-AF 488, FOXP 3 -V 450 CD 3+CD 4+ gated T cells Cyto-Chex tube EDTA tube
Treg phenotyping and drug monitoring of an unique IPEX case CD 3 -AF 488, CD 4 -Per. CPCy 5. 5, CD 25 -PE, CD 127 -BV 421, FOXP 3 -AF 647 HD IPEX CD 25 -PE FOXP 3 -AF 647
CD 25 -PE HD IPEX CD 127 -BV 421
Immuno-supressor Monitoring detection of surface CD 69 up-regulation upon CD 2 activation (IPEX patient) CD 3+CD 4+ gated T cells Un-stimulated Stimulated Corticosteroid Sirolimus
The Minimum Information about Flow cytometry Experiment (MIFlow. Cyt) Ref: Cytometry part A 73 A: 926 -030 2008
MIFlow. Cyt Simplify cross-platform comparison and integration,
MIFlow. Cyt • Experimental overview: – Purpose/goal hypothesis – Experiment variables – Conclusions – Quality control
MIFlow. Cyt • Flow sample (specimen): – Material – Source/organism/location – Treatment – Reagent/analyte/detector/reporter
MIFlow. Cyt Data presentation • Experimental and Sample Information: – Experimental design – Sample preparation reagents – Fluorescent reagents • Vendor • Catalog number • Clone
MIFlow. Cyt Data presentation • Data acquisition: – Instrument configuration – Instrument identification – Fluidics configuration – Optical configuration – Electronic configuration
MIFlow. Cyt Data presentation • Data presentation: – Flow plots • Label both axis • Fluorophore and antibody • Scale obvious – Total events
MIFlow. Cyt Data presentation • Data presentation: – Flow plots • Label both axis • Fluorophore and antibody • Scale obvious – Total events
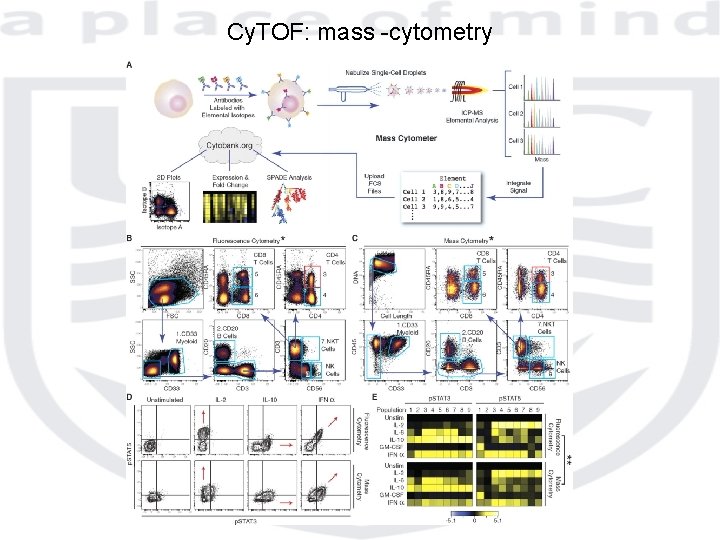
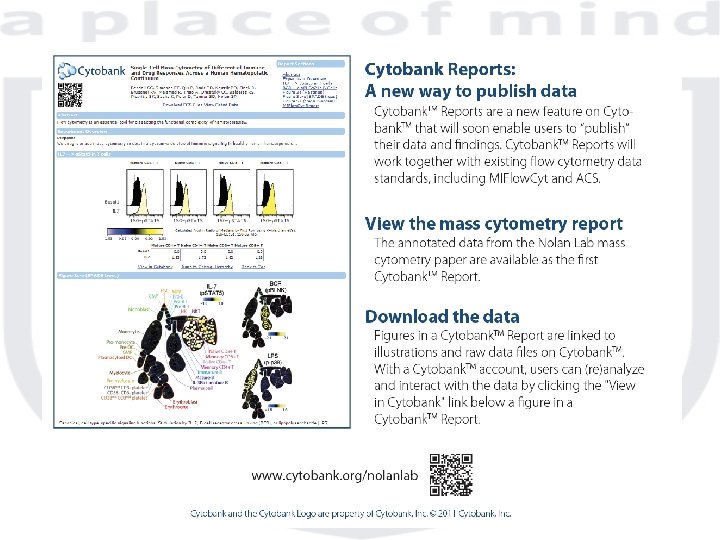
Cy. TOF: mass -cytometry
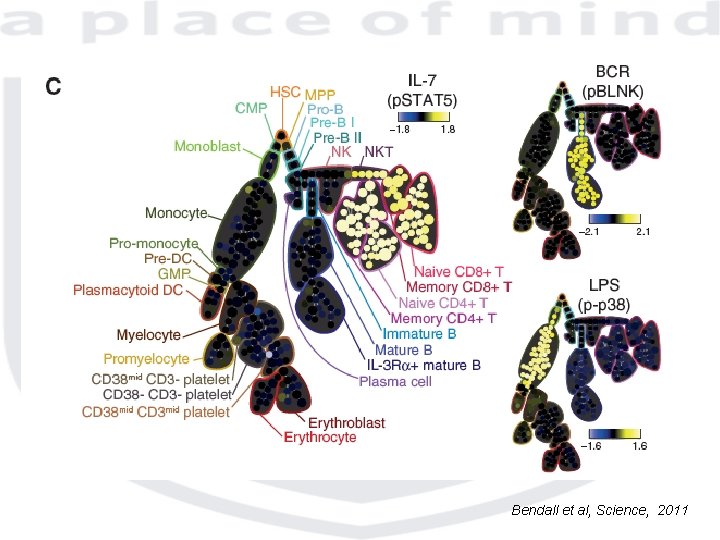
Bendall et al, Science, 2011
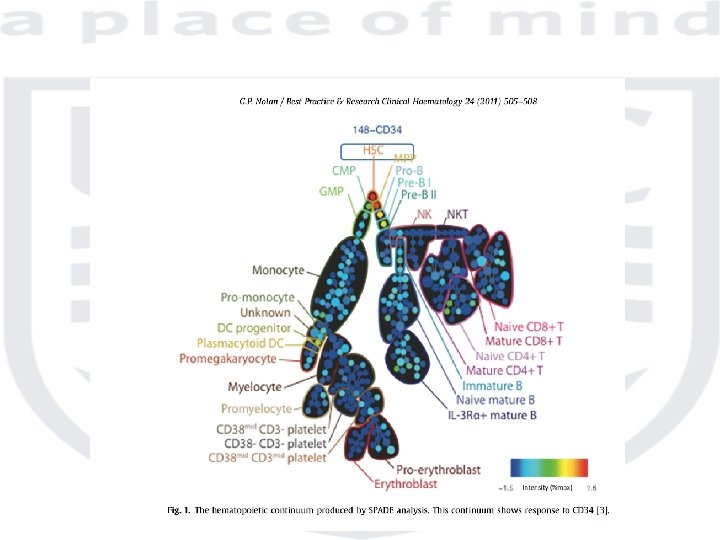

Child & Family Research Institute
- Slides: 42