AMERICAN PHYSIOLOGICAL SOCIETY ANNUAL MEETING Beyond the Weight

AMERICAN PHYSIOLOGICAL SOCIETY ANNUAL MEETING

Beyond the Weight Room: The Importance of Skeletal Muscle in Health and Disease Sponsored by the APS Education Committee Chaired by Edward Merritt, Southwestern University and John Durocher, Michigan Technological University Presented on April 6, 2019 Experimental Biology Orlando, Fla. For more information and to listen to other presentations: the-aps. org/Refresher-Skeletal. Muscle AMERICAN PHYSIOLOGICAL SOCIETY ANNUAL MEETING

Teaching the Etiology of Metabolic Disease from a Mitochondrial Bioenergetics Perspective Medical Physiology Refresher Course Experimental Biology 2019 P. Darrell Neufer, Ph. D. East Carolina Diabetes & Obesity Institute East Carolina University Greenville, NC

Prevalence of Self-Reported Obesity Among U. S. Adults 2011 2017

• Worldwide the rate of obesity has nearly doubled since 1980, with just over 200 million adult men and just under 300 million adult women obese. • Obesity rates have been steadily rising in children, too: In 2010, 43 million preschool children were overweight or obese, a 60 percent increase since 1990. Of all high income countries, the United States has the highest rates of overweight and obesity. Currently ~33% of the population is obese - a rate projected to rise to around 50 percent by 2030.

Age-Adjusted Prevalence of Diagnosed Diabetes Among U. S. Adults Aged 18 Years or older
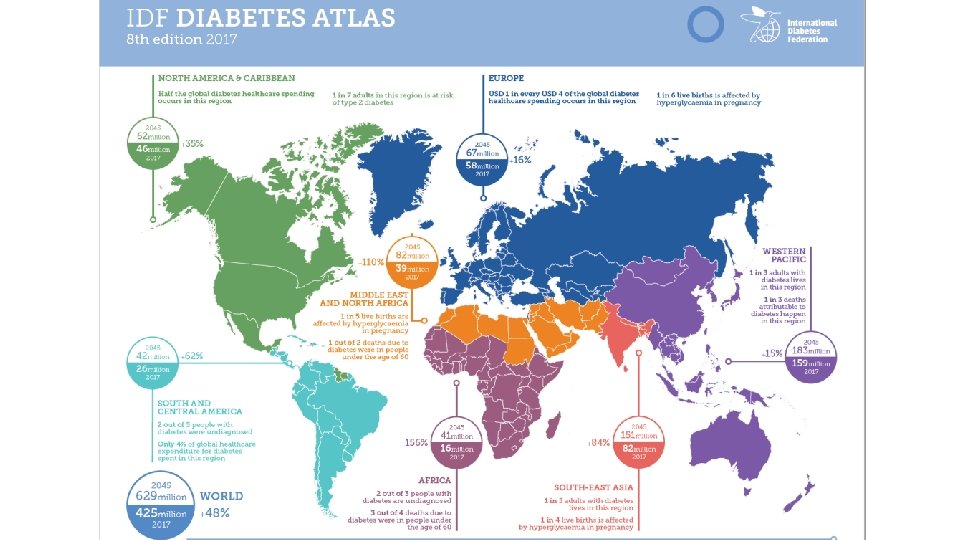

AFR: Africa EUR: Europe MENA: Middle East and North Africa NAC: North America & Caribbean SACA: South & Central America SEA: South-East Asia WP: Western Pacific

Projection of Diagnosed Diabetes Prevalence in US Adults as number by age and year as percent by age and year

As future physicians – obesity and the diseases stemming from chronic metabolic imbalance are going to dominate your entire careers!

Etiology of Type 2 Diabetes Lets start with the basics…. Normal Insulin Resistance Type II Diabetes Insulin Glucose [] fasting Glucose 1 h Glucose ingestion 2 h 3 h 1 h 2 h Insulin 3 h 1 h 2 h 3 h Metabolic Imbalance >>>> Weight Gain 11

Pathophysiology of Type 2 Diabetes

Distribution of Glucose After a Meal

We have two fundamental questions… What causes the development of insulin resistance? What causes the complications of type 2 diabetes? How can diabetes be prevented and treated? Stick with me….

Life Emanates from the Flow of Electricity e- e- e- Respiration Food + O 2 H 2 O + CO 2 Photosynthesis

Oxygen is the Driving Force for Life! O 2

4% OXYGEN 10 -20% OXYGEN 35% OXYGEN 15% OXYGEN 27% OXYGEN 21% OXYGEN Humans -6 to -2 MYA
")
Generating Electron Flow Hydrogen Atom 1 s Electronegativity Oxygen Atom Hydrogen Molecule (H 2) 2 s 2 p 1 s Oxygen Molecule (O 2)

Bioenergetic Perspective “Driving Forces” Weaker Magnet 1 kg∙s-2∙A-1 Stronger Magnet 100 kg∙s-2∙A-1 Magnetic Field Strength H 2 e- O 2 H 2 e- NAD+ Reduction Potential

Reduction Potentials The potential of a chemical species to acquire electrons – to become “reduced” NAD+ + 2 e- + H+ ↔ NADH “Oxidation” is the opposite: the process of a chemical species giving up its electrons – to become “oxidized” All reactions releasing electrons referred to as “oxidation” because O 2 is the ultimate electron acceptor… O 2 + 4 H+ 4 e - ↔ 2 H 2 O

Half Cell Reactions Eo΄= Reduction Potential under standard temperature & pressure conditions Eo΄= 0 Eo΄= -320 m. V Volt meter Oxidized Reduced NAD+ H 2 NADH - ec tro el e- Electron flow + agar salt bridge de Eo΄= -320 m. V 2 H+ Reduced Oxidized Start with 1 M [ ] each of NAD+ and NADH Start with H 2 and 2 H+ at equilibrium NAD+ NADH Reference 1 M [ ] of each H 2 2 H+ Test

Half Cell Reactions Eo΄= Reduction Potential under standard temperature and pressure conditions Eo΄= 0 Oxidized Reduced NAD+ H 2 NADH # of electrons absolute temperature gas constant Eo΄= -320 m. V e- Faraday’s Constant (96, 485 coulombs/mole) 2 H+ Reduced Oxidized Start with 1 M [ ] each of NAD+ and NADH Start with H 2 and 2 H+ at equilibrium natural log Eo΄ = -(RT/n. F) ln [oxidized] [reduced] What happens to the [NAD+] & [NADH] as reactions equilibrate? What does E equal at equilibrium?

Quantifying Reduction Potential Half Cell Reactions Eo’ = Standard Reduction Potential +815 m. V Reduced -V 2 H 2 e- e. Eo’ = 0 m. V 4 H+ Oxidized + ee- Oxidized O 2 1 M Eo’ = +815 m. V 2 H 2 O 1 M Reduced Reduction Potential Eo’ = -(RT/n. F) ln [oxidized] [reduced] One of the highest standard reduction potentials in nature

Generating Electron Flow Glycolysis/ TCA Cycle Glucose + 4 ADP + 4 Pi + 2 H 2 O 6 CO 2 + 4 ATP + 16 H H 2 O O 2

Generating Electron Flow Glycolysis/ TCA Cycle Glucose + 4 ADP + 4 Pi + 2 H 2 O 6 CO 2 + 4 ATP + 16 H NAD+ NADH O 2 -320 m. V +816 m. V NAD+ H 2 O What is the driving force? ΔEo’ = 1, 136 m. V What is the regulator?

Electron Transport System Using big drops in redox energy to do work Constant Supply RC 2+ RC 3 H -320 m. V -50 m. V NAD+ RC 2 H NADH e- Δ = 270 m. V RC = redox couple Constant Supply RC 4+ RC 5 H +10 m. V +400 m. V +450 m. V +816 m. V RC 3+ RC 4 H RC 5+ H 2 O e- Δ = 60 m. V e- Δ = 290 m. V e- Δ = 50 m. V What is the driving force? What is the regulator? e- O 2 Δ = 366 m. V

Principles of Mitochondrial Bioenergetics “Back Pressure” Static Head ++ ++ + + + +++ + + +- + + ee e cyto c e I e QH III Q Inner e e e- IV e membrane + + H + e O + 4 H+ 22 2 NADH 2 H 2 O NAD+ • The electron transport chain is composed of redox couples in series, each with greater reduction potential than the one before, leading to oxygen. • Complexes I, III and IV use big drops in energy to pump protons. • Electron flow cannot occur without proton pumping. Proton pumping cannot occur without electron flow.
![Principles of Mitochondrial Bioenergetics Proton Motive Force (pmf) pmf = Δ[H+] + Δ membrane](http://slidetodoc.com/presentation_image_h2/aff4d719378287f561a2d41fff4cf5e4/image-28.jpg "Principles of Mitochondrial Bioenergetics Proton Motive Force (pmf) pmf = Δ[H+] + Δ membrane")
Principles of Mitochondrial Bioenergetics Proton Motive Force (pmf) pmf = Δ[H+] + Δ membrane potential pmf = Δp. H + ΔΨ 300, 000 V/cm high -230 m. V e- flow ∆Ψ low -130 m. V high ++ + + + ++ + +- + + e- ++ + + + + e cyto c e I e QH III Q Inner ee- IV e membrane + ATP H+ e+ H+ H+ + e O + 4 H+ 2 2 NADH NAD+ 2 H 2 O ADP
 -230 m. V e- flow ∆Ψ")
Principles of Mitochondrial Bioenergetics high Membrane potential (∆Ψ) -230 m. V e- flow ∆Ψ low high -130 m. V ++ + + + ++ + + + + cyto c I e QH 2 H+ H+ + e NADH III Q IV + ATP + H+ O 2 + 4 H+ 2 H 2 O ADP NAD+ 1000 ATP/ADP 0. 0000001 -57 KJ/mol ∆GATP 0 KJ/mol
 -230 m. V e- flow ∆Ψ")
Principles of Mitochondrial Bioenergetics high Membrane potential (∆Ψ) -230 m. V e- flow ∆Ψ low high -130 m. V ++ + + + ++ + + + + cyto c I e QH 2 III Q H+ + e NADH NAD+ IV ATP + H+ O 2 + 4 H+ Na+/K+ gradients Ca 2+ sequestration Protein synthesis Contractile activity 2 H 2 O ADP 1000 ATP/ADP 1 -57 KJ/mol ∆GATP 0 KJ/mol
 2 e.")
Principles of Mitochondrial Bioenergetics high Food or Stored Energy Membrane potential (∆Ψ) 2 e. H+ + e - e- CO 2 e- NADH e- Biological Electrical Current NAD+ III Q H+ CO 2 high -130 m. V ++ + + + ++ + + + + cyto c I e QH e. CO 2 low e- flow ∆Ψ low e- -230 m. V IV + ATP + H+ O 2 + 4 H+ Drawing Current 2 H 2 O ADP Two Regulators: 1000 1. ATP utilization rate – sets rate of proton conductance ATP/ADP 2. Proton conductance (∆Ψ) – sets rate of electron flow 0. 0000001 -57 KJ/mol ∆GATP 0 KJ/mol

Principles of Mitochondrial Bioenergetics max ΔGPMF Glycolysis Brake 1 min + + ++ ++ + + + ++ ++ + + + + Cyt c e Q I III IV V e + e- TCA Cycle e- e- β-oxidation Biological Electrical Currents! e. NADH + e- + + O 2 NAD+ 4 H+ + 2 H 2 O ADP + + ATP max ΔGRedox “Pull” ΔGATP min Brake 2

Biological Currents are “Pressurized” max ΔGPMF Glycolysis H 2 O 2 Brake 1 min + + ++ ++ + + + ++ ++ + + + + Cyt c e Q I III IV V e + e- TCA Cycle e- e- e. NADH + NAD+ + + e- O 2 4 H+ + 2 H 2 O ADP O 2 -∙ + + ATP max β-oxidation Biological Electrical Currents! e- H 2 O 2 ΔGATP min ΔGRedox “Pull” Brake 2

“Push” Increases the “Reducing Pressure” Food “Push” max ΔGPMF Glycolysis H 2 O 2 Brake 1 min + + ++ ++ + + + ++ ++ + + + + Cyt c e Q I III IV V - “Push” e + e- TCA Cycle e- e- e. NADH + NAD+ + + e- O 2 4 H+ + 2 H 2 O ADP O 2 -∙ + + ATP max β-oxidation Biological Electrical Currents! e- H 2 O 2 ΔGATP min ΔGRedox “Pull” Brake 2

H 2 O 2 Emission Linked to Insulin Resistance Food “Push” max ΔGPMF Glycolysis Insulin Resistance H 2 O 2 Brake 1 min + + ++ ++ + + + ++ ++ + + + + Cyt c e Q I III IV V - “Push” e + e- TCA Cycle e- e- e. NADH + NAD+ + + e- O 2 4 H+ + 2 H 2 O ADP O 2 -∙ + + ATP max β-oxidation Biological Electrical Currents! e- H 2 O 2 ΔGATP min ΔGRedox “Pull” Brake 2

Respiratory Clamp Titration of ADP Lin et al. , unpublished data ↑Fuel - HFD ↑Activity
 Pressure Release Pressure Increases + + + ++ + +")
Fuel Additional supply (food) Pressure Release Pressure Increases + + + ++ + + + + + + + + ++ + + + Energy Expenditure Valve decrease flow

Schematic Illustration Showing Predicted Fluctuations in Mitochondrial Membrane Potential Person B Active Caloric balance Mitochondrial Membrane Potential -180 Mitochondrial Membrane Potential Person A Sedentary Caloric surplus A. H 2 O 2 Generation ~90% = Meal -170 -160 0 -150 -140 -130 0600 -180 B. O 2 Consumption 1200 1800 2400 H 2 O 2 Generation -170 -160 -150 Exercise Session -140 O 2 Consumption -130 0600 1200 1800 Time of Day Muoio & Neufer Cell Metab. 15: 595 -605, 2012 2400 ~90%

Two More Pieces to the Puzzle max ΔGPMF Glycolysis H 2 O 2 Brake 1 min + + ++ ++ + + + ++ ++ + + + + Cyt c e Q I III IV V e + e- TCA Cycle e- e- e. NADH + NAD+ + + e- O 2 4 H+ + 2 H 2 O ADP O 2 -∙ + + ATP max β-oxidation Biological Electrical Currents! e- H 2 O 2 ΔGATP min ΔGRedox “Pull” Brake 2
![Membrane Potential also Drives High [NADPH] max ΔGPMF Glycolysis H 2 O 2 Brake](http://slidetodoc.com/presentation_image_h2/aff4d719378287f561a2d41fff4cf5e4/image-40.jpg "Membrane Potential also Drives High [NADPH] max ΔGPMF Glycolysis H 2 O 2 Brake")
Membrane Potential also Drives High [NADPH] max ΔGPMF Glycolysis H 2 O 2 Brake 1 min + + ++ ++ + + + ++ ++ + + + + Cyt c e Q I III IV V NNT e + e- TCA Cycle e- e- β-oxidation Biological Electrical Currents! e. NADH + NAD+ e- + + e- O 2 4 H+ 2 H 2 O + ++ ADP O 2 -∙ H 2 O 2 ATP NADH NAD+ e. NADP+ ++ e- NADPH max NADPH/NADP+ ΔGNADPH min

Biological Currents are “Pressurized” max ΔGPMF Glycolysis H 2 O 2 Brake 1 Proteome min + + ++ ++ + + + ++ ++ + + + + Cyt c e Q I III IV V NNT e + e- TCA Cycle e- e- β-oxidation Biological Electrical Currents! e. NADH + NAD+ e- + + e- O 2 4 H+ 2 H 2 O + ++ ADP O 2 -∙ H 2 O 2 H 2 O ee- GSH Trxred GSSG Trxox NADH NAD+ e- ++ ATP e- NADPH NADP+ ee- NADPH Compensatory Mechanism for Energy Expenditure! e-

Nutritional Overload Food H 2 O + CO 2 CVD +++ + + ATP e- Cellular Redox State Oxidized Reduced Diabetes ADP GSSG Trx Aging H 2 O 2 ee- Parkinsons + + + ++ + + + ++ ++ +++++++ ++ NADPH e. GSH Trx. H Cancer e- Batteries NADH + O 2 SH SH Redox Sensor S S Redox Sensor ~22 K redox H 2 O sensitive thiols in the proteome O 2

Take Away Points 1. We are a demand-based system - energy expenditure is a function of energy demand. max ΔGPMF Glycolysis H 2 O 2 Brake 1 Proteome min + + ++ ++ + + + ++ ++ + + + + Cyt c e Q I III IV V NNT e + e- TCA Cycle e- e- β-oxidation Biological Electrical Currents! e. NADH + NAD+ e- + + e- O 2 4 H+ 2 H 2 O + ++ ADP O 2 -∙ H 2 O 2 H 2 O ee- GSH Trxred GSSG Trxox NADH NAD+ e- ++ ATP e- NADPH NADP+ ee- NADPH Compensatory Mechanism for Energy Expenditure! e-

Take Away Points 2. Energy intake in excess of that needed to replenish energy reserves puts pressure on the system. Ene Exp rgy end iture Energy Balance Insulin Resistance Ene rg Inta y ke Diabetes
 must")
Take Away Points 3. Decreasing the pressure (i. e. , restoring energy balance) must be part of the long term solution. Surplus Caloric Intake Pressure Release Mitochondrial Membrane Potential Fuel -180 -160 -150 -140 Energy Expenditure O 2 Consumption -130 Mitochondrial Membrane Potential Reducing Pressure increase flow H 2 O 2 Generation -170 -180 + + + ++ + + + + + + + + ++ + + + A. B. H 2 O 2 Generation -170 -160 -150 Exercise Session -140 O 2 Consumption -130 0600 1200 1800 Time of Day 2400
 NADP+ O 2 ee- O 2 e- e-")
Disease Aging Oxidation O 2 (ΔGRedox) NADP+ O 2 ee- O 2 e- e- e- NADPH H 2 O Redox e. Charge - ee e e + + + ++ + + + + + + + + ++ + + + Charged Battery (ΔGATP) ADP ATP Energy Charge

Questions max ΔGPMF Glycolysis H 2 O 2 Brake 1 Proteome min + + ++ ++ + + + ++ ++ + + + + Cyt c e Q I III IV V NNT e + e- TCA Cycle e- e- β-oxidation Biological Electrical Currents! e. NADH + NAD+ e- + + e- O 2 4 H+ 2 H 2 O + ++ ADP O 2 -∙ H 2 O 2 H 2 O ee- GSH Trxred GSSG Trxox NADH NAD+ e- ++ ATP e- NADPH NADP+ ee- NADPH Compensatory Mechanism for Energy Expenditure! e-

AMERICAN PHYSIOLOGICAL SOCIETY ANNUAL MEETING
- Slides: 48