Amazon Rainforest and Fire Tropical rainforests cover 7


 on NASA’s Aqua satellite")


, accidental fire, and")


 2. 1")

- Slides: 30
Amazon Rainforest and Fire
Tropical rainforests cover ~7 percent of land surface
Amazon covers over half a billion hectares
Climate associated with Amazon Rainforest • ~75 degrees F year-round, little change in daylength year-round • Variable precipitation: wet and dry seasons Wet’ and ‘Dry’ characterize the seasons in the Amazon. From January through April south of the equator, the Amazon basin gets about 10 mm (0. 4 inches) of rain a day— 300 mm (1 foot) a month! In June, July, and August the same region averages 2 mm (0. 08 inches) a day.
This map shows which of three key climate factors most limits plant growth in an area (red is water; green is sunlight; blue is temperature). The Amazon is strongly limited by the availability of sunlight: there is plenty of water and it’s always warm, but clouds often veil the Sun, slowing photosynthesis. (Image by Robert Simmon, NASA Earth Observatory, based on data provided by the University of Montana NTSG. )
World’s largest air conditioner Transpiration-Evaporation of water from plant leaves
• Vegetation of Amazon Rainforest -Vertical complexity -Extremely deep taproots -High biological diversity -Trees contain 90 -140 billion tons of carbon
• Fire in the Amazon Rainforest -400 -700 year fire cycles in extreme drought years -forests historically acted as fire breaks to adjacent burning by ranchers and farmers
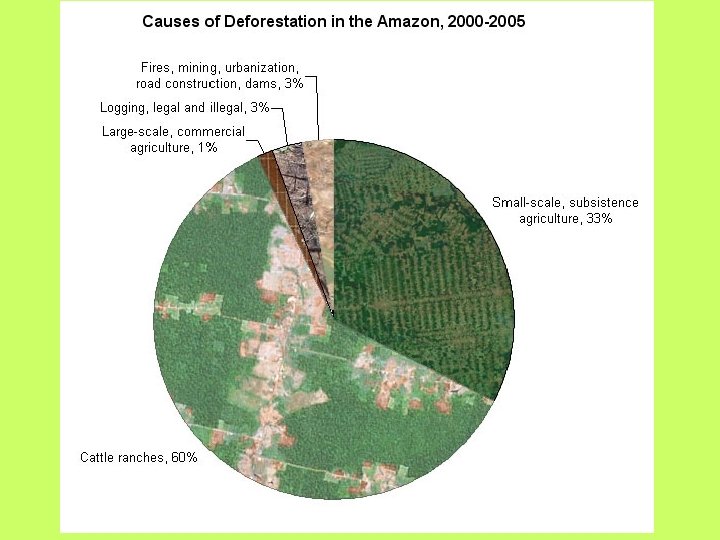
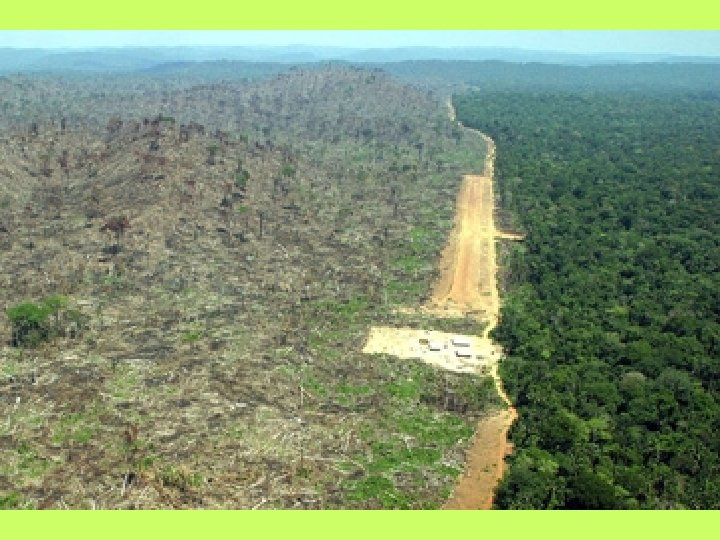
Threats to the Amazon Rainforests are disappearing at ~80 acres/minute This area cleared by soybean farmers in Novo Progreso was photographed in 2004
Cochrane estimated that more than half of what was counted as deforested in 1994 -95 was actually cleared by accidental fires. In satellite observations, such as the two example regions shown here, intentionally cleared forest areas had sharp, geometric edges (olive green shapes in top image) and usually extended from existing pasture (light yellow). Areas cleared by accidental fire (red, bottom image) had more ragged edges and were often far from developed land. The burned areas began to regrow shortly after the El Niño—another indication they were accidentally cleared. (Map adapted from Cochrane, 2000
Amazon forest loss dropped from Aug 2008, before nearly doubling from Aug 2007 until the end of the year.
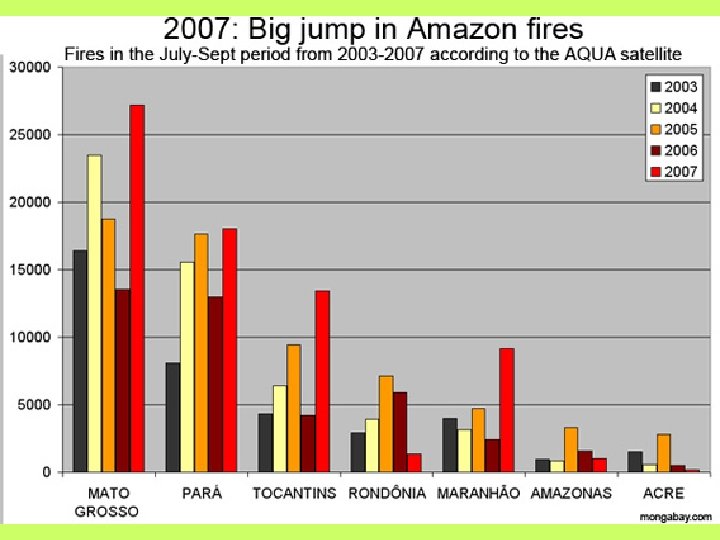
On September 29, 2007, the Moderate Resolution Imaging Spectroradiometer (MODIS) on NASA’s Aqua satellite captured this image of the southern Amazon, showing widespread fires (locations marked in red) in the state of Mato Grosso, Brazil. NASA image courtesy the MODIS Rapid Response Team, Goddard Space Flight Center.
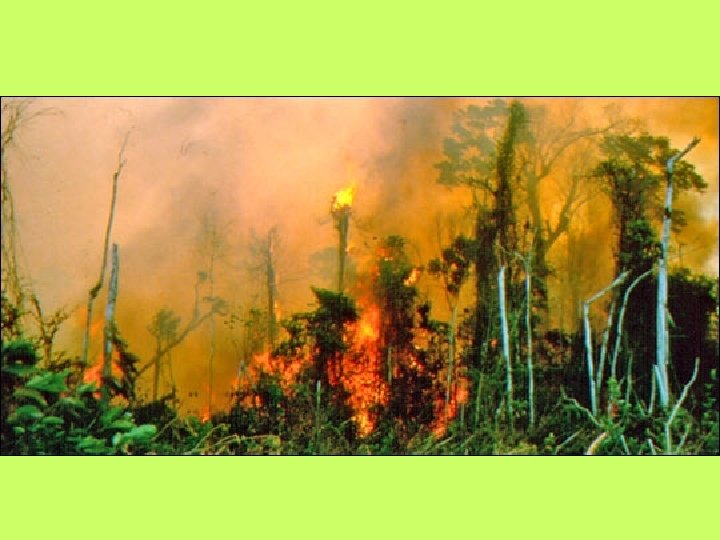
Fires in the Amazon start small—low, slow-moving blazes that feed on the thin layer of dead leaves and detritus on the forest floor. With natural fires so rare, occuring perhaps once every 1, 000 years, even these small fires kill some trees. Once they fall, holes left in the rainforest’s protective canopy dry out the understory, setting the stage for a new round of more destructive fires. (Photograph copyright Woods Hole Research Center)
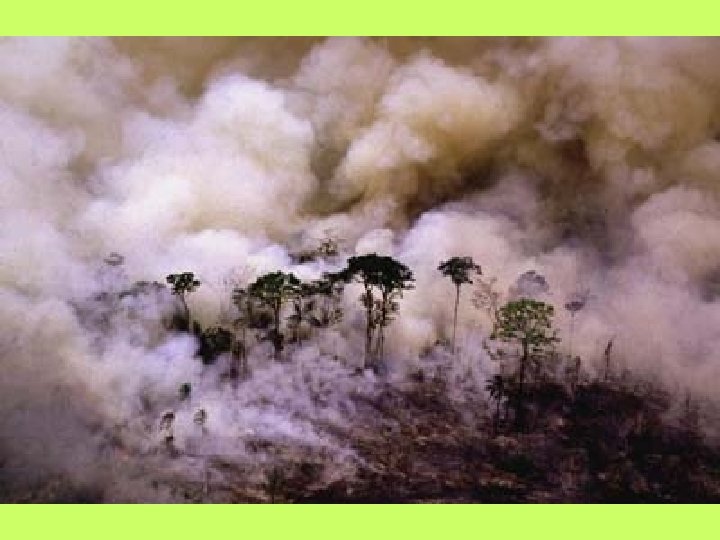
Clearings in the Amazon increase the flammability of the forest. Sunlight penetrates into the understory, warming and drying the forest floor, which is normally protected by the dense canopy. Selective logging, permitted on some protected forest land, also produces breaks in the canopy and increases fire risk. (Photograph Copyright Lucia Enriconi, Miami Museum of Science)
Positive feedback cycle between forest understory fire, selective logging, and forest flammability. Both understory fire and logging open the canopy, kill trees, and increase the fuel load on the forest floor, increasing forest vulnerability to fire.
Positive feedback cycle between extensive production systems (e. g. cattle pasture), accidental fire, and damages to intensive production systems (e. g. tree plantations and agroforestry systems). Fires used in the establishment of cattle pasture and farm plots, and in pasture management, often burn beyond their intended boundaries, damaging perennial crops, agroforestry systems, and forest management systems. These losses encourage producers to continue their use of extensive production systems, perpetuating the fire cycle.
The positive feedback cycle between land-use change, smoke emissions and climate. Smoke released by fires inhibits rainfall. The transformation of forests into pastures may also inhibit rainfall by reducing evapotranspiration and the absorption of solar radiation by vegetation. El Niño episodes provoke droughts in Amazônia, and may increase in the future through global warming.
Fires are widespread along the south and east edges of the Amazon, and flammable forests are located deep in the heart of the region. Fire threatens to transform the dense rainforest into scrub and grassland. This map shows the state of the forest and occurence of fires in 1998. (Map adapted from Nepstad et al. , 2001)
A map of Amazonia 2030, showing drought-damaged, logged and cleared forests assuming the last 10 years of climate are repeated in the future. See text for further details. PPT, precipitation. Map from Nepstad et al (2008).
CARBON CYCLE atmosphere has about 750 Gt 40, 000 Gt of carbon in the hydrosphere, biosphere and atmosphere 38, 000 Gt in the deep ocean 70, 000 Gt of carbon in rocks
What does 1 ton of CO 2 look like? 27 ft 3 1 ton of CO 2 is equal to 3. 66 tons of carbon
What is your carbon footprint? www. carbonify. com Small car (40 mpg) 2. 1 tons of carbon for 600 miles/month; mid car (21 mpg) 4 tons; SUV/truck (15 mpg) 5. 6 tons 0. 87 tons of carbon for roundtrip Denver. Chicago (1800 miles) 1. 5 tons of carbon for eating meat Need six 25 year old pine trees to offset 1 ton of carbon emissions. One tree absorbs 15 lbs (6. 82 kgs) of CO 2 per year.
Amazon rainforest 90 -140 Gt