
Amazon Business Jerrod Steele Enterprise Manager of the

Amazon Business Jerrod Steele Enterprise Manager of the Commercial Sales Amazon Business 1
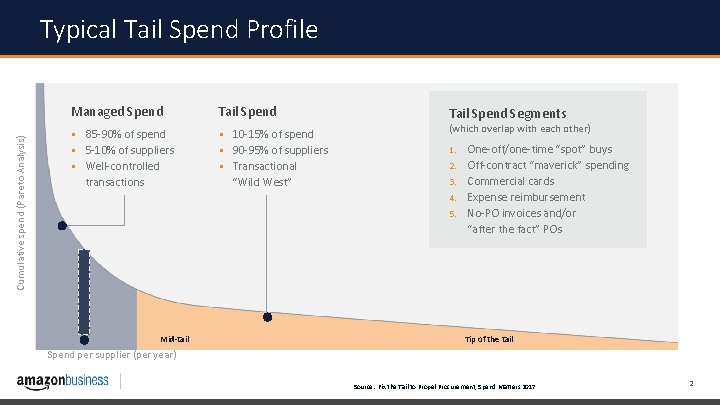
Cumulative spend (Pareto Analysis) Typical Tail Spend Profile Managed Spend Tail Spend § 85 -90% of spend § 10 -15% of spend § 5 -10% of suppliers § 90 -95% of suppliers 1. § Well-controlled § Transactional 2. transactions “Wild West” Tail Spend Segments (which overlap with each other) 3. 4. 5. Mid-tail One-off/one-time “spot” buys Off-contract “maverick” spending Commercial cards Expense reimbursement No-PO invoices and/or “after the fact” POs Tip of the tail Spend per supplier (per year) Source: Fix the Tail to Propel Procurement, Spend Matters 2017 2
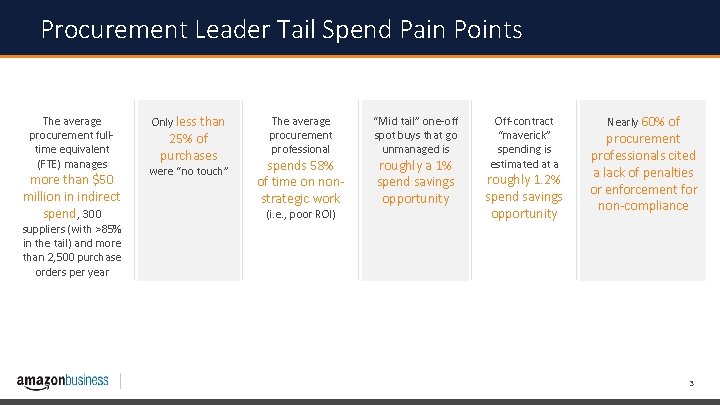
Procurement Leader Tail Spend Pain Points The average procurement fulltime equivalent (FTE) manages more than $50 million in indirect spend, 300 suppliers (with >85% in the tail) and more than 2, 500 purchase orders per year Only less than 25% of purchases were “no touch” The average procurement professional spends 58% of time on nonstrategic work (i. e. , poor ROI) “Mid tail” one-off spot buys that go unmanaged is roughly a 1% spend savings opportunity Off-contract “maverick” spending is estimated at a roughly 1. 2% spend savings opportunity Nearly 60% of procurement professionals cited a lack of penalties or enforcement for non-compliance 3
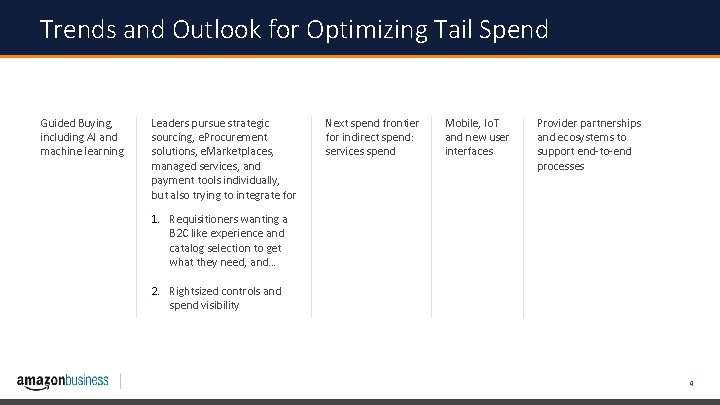
Trends and Outlook for Optimizing Tail Spend Guided Buying, including AI and machine learning Leaders pursue strategic sourcing, e. Procurement solutions, e. Marketplaces, managed services, and payment tools individually, but also trying to integrate for Next spend frontier for indirect spend: services spend Mobile, Io. T and new user interfaces Provider partnerships and ecosystems to support end-to-end processes 1. Requisitioners wanting a B 2 C like experience and catalog selection to get what they need, and… 2. Rightsized controls and spend visibility 4
- Slides: 4