AM 4 Modelling Linear Relationships Basic Concepts Graph

AM 4 – Modelling Linear Relationships

Basic Concepts: § Graph linear functions § Develop graphs of linear equations of the form y = mx § Interpret linear functions as models of physical phenomena § Develop linear equations from descriptions of situations § Interpret the point of intersection when two linear functions are graphed § Apply break-even analysis to simple business problems § Develop an understanding of direct linear variation

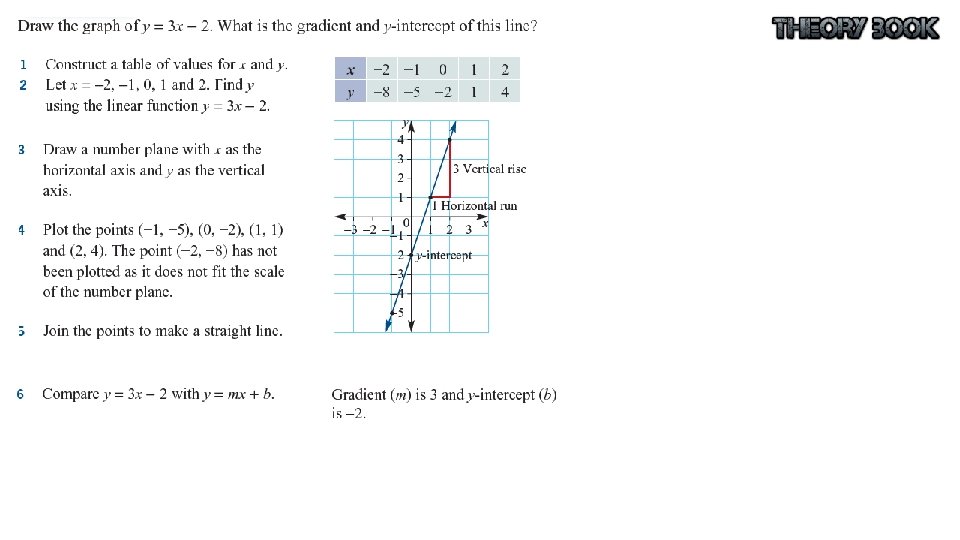
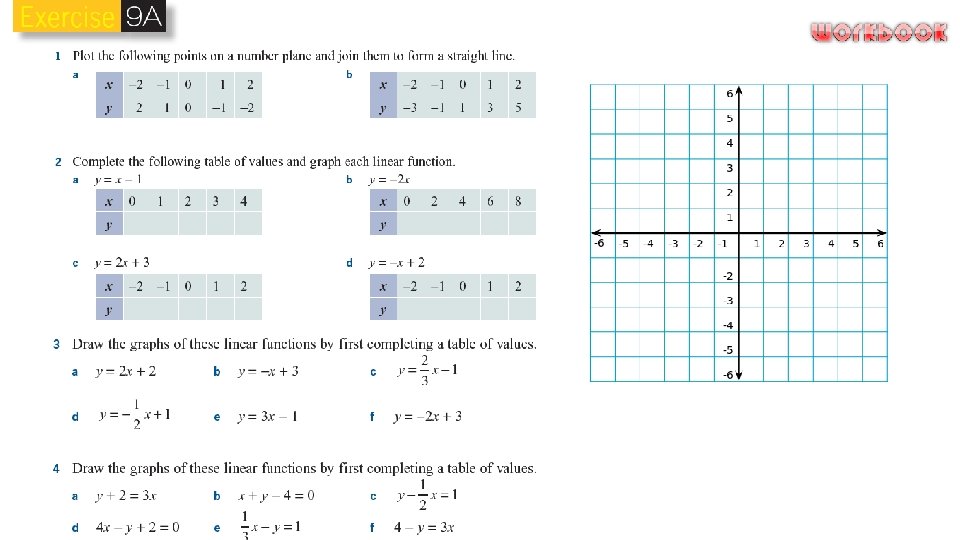
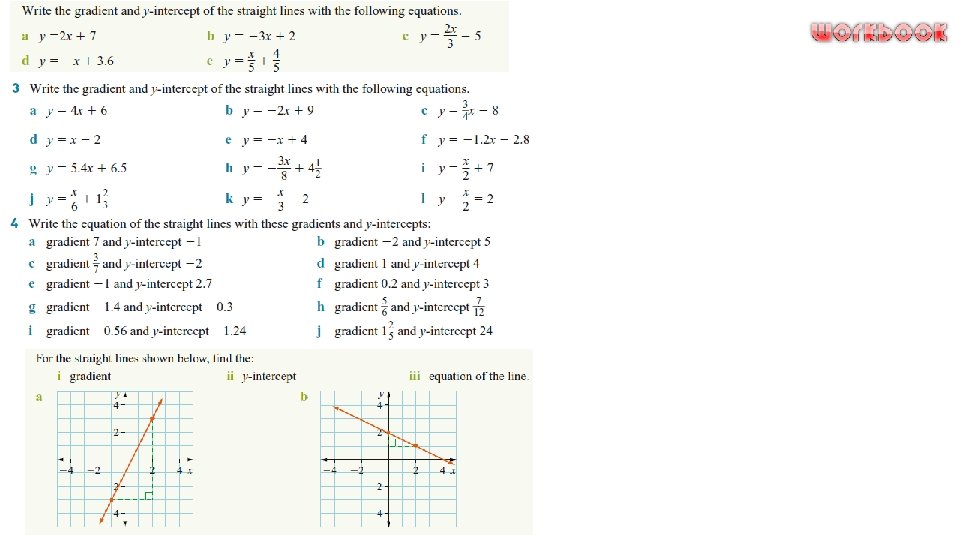
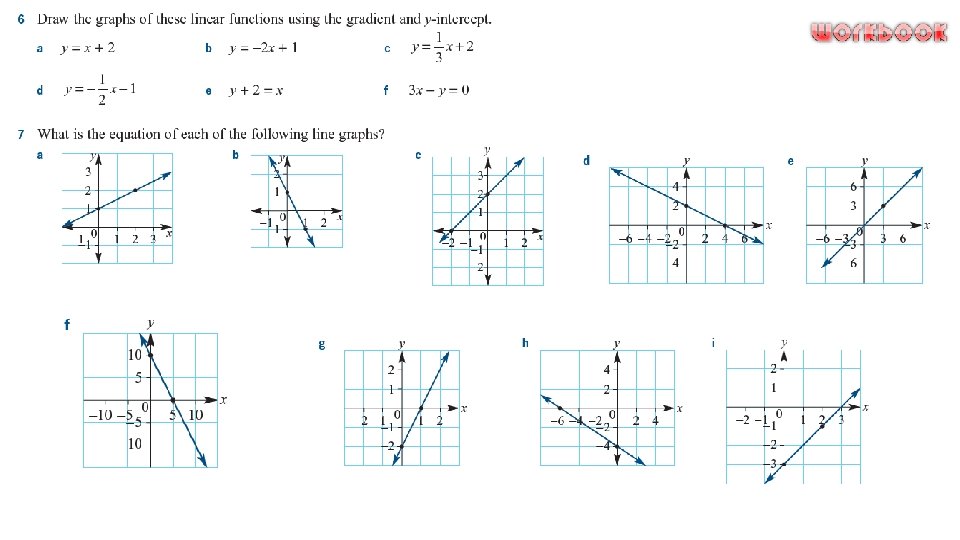
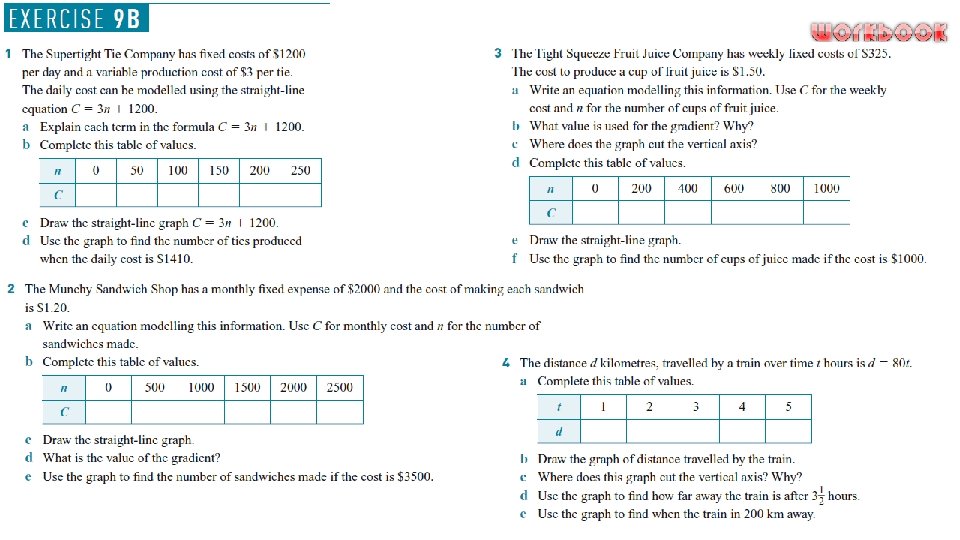
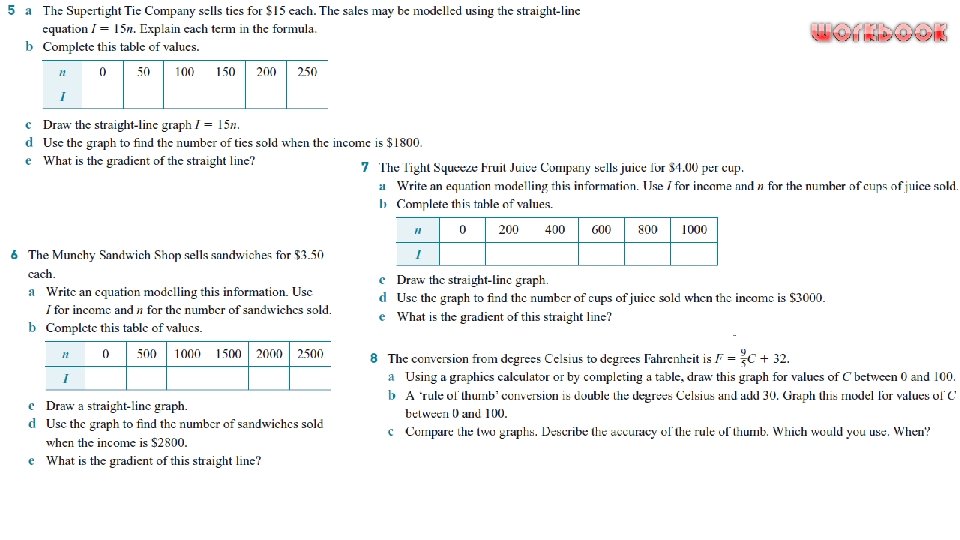
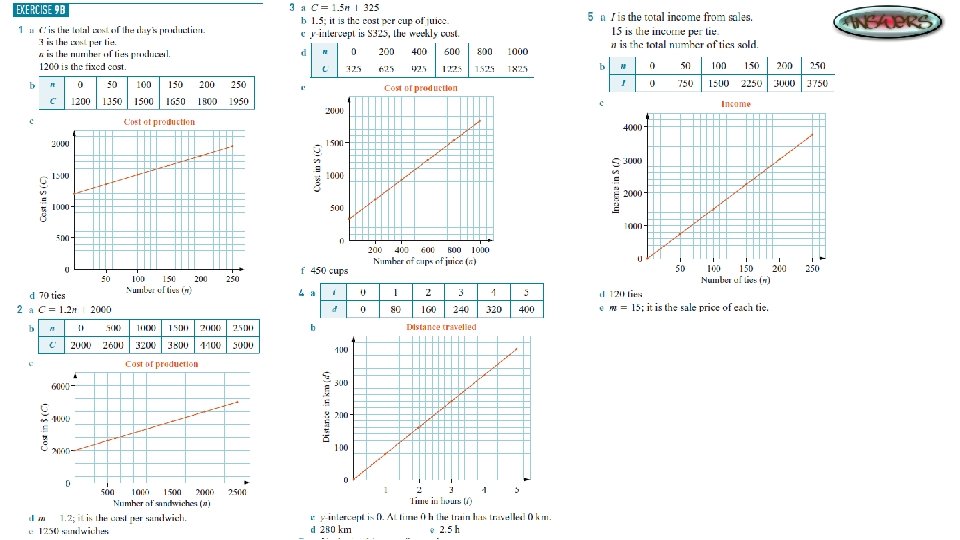
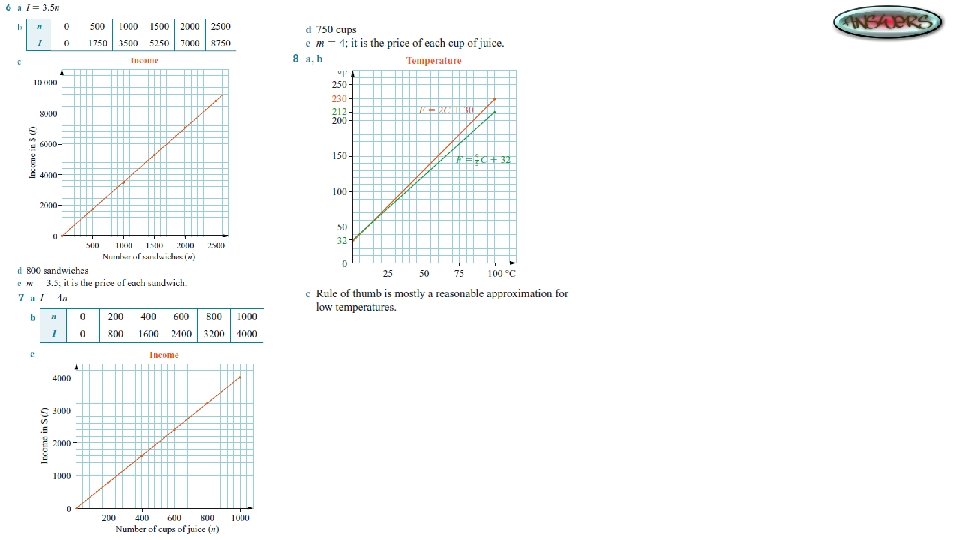
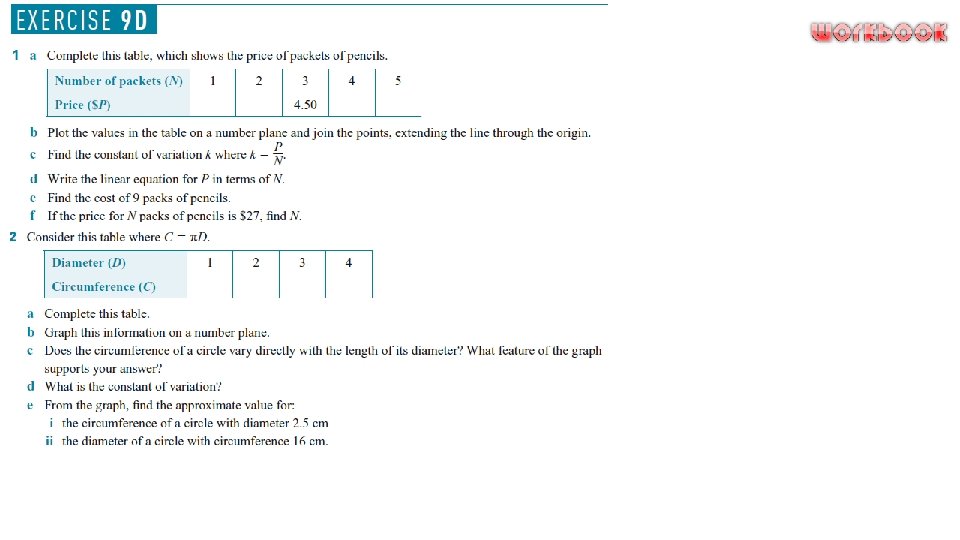
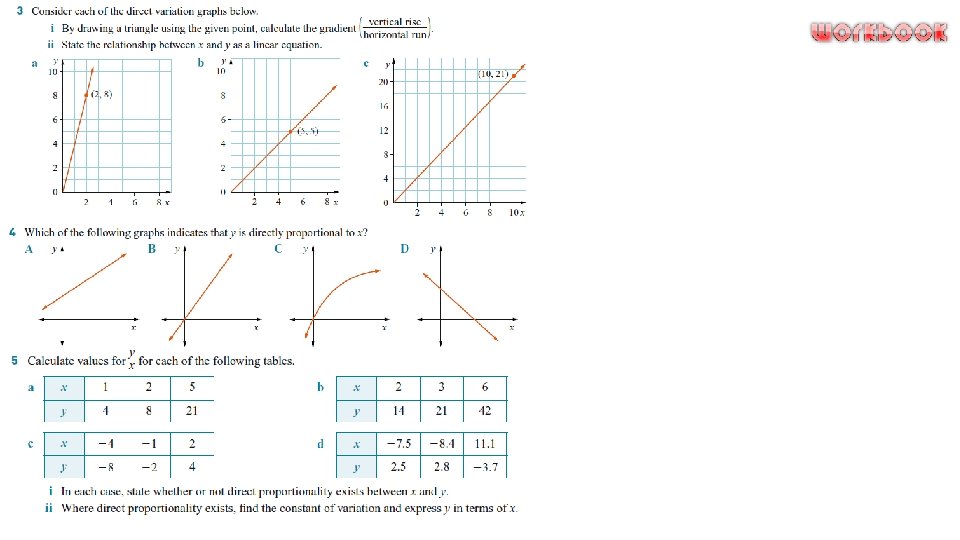
Graphing using Tables of Values To graph a linear function, construct a table of values with the independent variable as the first row and the dependent variable as the second row. Plot these points on the number plane with the independent variable on the horizontal axis and the dependent variable as the vertical axis. Join the points to make a straight line. Graphing using Gradient-Intercept Form When the equation of a straight line is written in the form y = mx + b it is called the gradient–intercept formula. The gradient is m or the coefficient of x. It is the slope or steepness of the line. The gradient of a line is calculated by dividing the vertical rise by the horizontal run. Lines that go up to the right (/) have positive gradients and lines that go down to the right () have negative gradients. The intercept of a line is where the line cuts the axis. The intercept on the vertical axis is called the yintercept and is denoted by the letter b.

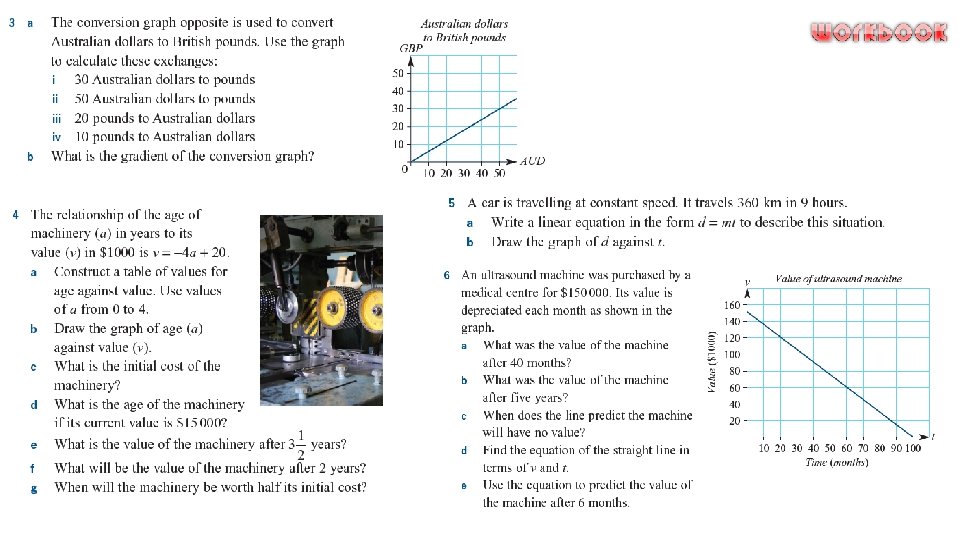
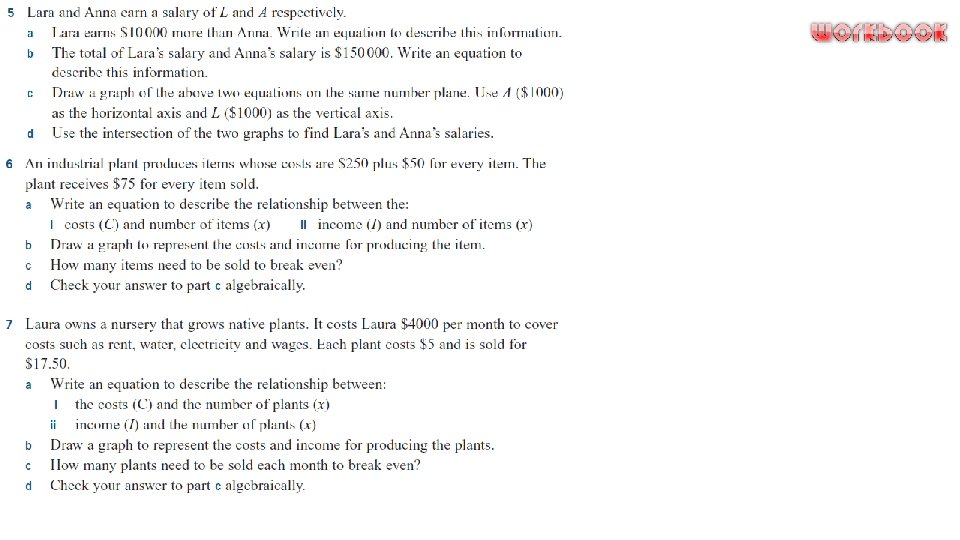
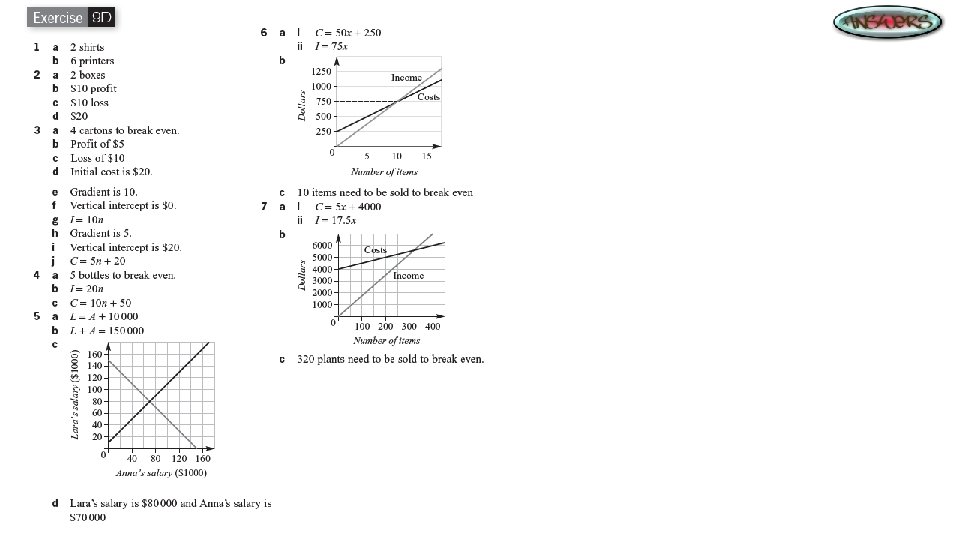
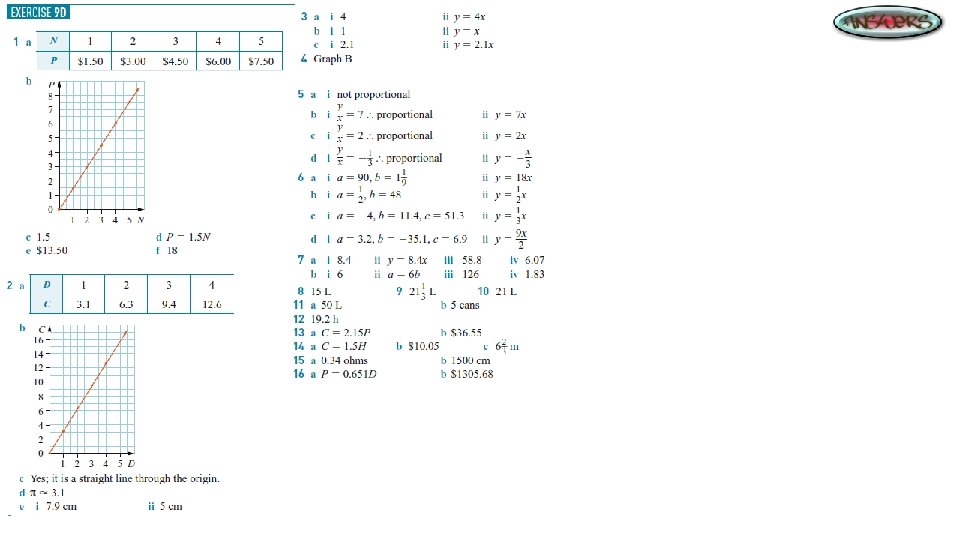
5 a

Linear Functions Linear functions can be used to model practical situations. The graph used as a model will be of the form y = mx + b. The gradient and y-intercept have practical meanings in each case. Usually the constant b is a fixed cost or amount, and the gradient m is the rate of change.

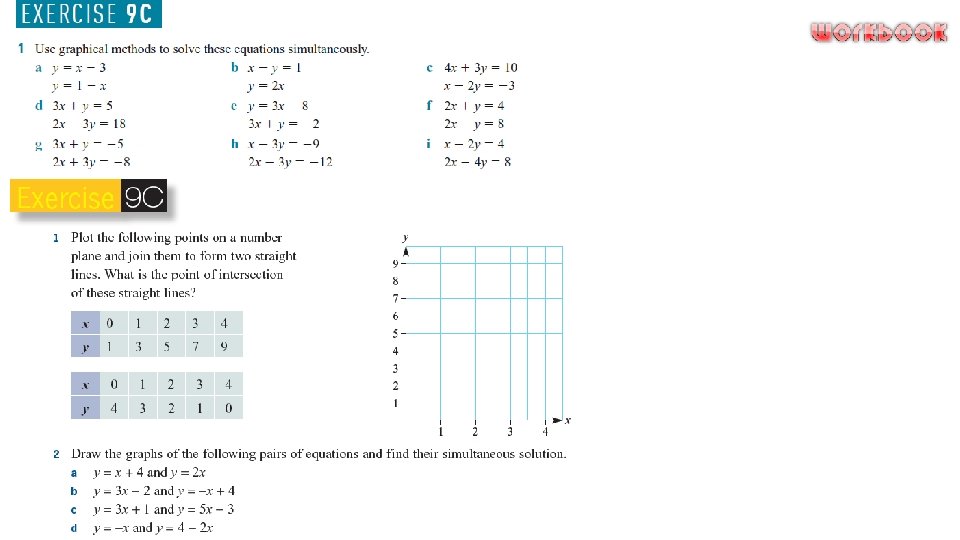
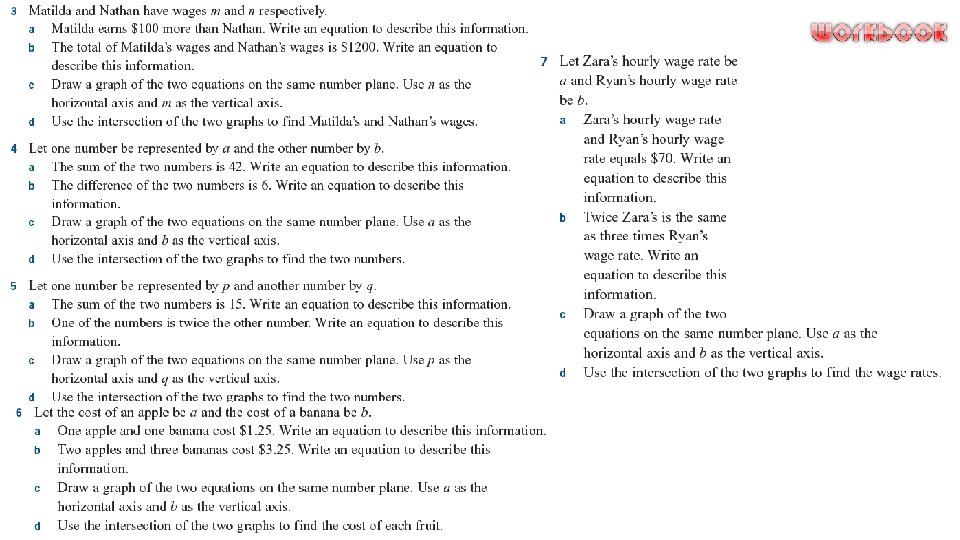
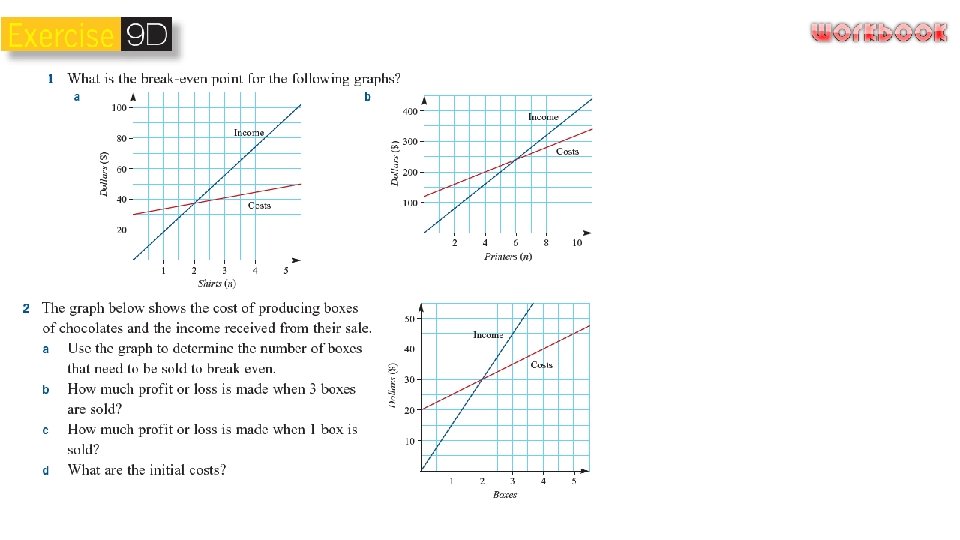
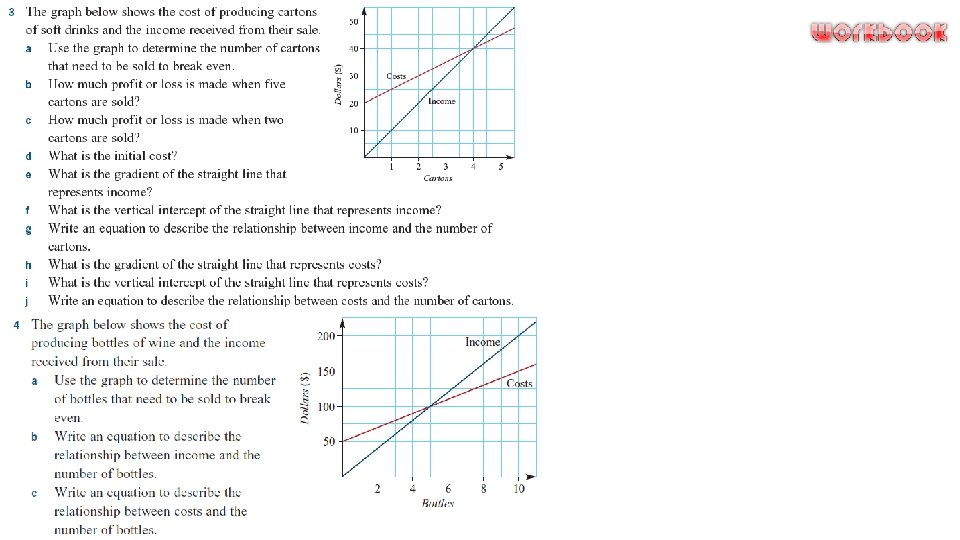
Intersecting Graphs The point at which two straight lines intersect can be found by sketching the two graphs on the one set of axes and reading off the coordinates of the point of intersection. Finding the point of intersection is said to be ‘solving the equations simultaneously’. The point of intersection can have different meanings in practical applications. For example, when income is graphed against costs, the point of intersection is called the ‘break-even’ point.

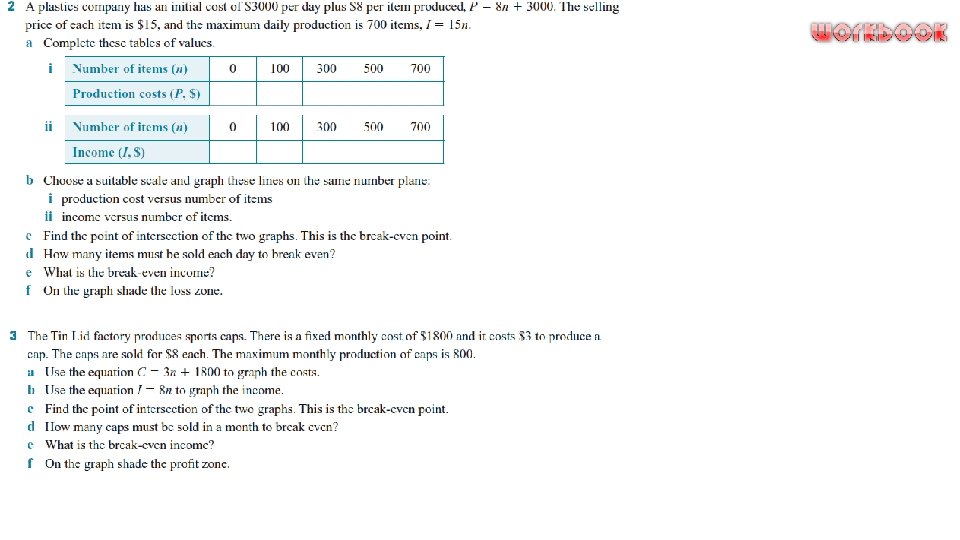
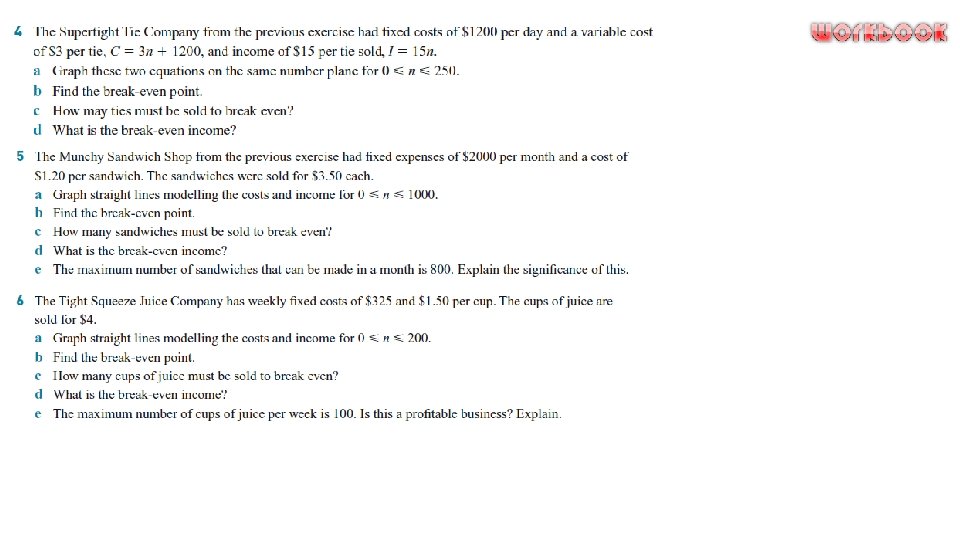
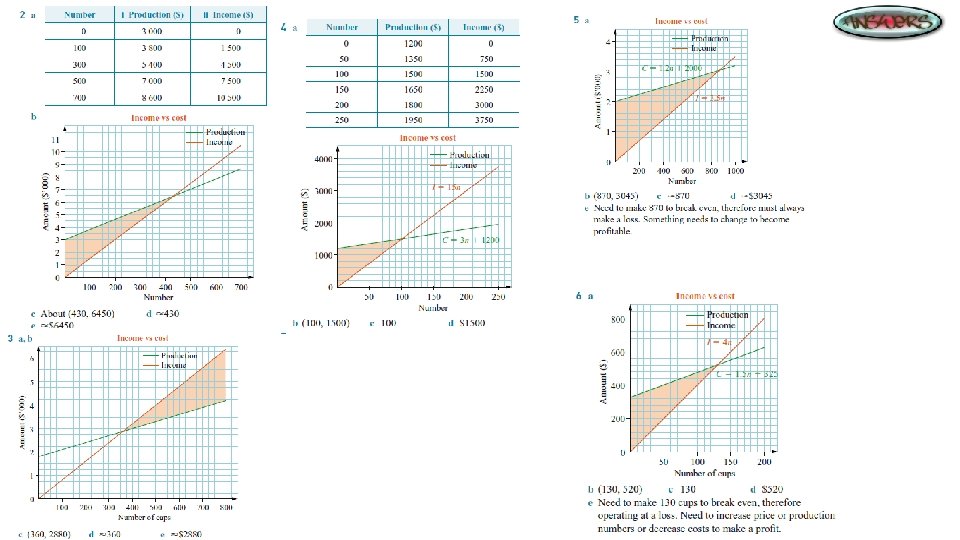
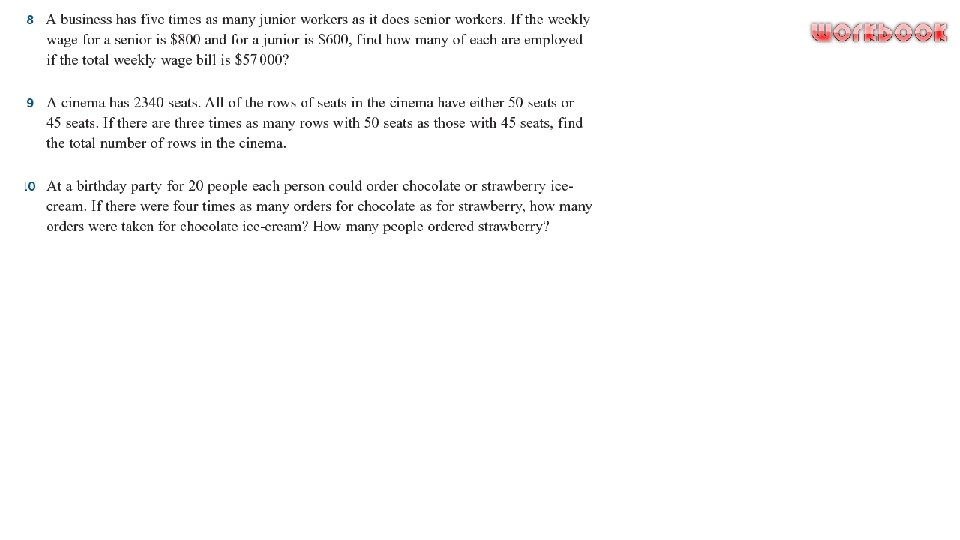
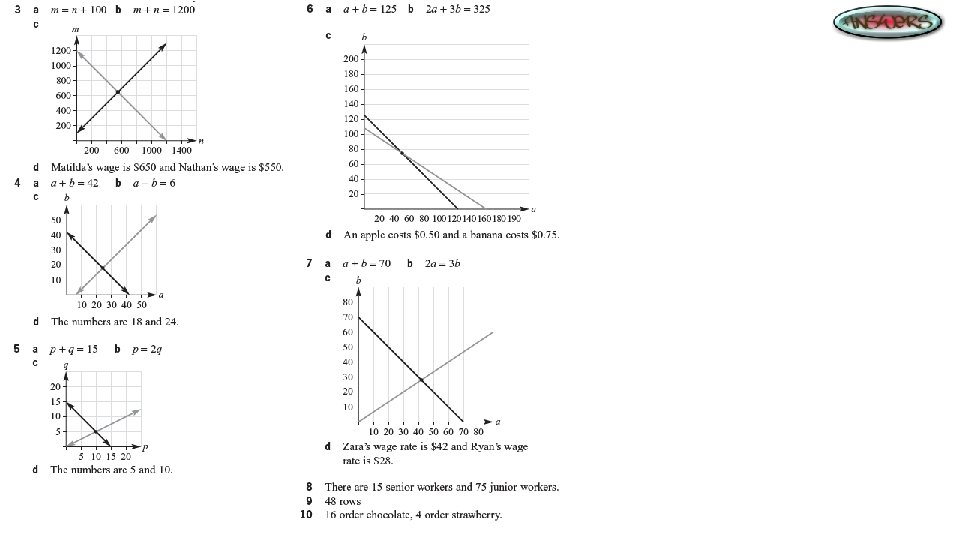
Practical Applications:


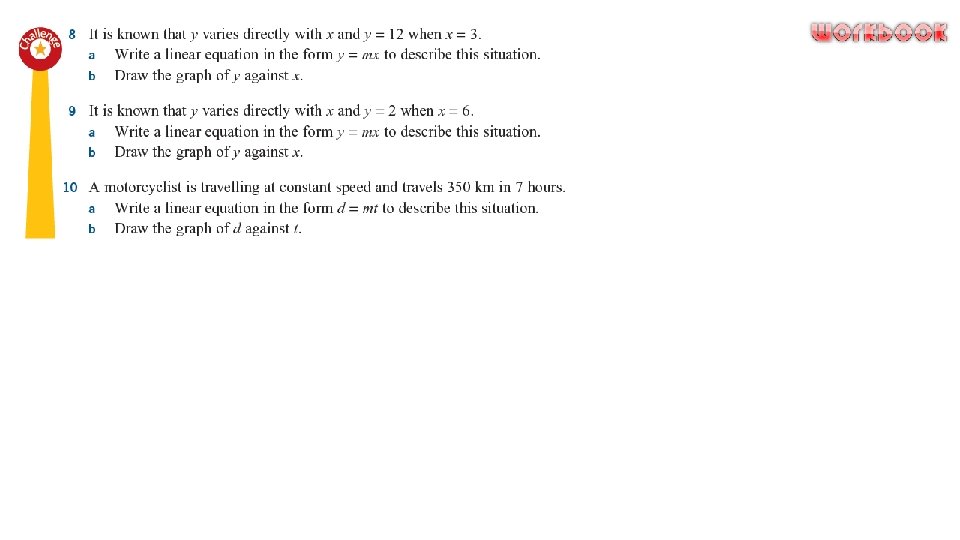
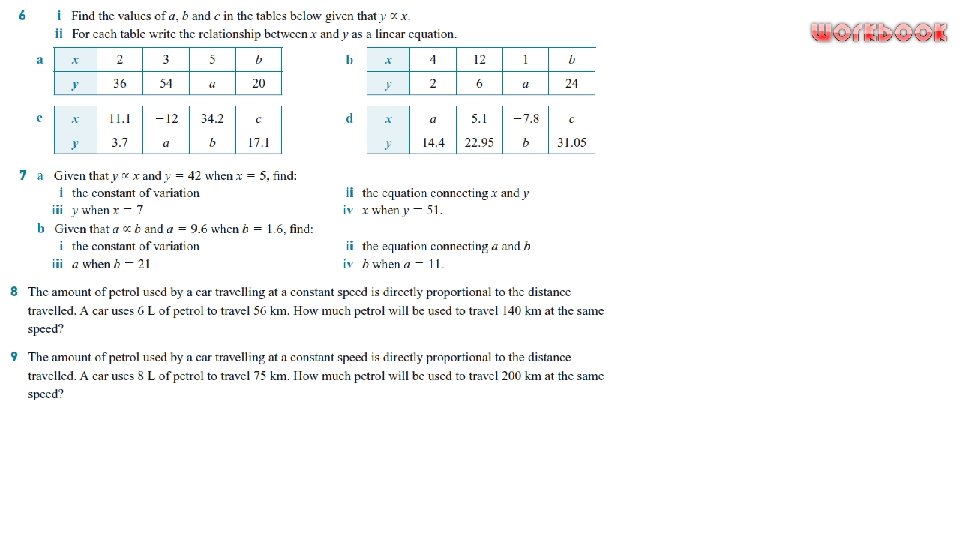
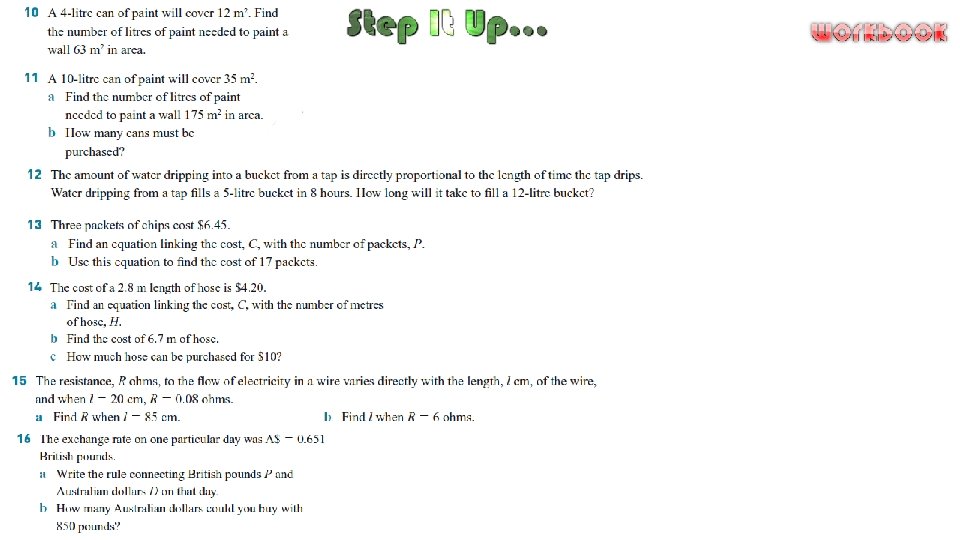
Linear variation When there is a direct relationship between two quantities or variables, one of the quantities can be expressed as a constant multiplied by the other quantity. If two quantities are directly proportional, then an increase (or a decrease) in one causes a proportional increase (or decrease) in the other. relationship here is y = 5 x Quantities such as time, distance, cost and length change depending on the situation. These are called variables.
- Slides: 37