Alternative Energy Nuclear Power FYF 101 Section J


 •")


 Nuclear Plant would have the same effect as: Land: Disturbed Land")

 due to various risks in the U. S. ACTIVITY")
 • Stored at reactor site: 162, 000 units;")


- Slides: 36
Alternative Energy: Nuclear Power FYF 101 Section J October 26, 2007
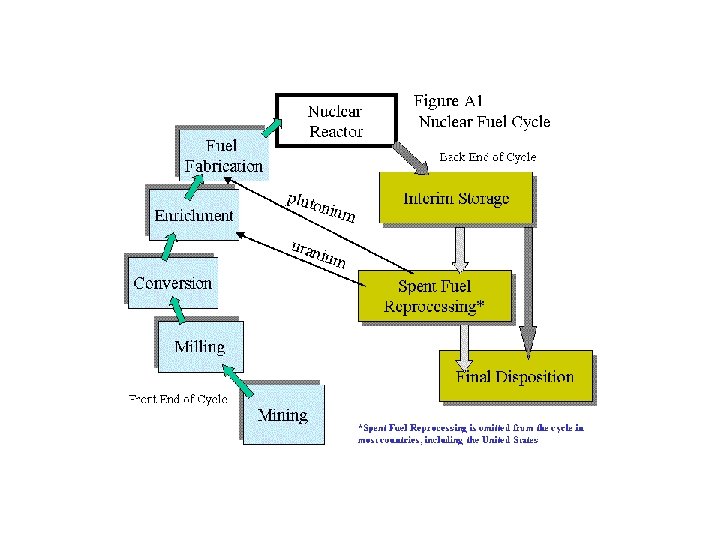
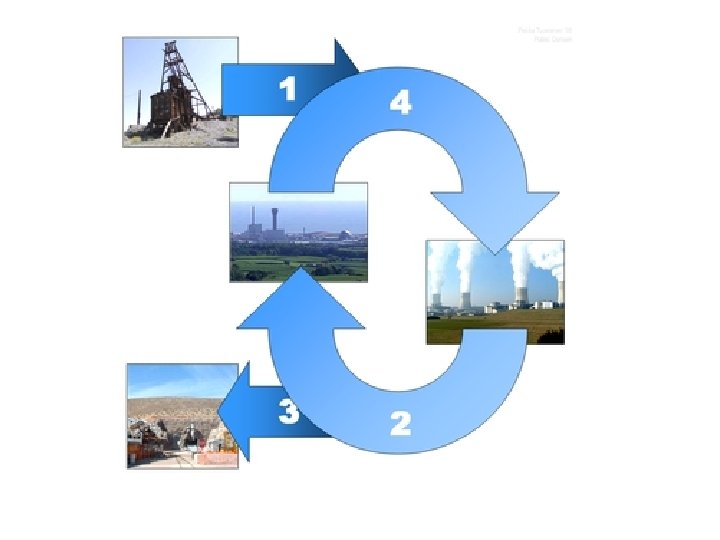
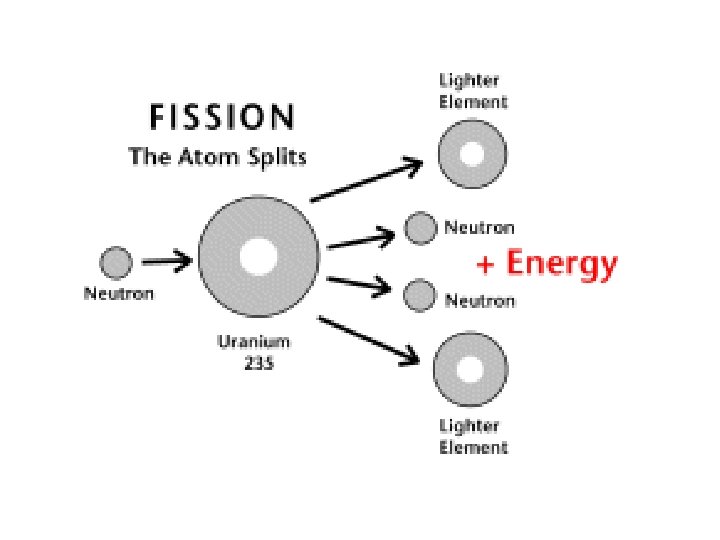
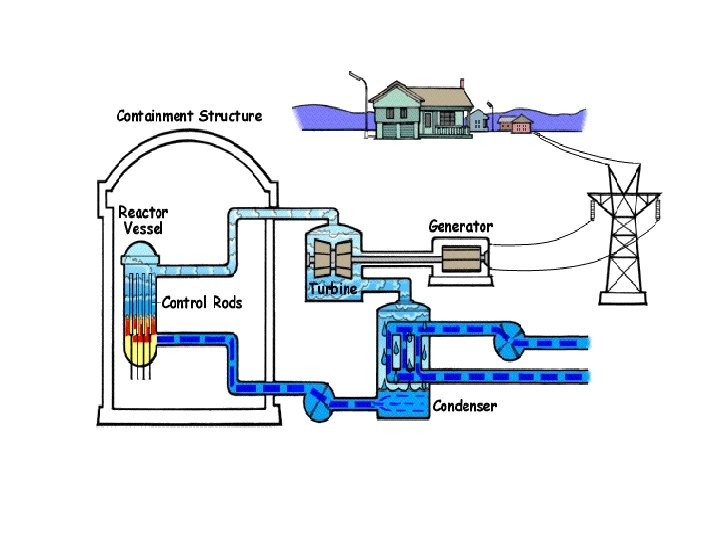
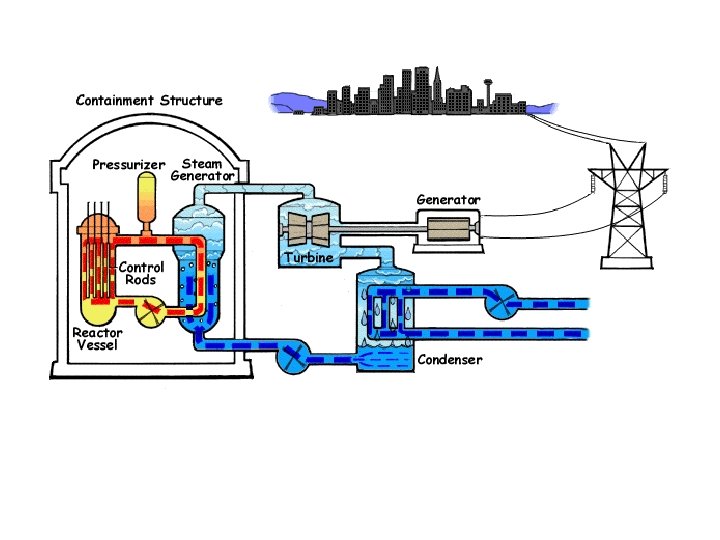
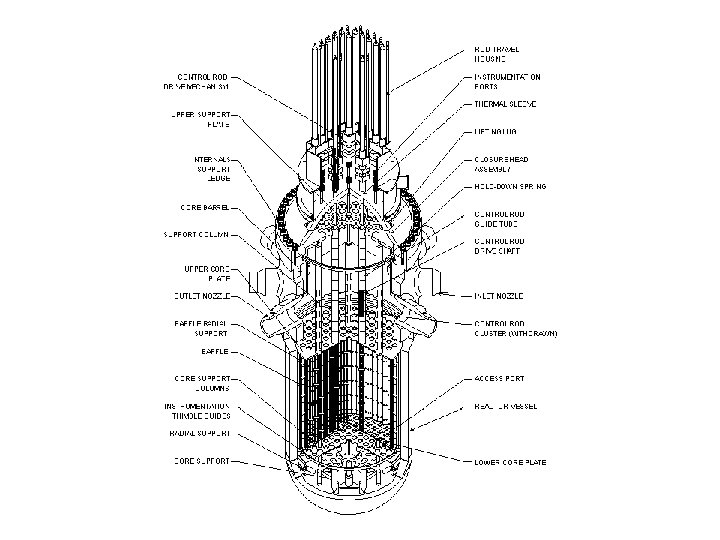
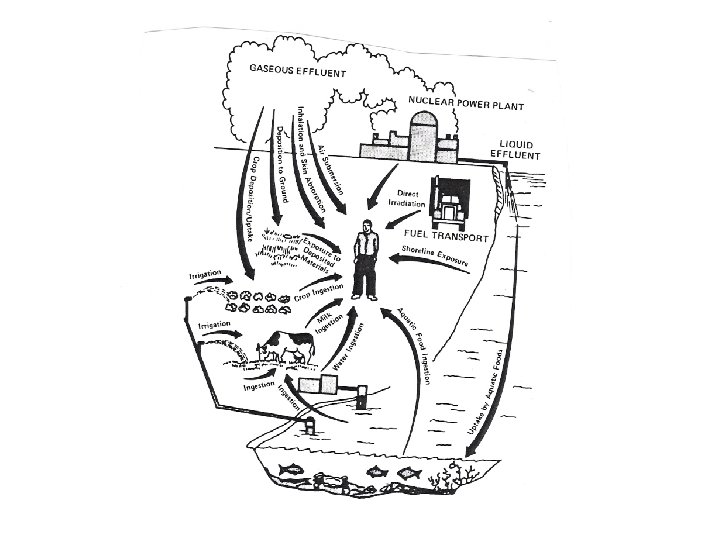
Learning Objectives Participants should be able to describe: • • Nuclear power use worldwide & in the U. S. The nuclear fuel cycle The potential advantages of nuclear power The risks associated with nuclear power
Source of Electrical Production in the U. S. Coal 55% Nuclear 22% Hydroelectric 10% Gas 10% Petroleum 2% Other <1%
Energy Facts • Production of energy accounts for 36% of the energy we use. • Fossil fuel produces 85% of the energy used. • Burning of fossil fuel produces 3. 7 tons for each ton burned.
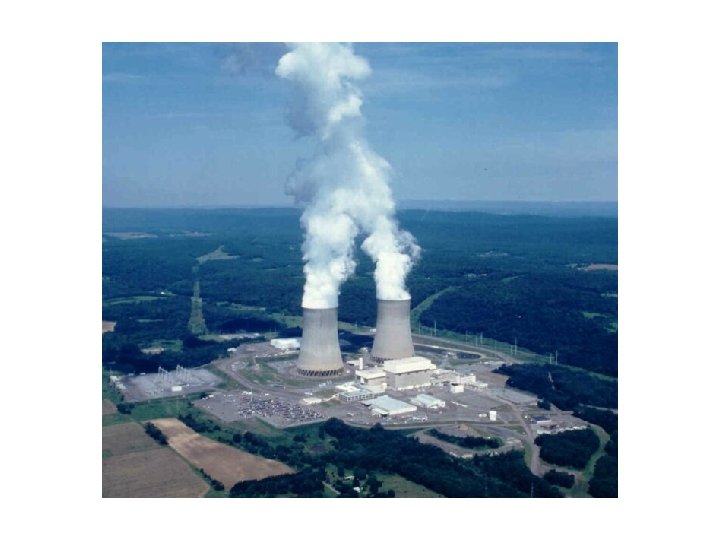
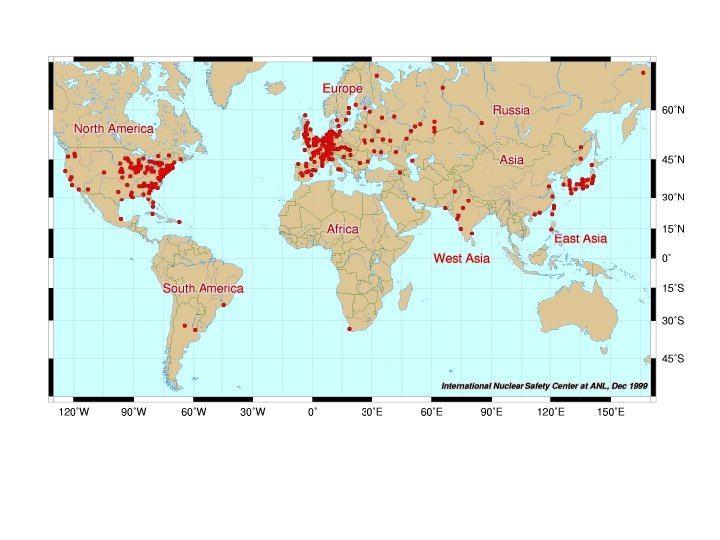
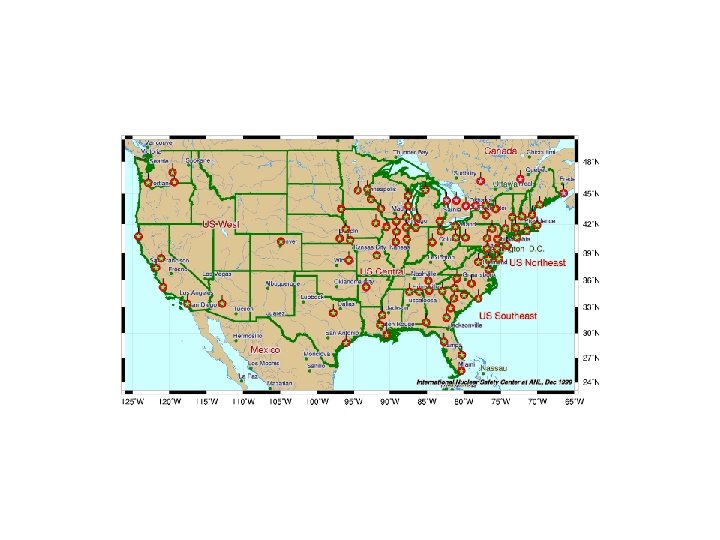
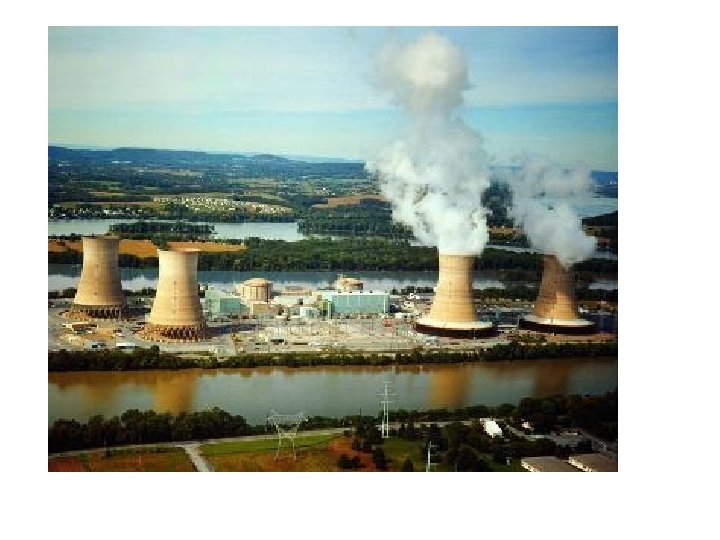
Nuclear Power Plants • Worldwide: 443 reactors in 32 countries (<25 under construction) • United States: 103 reactors in 31 states (no new construction since 1974) Pa has the 2 nd largest capacity Illinois is 1 st.
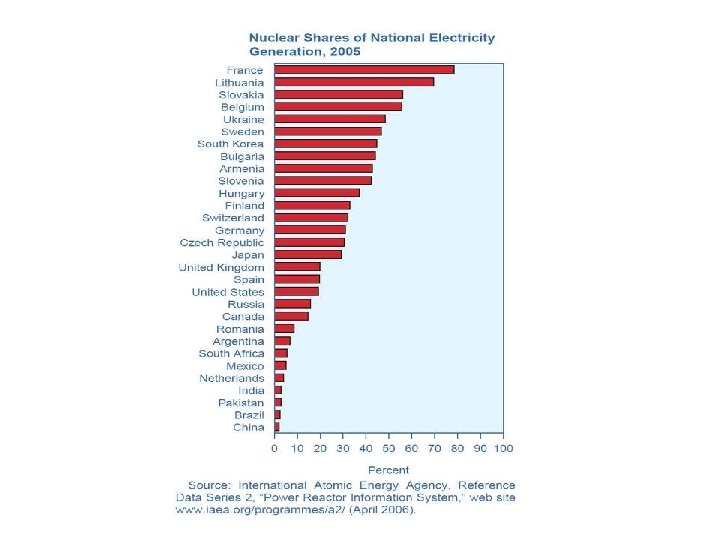
France % of national power 75% % of worldwide power 16% Sweden 46% Ukraine 43% 5% South Korea 39% 4% Germany 30% 7% Japan 30% 13% United States 22% 31%
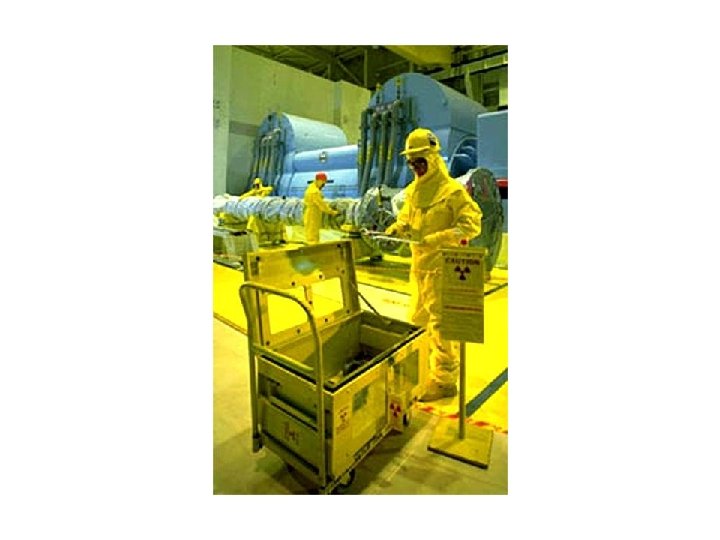
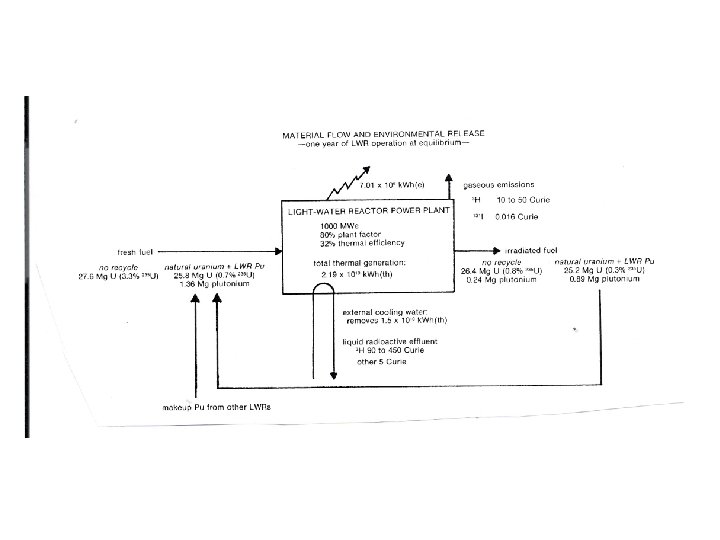
Risks • Effluents • Waste • Accidents
A 1000 MW(e) Nuclear Plant would have the same effect as: Land: Disturbed Land 100 MW (e) coal Land: Overburden moved 95 MW(e) coal Fossil fuel used: 45 MW(e) coal Effluents: SOx, NOx, Hydrocarbons, CO 45 MW (e) coal
Eventual # of deaths caused by the wastes from 1000 MWe-Y electrical power generation Nuclear High level wastes 0. 018 Low level wastes 0. 0004 Routine emissions 0. 3 Coal Air pollution 75 Radon emission 30 Chemical cacrcinogens 70
Loss of life expectancy (LLE) due to various risks in the U. S. ACTIVITY LLE (Days) Living in poverty 3500 Smoking 2300 Unmarried 2000 Coal Miner 1100 30 lbs overweight 900 Small car vs. midsize 60 Living very near a NPP 0. 4
Spent nuclear fuel (total since 1970’s) • Stored at reactor site: 162, 000 units; 46, 218 tons • Stored at away from reactor storage: 4, 000 units; 755 tons
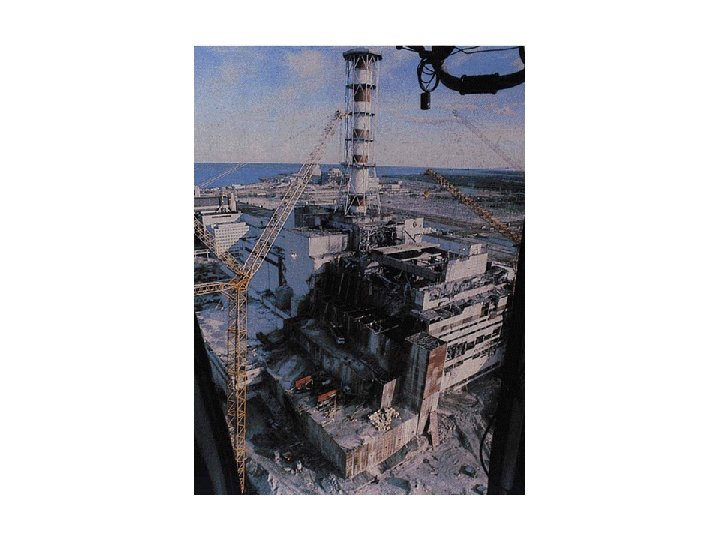
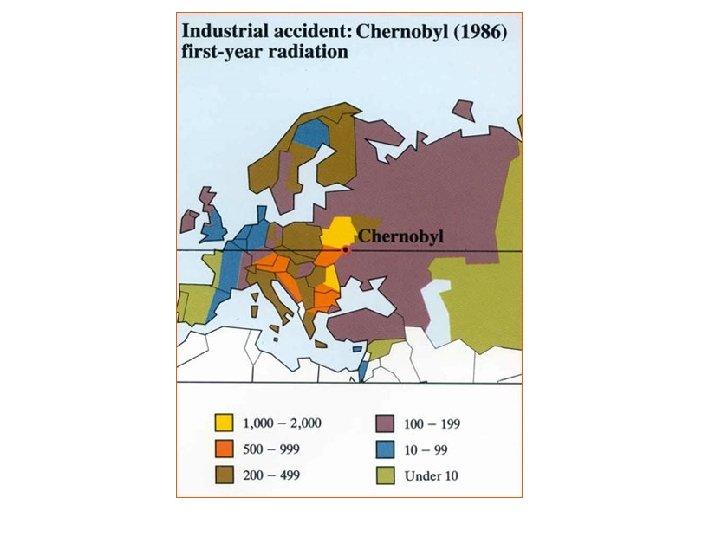
Chernobyl • Acute radiation sickness affected 134 employees; 28 died • Thyroid cancer: 70 cases • Potential 1000’s