Alteration of diploid and haploid phases Mitosis Meiosis


- Slides: 20
Alteration of diploid and haploid phases
Mitosis
Meiosis
Crossing over and recombination
Crossing over and recombination • Crossing over – exchange of parts of homologous chromosomes by a breakage and reunion process • Recombination – no parental arrangement of alleles in progeny – in result of crossing over – in result of assortment of independent alleles
Frequency of crossing over
Double crossing over ordinary crossing over double crossing over
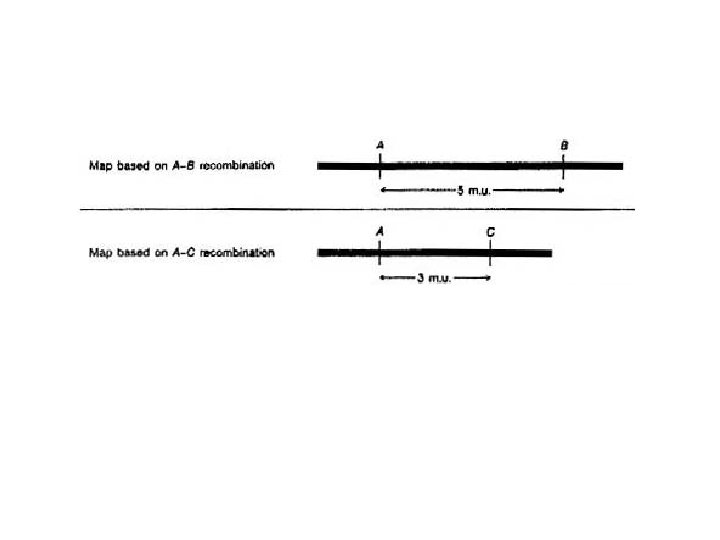
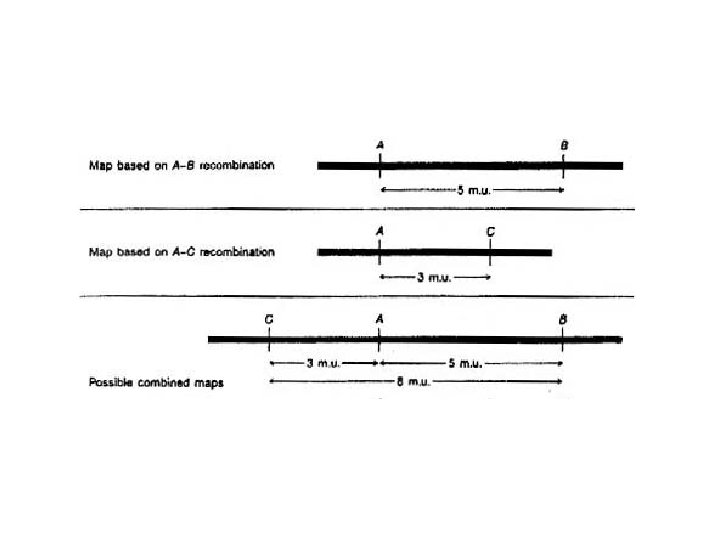
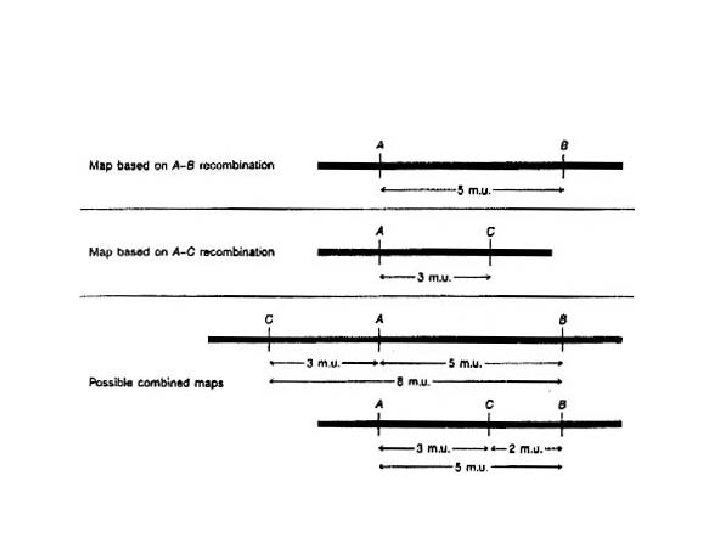
Genetic distance Measure of genetic distance is the recombination frequency among two loci. In result of multiple crossing over distances between loci are not additive: if loci sequence ABC, then r. AC < r. AB + r. BC Frequency of the double crossing over among loci A and C – r. AB x r. BC Max of possible recombination frequency among two loci – 50 %
Unit of recombination Frequency of recombination – percent of recombinant gametes (percent of meiosis where recombination happened) 1 c. M (centimorgan) = 1 % recombinant gametes
Test crossing Crossing with homozygote by recessive alleles of genes of question P 1 AABB, P 2 aabb F 1 Aa. Bb Gametes in F 1 AB ab Ab a. B Crossing with aabb (all gametes ab) Phenotypes after test crossing Aa. Bb aabb Aabb aa. Bb
Recombination in F 2 P 1 AABB P 2 aabb AB ab Genotypes F 1 Gametes F 1 AB ab Ab a. B Genotypes. F 2 AB AB ab ab Ab Ab a. B AB ab ab Ab a. B Phenotypes F 2 A-B- aabb A-B- A-bb aa. B- A-bb A-B- aa. B-
Genetic map – a schema which shows linear gene location on a chromosome and genetic distance among them. Distance among distant genes is found by summing distances among corresponding close located genes or is calculated theoretically. Not a formal limit of genetic distance between genes at the same chromosome on genetic map! Genes located on the same chromosome form a linkage group.
First genetic map
Genetic map of Drosophila
Genetic map of human
Genetic map of human
Physical mapping Physical localisation on a chromosome http: //wheat. pw. usda. gov/cgi-bin/graingenes/report. cgi? class=image; name=1 B+physical+vs. +genetic+maps