
ALGEBRA TWO CHAPTER THREE SYSTEMS OF LINEAR EQUATIONS
ALGEBRA TWO CHAPTER THREE: SYSTEMS OF LINEAR EQUATIONS AND INEQUALITIES Section 3. 1 - Solving Linear Systems by Graphing
LEARNING GOALS Goal One - Graph and solve systems of linear equations in two variables. Goal Two - Use linear systems to solve real-life problems.
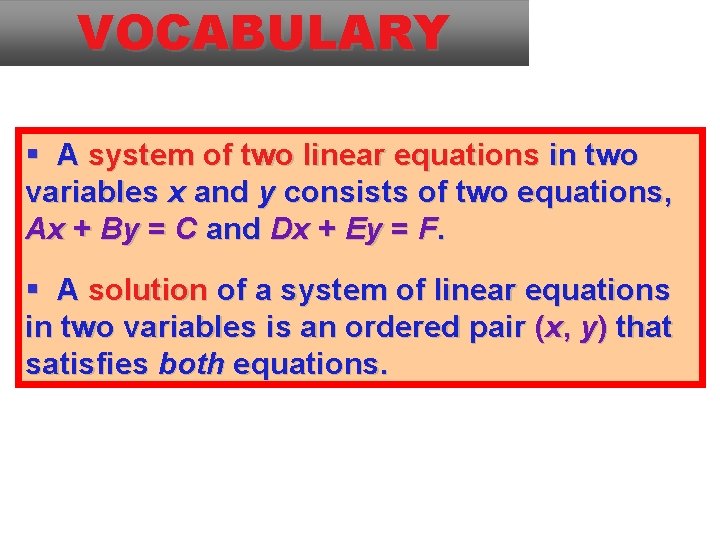
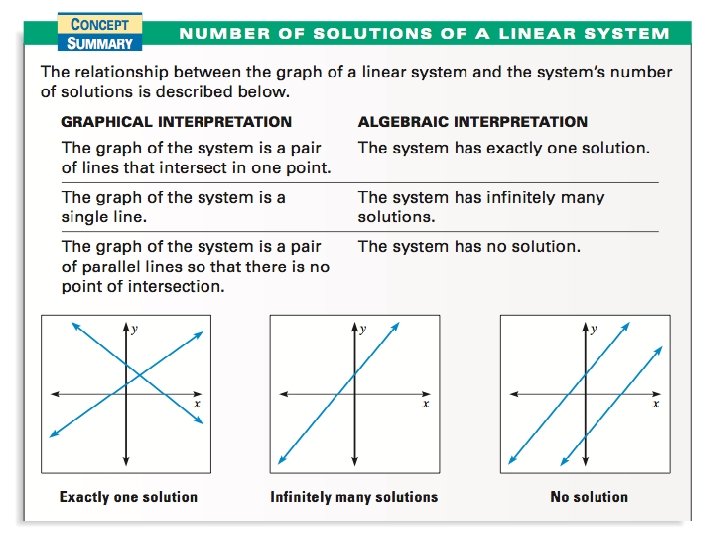
VOCABULARY A system of two linear equations in two variables x and y consists of two equations, Ax + By = C and Dx + Ey = F. A solution of a system of linear equations in two variables is an ordered pair (x, y) that satisfies both equations.
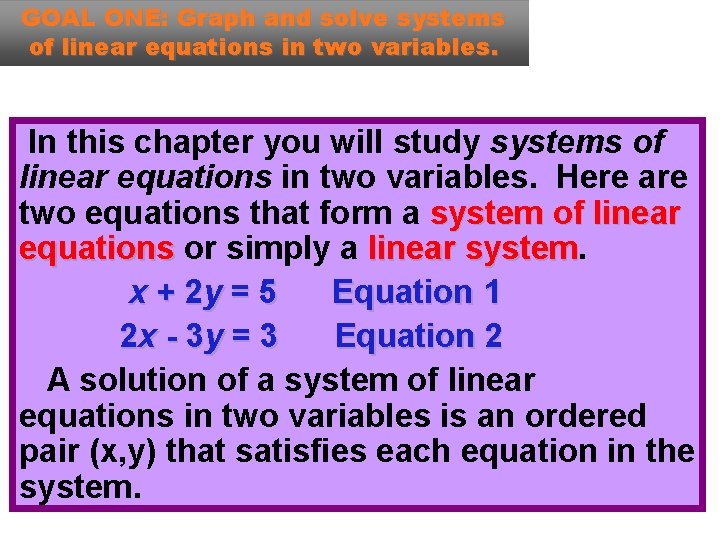
GOAL ONE: Graph and solve systems of linear equations in two variables. In this chapter you will study systems of linear equations in two variables. Here are two equations that form a system of linear equations or simply a linear system x + 2 y = 5 Equation 1 2 x - 3 y = 3 Equation 2 A solution of a system of linear equations in two variables is an ordered pair (x, y) that satisfies each equation in the system.
GOAL ONE: Graph and solve systems of linear equations in two variables. Because the solution of a linear system satisfies each equation in the system, the solution must lie on the graph of both equations. When the solutions has integer values, it is possible to find the solution by graphical methods.
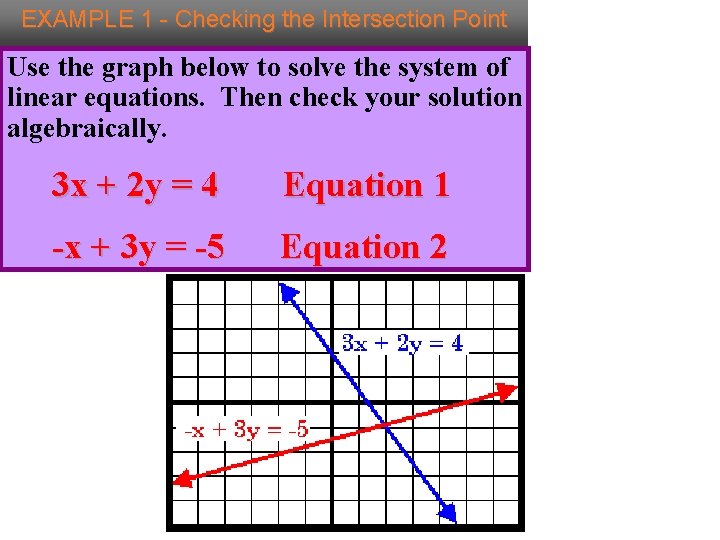
EXAMPLE 1 - Checking the Intersection Point Use the graph below to solve the system of linear equations. Then check your solution algebraically. 3 x + 2 y = 4 Equation 1 -x + 3 y = -5 Equation 2
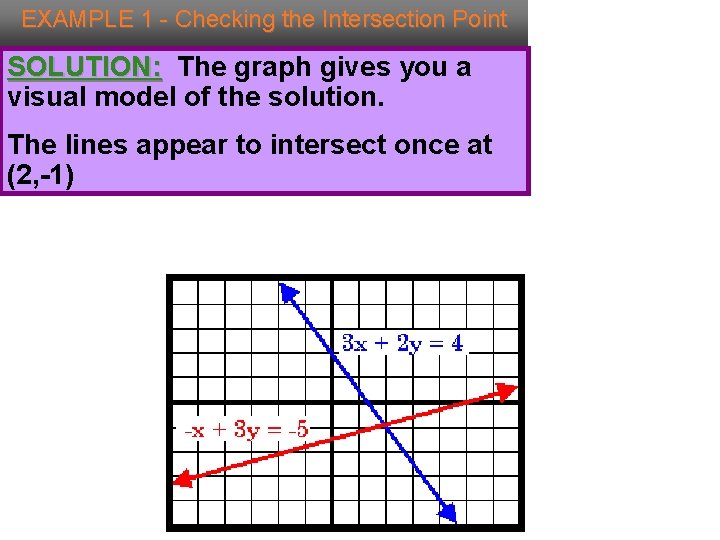
EXAMPLE 1 - Checking the Intersection Point SOLUTION: The graph gives you a visual model of the solution. The lines appear to intersect once at (2, -1)
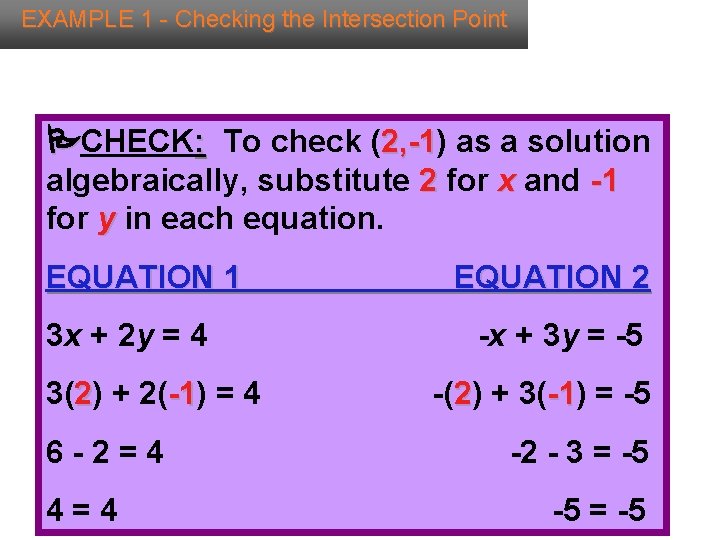
EXAMPLE 1 - Checking the Intersection Point CHECK: To check (2, -1) 2, -1 as a solution algebraically, substitute 2 for x and -1 for y in each equation. EQUATION 1 3 x + 2 y = 4 3(2) + 2(-1) -1 = 4 6 -2=4 4=4 EQUATION 2 -x + 3 y = -5 -(2) + 3(-1) -1 = -5 -2 - 3 = -5 -5 = -5
EXAMPLE 1 - Checking the Intersection Point Because (2, -1) is a solution of each equation, (2, -1) is the solution of the system of linear equations. Because the lines in the graph of this system intersect at only one point, (2, -1) is the only solution of the linear system.
SOLVING A LINEAR SYSTEM USING GRAPH -AND-CHECK To use the graph-and-check method to solve a system of linear equations in two variables, use the following steps. STEP 1: Write each equation in a form that is easy to graph. STEP 2: Graph both equations in the same coordinate plane. STEP 3: Estimate the coordinates of the point of intersection. STEP 4: Check the coordinates algebraically by substituting into each equation or the original linear system.
EXAMPLE - Using the -and-Check Method Graph Solve the linear system graphically. Check the solution algebraically. x + y = -2 Equation 1 2 x - 3 y = -9 Equation 2 SOLUTION: 1. Write each equation in a form that is easy to graph, such as slope-intercept form. 2. Graph these equations.
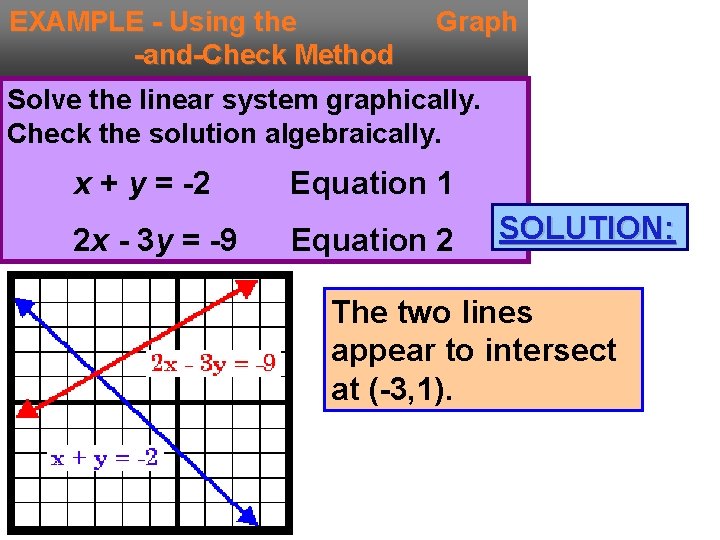
EXAMPLE - Using the -and-Check Method Graph Solve the linear system graphically. Check the solution algebraically. x + y = -2 Equation 1 2 x - 3 y = -9 Equation 2 SOLUTION: The two lines appear to intersect at (-3, 1).
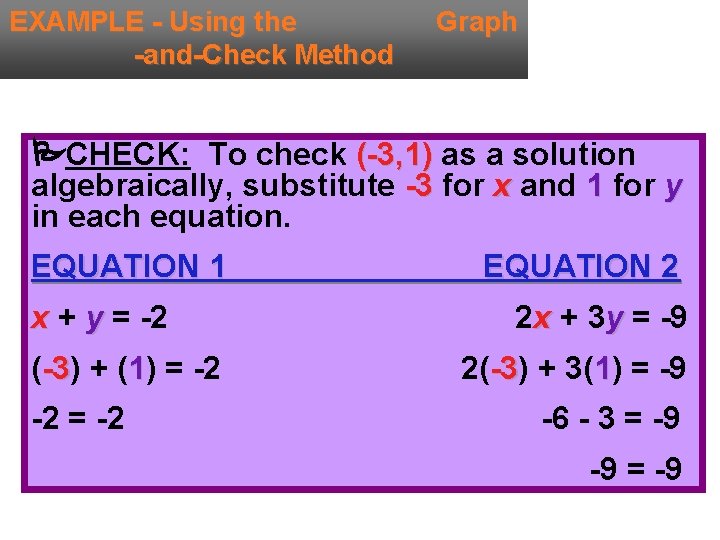
EXAMPLE - Using the -and-Check Method Graph CHECK: To check (-3, 1) as a solution algebraically, substitute -3 for x and 1 for y in each equation. EQUATION 1 x + y = -2 (-3) -3 + (1) = -2 -2 = -2 EQUATION 2 2 x + 3 y = -9 2(-3) -3 + 3(1) = -9 -6 - 3 = -9 -9 = -9
EXAMPLE - Using the Graph-and-Check Method INTERNET In the fall, the math club and the science club each created an Internet site. You are the webmaster for both sites. It is now January and you are comparing the number of times each site is visited each day. Science Club: There are currently 400 daily visits and the visits are increasing at a rate of 25 visits per month. Math Club: There are currently 200 daily visits and the visits are increasing at a rate of 50 daily visits per month. Predict when the number of visits at the two sites will be the same.
EXAMPLE - Using the Graph-and-Check Method INTERNET In the fall, the math club and the science club each created an Internet site. You are the webmaster for both sites. It is now January and you are comparing the number of times each site is visited each day. Science Club: There are currently 400 daily visits and the visits are increasing at a rate of 25 visits per month. Math Club: There are currently 200 daily visits and the visits are increasing at a rate of 50 daily visits per month. Predict when the number of visits at the two sites will be the same.
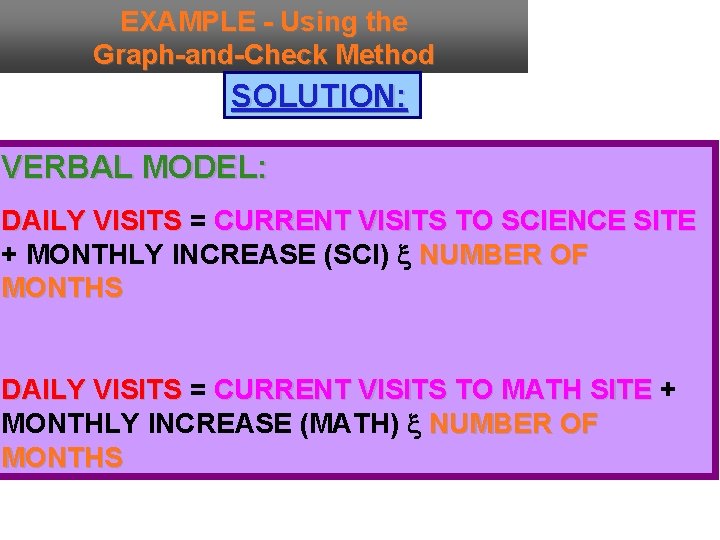
EXAMPLE - Using the Graph-and-Check Method SOLUTION: VERBAL MODEL: DAILY VISITS = CURRENT VISITS TO SCIENCE SITE + MONTHLY INCREASE (SCI) x NUMBER OF MONTHS DAILY VISITS = CURRENT VISITS TO MATH SITE + MONTHLY INCREASE (MATH) x NUMBER OF MONTHS
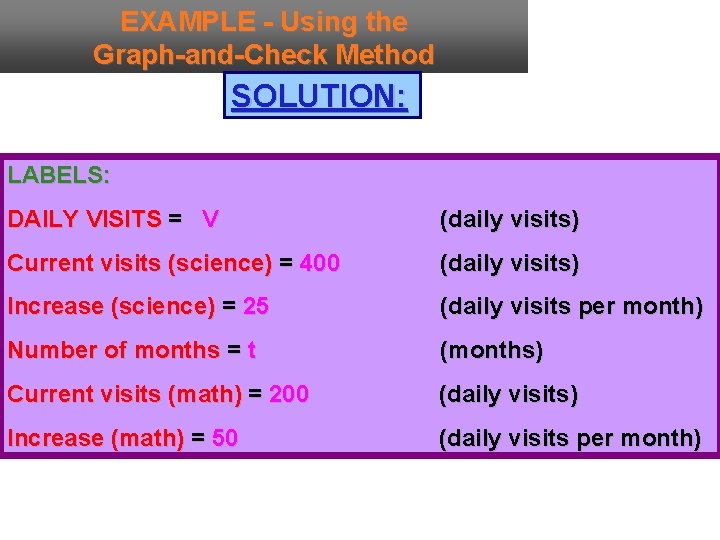
EXAMPLE - Using the Graph-and-Check Method SOLUTION: LABELS: DAILY VISITS = V (daily visits) Current visits (science) = 400 (daily visits) Increase (science) = 25 (daily visits per month) Number of months = t (months) Current visits (math) = 200 (daily visits) Increase (math) = 50 (daily visits per month)
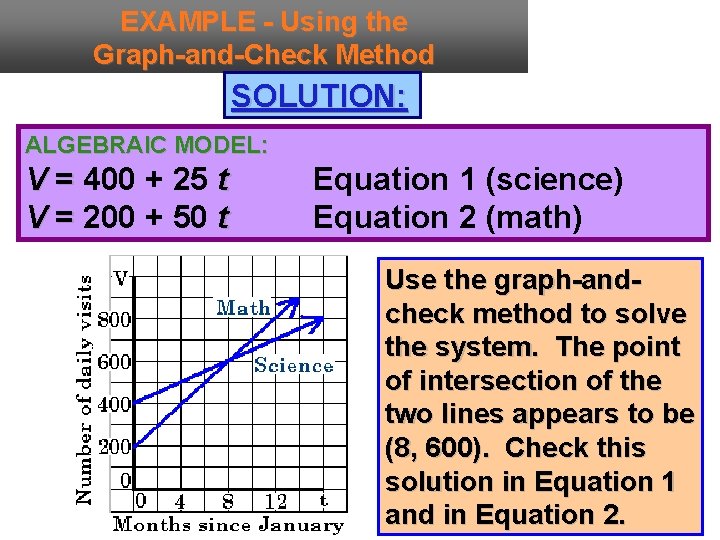
EXAMPLE - Using the Graph-and-Check Method SOLUTION: ALGEBRAIC MODEL: V = 400 + 25 t V = 200 + 50 t Equation 1 (science) Equation 2 (math) Use the graph-andcheck method to solve the system. The point of intersection of the two lines appears to be (8, 600). Check this solution in Equation 1 and in Equation 2.
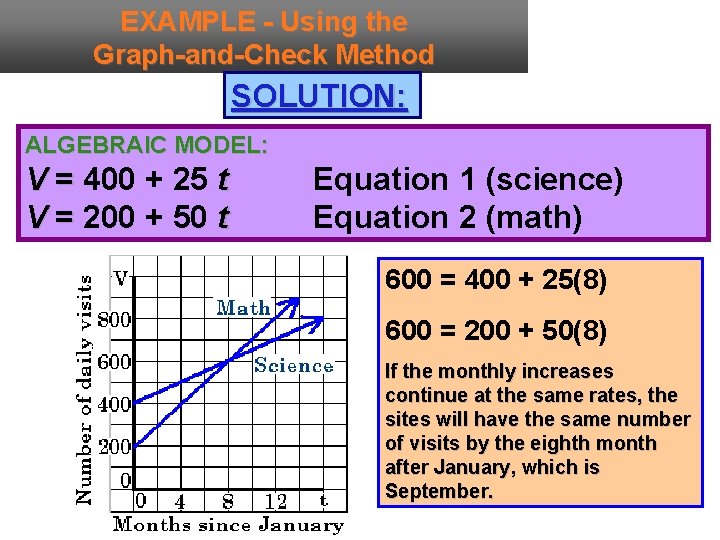
EXAMPLE - Using the Graph-and-Check Method SOLUTION: ALGEBRAIC MODEL: V = 400 + 25 t V = 200 + 50 t Equation 1 (science) Equation 2 (math) 600 = 400 + 25(8) 600 = 200 + 50(8) If the monthly increases continue at the same rates, the sites will have the same number of visits by the eighth month after January, which is September.
ASSIGNMENT READ & STUDY: pg. 139 -141. WRITE: pg. 142 -145. #11, #15, #19, #21, #25, #29, #33, #41, #45, #55
- Slides: 21