Algebra 1 Topic 3 Table of Contents Recommended

Algebra 1 Topic 3

Table of Contents • Recommended Instructional Design and Planning Continuum ……. Slide 3 • Vocabulary …………………………… Slides 4 – 22 • Pre-Requisite Practice Items ……………………… Slides 23 – 41 • Reporting Category Practice Items ………………… Slides 42 – 78
.")
RECOMMENDED INSTRUCTIONAL DESIGN AND PLANNING CONTINUUM Before Prior to the lesson: Outline content standard(s). Determine learning targets. Anticipate student understanding and misconceptions. Determine prerequisite skills. Plan for learning experiences that target Rigor o Conceptual Understanding o Procedural Fluency o Application Determine the task students will demonstrate to reach the desired learning targets. Plan instructional delivery methods that will maximize initial engagement and sustain it throughout the lesson. Decide how students will reflect upon, selfassess, and set goals for their future learning. During the lesson: Activate (or supply) prior knowledge and/or spiral back o Warm ups, Bell Ringers, Openers, etc. Tailor lesson experiences to the different needs and ability of the learners. Clarify vocabulary and mathematical notation. Incorporate a variety of higher order questions to encourage and increase critical thinking skills. Continuously check for student understanding and provide feedback. Provide opportunities for students to develop self-assessment and to reflect about their understanding and work. Bring closure to the lesson so that the students can articulate what they have learned. After the lesson: Analyze evidence of student learning to develop intervention, enrichment, and future instruction. Discuss results of assessments with students. Engage students in reflective processes and goal setting. Engage in self-reflection to adapt/modify teaching strategies to improve instruction.

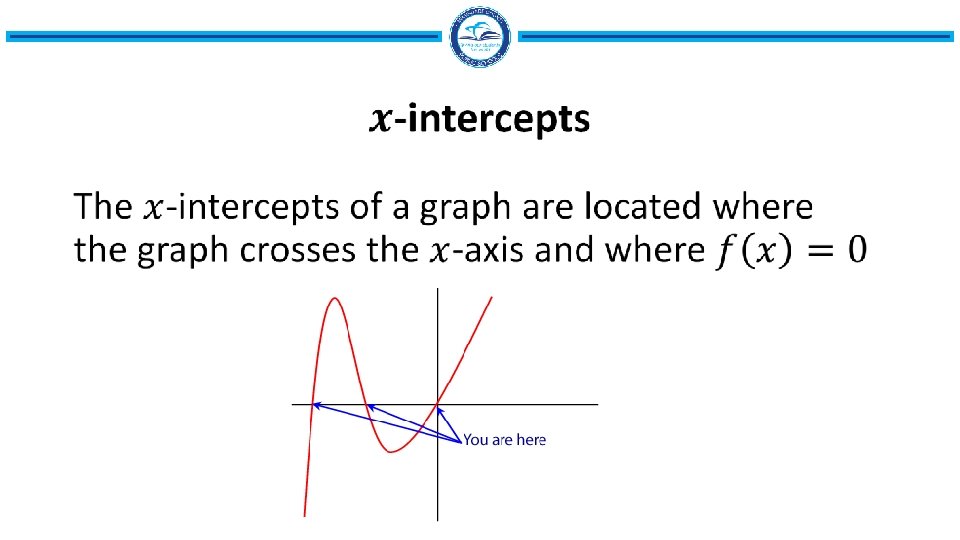
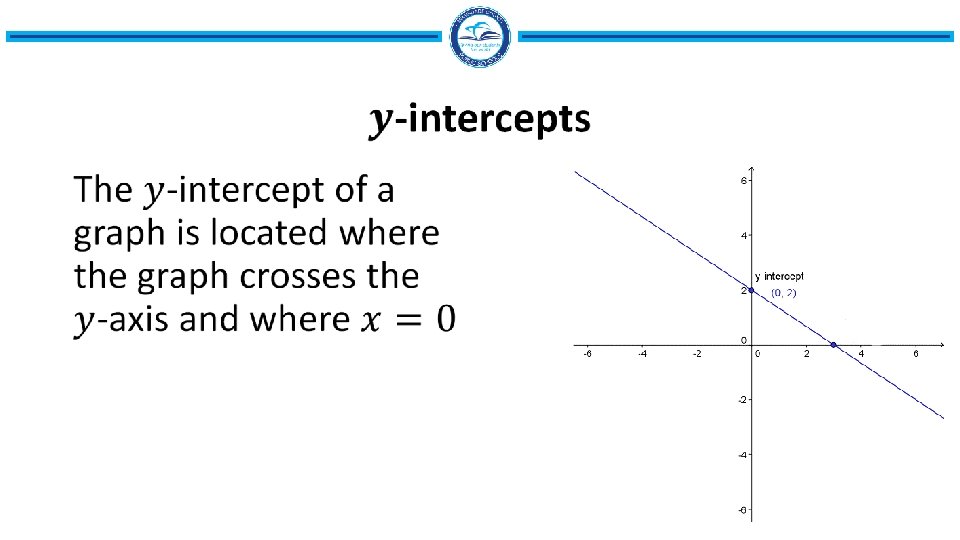
Vocabulary

Mathematically Speaking! Choose 3 -4 vocabulary words for the day. Throughout the lesson, as students respond to your questions or are presenting a problem on the board, mark a tally when a vocabulary word is used accurately. This can be turned into a competition among groups or between periods. Examples of accuracy • translation vs slide • variable vs letter • addition property of equality vs adding on both sides

Parent Function

Transformations of Parent Functions Translations

Transformations of Parent Functions Reflections

Transformations of Parent Functions Dilations

Transformational Graphing Linear Functions – Vertical Translation

Transformational Graphing Linear Functions – Vertical Dilation

Transformational Graphing Linear Functions – Vertical Dilation

Rate of Change A ratio that compares the amount of change in the dependent variable to the amount of change in the independent variable.

Slope • The slope indicates the steepness of a line.

Slope Formula •

Slopes of Lines

Perpendicular Lines that intersect to form a right angle Perpendicular lines (not parallel to either of the axes) have slopes whose product is -1.

Parallel Lines in the same plane that do not intersect Parallel lines have the same slopes.

Linear Function •

Coordinate Plane

Pre-Requisite Practice Items

Pre-Requisites MAFS. 8. F. 1. 3 Explaining Linear Functions Describe as many defining properties of linear functions as you can. List only properties that are unique to linear functions.

Pre-Requisites MAFS. 8. F. 1. 3 Linear or Nonlinear?

Pre-Requisites MAFS. 8. F. 1. 3 Nonlinear Functions Give an example of a nonlinear function. You can describe this function in one or more of the following ways: with a table, graph, or equation. Be sure to specify what are the inputs (the independent variable) and what are the outputs (the dependent variable). Then explain how you know your example is nonlinear.

Pre-Requisites MAFS. 8. F. 1. 3 What Am I?

Pre-Requisites MAFS. 8. F. 1. 3 Introduction to Linear Functions 3. Graph both functions and list as many differences between the two functions as you can.

Pre-Requisites MAFS. 8. F. 2. 4 Construction Function A construction supply store sells steel bars for a certain price per kilogram. No matter how much steel is ordered, the company adds on the same delivery charge. The cost for an order of 100 kilograms of steel bars is $230. The cost for an order of 150 kilograms of steel bars is $320. Write an equation for the cost of an order of steel bars (y) in terms of the weight of steel bars ordered (x). Show or explain how you found your equation.

Pre-Requisites MAFS. 8. F. 2. 4 Drain the Pool Mr. Elliot needs to drain his above ground pool before the winter. The graph below represents the relationship between the number of gallons of water remaining in the pool and the number of hours that the pool has drained. Pool Water (in gallons) Level 1. Determine the rate of change for this relationship and explain what it means in this situation. 2. Determine the initial value for this relationship and explain what it means in this situation. Time (in hours)

Pre-Requisites MAFS. 8. F. 2. 4 Profitable Functions Victoria owns a store that sells board games. She made the following graph to relate the number of board games she sells to her overall profits. Write an equation to describe this relation. Explain how you found your equation. Profits (in dollars) Board Game Profits Board Games Sold

Pre-Requisites MAFS. 8. F. 2. 4 Smart TV Brent wants to buy a 60” LED Smart TV, so he opened a savings account and added money to it every month. The chart below shows the relationship between the number of months Brent has been saving and the total amount of money in his account. Savings Account Number of Months 1 4 6 9 12 Total Savings $160 $415 $585 $840 $1, 095 1. Determine the rate of change for this relationship and explain what it means in terms of Brent’s savings account. 2. Determine the initial value for this relationship and explain what it means in terms of Brent’s savings account.

Pre-Requisites MAFS. 8. F. 2. 4 Trekking Functions Taro and Jiro climbed a mountain and hiked back down. At the summit and at every station along the way back down, they recorded their altitude and the amount of time they had been travelling. Hiking Data Time Travelled (in minutes) Altitude (in meters) 0 3776 3600 126 3020 2700 231 2390 Write an equation that models Taro’s and Jiro’s altitude in terms of the amount of time they had travelled. Explain how you found your equation.

Pre-Requisites MAFS. 8. F. 1. 3 Downhill

Pre-Requisites MAFS. 8. F. 1. 3 Video Streaming You work for a video streaming company that has two monthly plans to choose from: • Plan 1: A flat rate of $7 per month plus $2. 50 per video viewed • Plan 2: $4 per video viewed a. What type of functions model this situation? Explain how you know. b. Define variables that make sense in the context, and then write an equation with cost as a function of videos viewed, representing each monthly plan. c. How much would 3 videos in a month cost for each plan? 5 videos? d. Compare the two plans and explain what advice you would give to a customer trying to decide which plan is best for them, based on their viewing habits.

Pre-Requisites MAFS. 8. F. 1. 3 Chicken and Steak, Variation 1 You have $100 to spend on a barbeque where you want to serve chicken and steak. Chicken costs $1. 29 per pound and steak costs $3. 49 per pound. a. Find a function that relates the amount of chicken and the amount of steak you can buy. b. Graph the function. What is the meaning of each intercept in this context? What is the meaning of the slope in this context? Use this (and any other information represented by the equation or graph) to discuss what your options are for the amounts of chicken and amount of steak you can buy for the barbeque.

Pre-Requisites MAFS. 8. F. 1. 3 Chicken and Steak, Variation 2 Consider the relationship between the number of pounds of chicken and the number of pounds of steak that can be purchased for a barbecue on a fixed budget. a. Write an equation for this relationship given that chicken costs $1. 29 per pound, steak costs $3. 49 per pound, and the total allotment for both is $100. b. Sketch a graph for the equation. Describe how the amount of steak that can be purchased depends on the amount of chicken purchased. What is the significance of the graph’s x - and y -intercepts? c. Re-write the equation to show the amount of steak purchased in terms of the amount of chicken purchased. Use this equation to describe how the amount of steak purchased changes with each pound of chicken purchased. d. Both the equation and the graph can be used to find amounts of chicken and steak that can be purchased for the barbecue on a fixed budget of $100. Explain how important features of the graph can be seen or found with the equation and describe what they say about the relationship between chicken and steak purchases.

Pre-Requisites MAFS. 8. F. 1. 3 Baseball Cards
 1.")
Pre-Requisites MAFS. 8. EE. 2. 5 Compare Slopes Price of Pail (in dollars) 1. Suppose Jack graphed his equation. Identify the slope of his graph and explain what it means. 2. Identify the slope of Jill’s graph and explain what it means. 3. How do the slopes of the graphs compare? Explain. Volume of Pail (in gallons)

Pre-Requisites MAFS. 8. EE. 2. 5 Interpreting Slope Rodnika has a saltwater fish tank. She knows the water in the tank must have the right amount of salt in order for the fish to survive. To get the proper salinity, Rodnika mixes the water and salt according to the measurements shown in the table. Sea Salt (in cups) Saltwater Mixture 1. Graph the line that represents the relationship shown in the table. 2. What is the slope of the line? 3. What does the slope mean in this situation? Distilled Water (in gallons)

Pre-Requisites MAFS. 8. EE. 2. 5 Proportional Paint Antwan is painting all the rooms in his house this year. Below is a graph representing the relationship between quantity of paint and the area covered by the paint. Paint Coverage Area (in square feet) 1. Determine a unit rate for this relationship and describe it in words. 2. Determine the slope of the graph and describe it in words. 3. How are the unit rate and the slope related? Explain. Paint (in gallons)

Reporting Category Practice Items Topic 3

MAFS. 912. F-BF. 1. 1, F-IF. 3. 7, F-IF. 2. 4 Rudolf decides to make and sell necklaces to earn money to buy a new computer. He plans to charge $4. 75 per necklace.

MAFS. 912. F-IF. 2. 6 q 9 a. m. to 11 a. m. q 11 a. m. to 12 noon q 12: 30 p. m. to 1: 30 p. m. q 2 p. m. to 4 p. m. q 1: 30 p. m. to 3. 30 p. m.

MAFS. 912. F-LE. 1. 1 0 2 0 12 0 2 37 25 3 5 20 42 4 16 19 7

MAFS. 912. F-LE. 1. 1 In which of the following situations does Alex’s hourly wage change by a constant percent per unit change in year? A. Alex’s starting hourly wage is $14. 50 per hour the first year, and it increases by $1. 50 each year. B. Alex’s starting hourly wage is $13. 00. She receives a $0. 50 per hour raise after one year, a $0. 75 per hour raise after the second year, a $1. 00 per hour raise after the third year, and so on. C. Alex’s hourly wage is $20 per hour in the first year, $22 per hour the second year, $24. 20 per hour the third year, and so on. D. Alex’s starting hourly wage is $15. 00. Her hourly wage is $15. 75 after one year, $17. 00 after two years, $18. 75 after three years, and so on. C

MAFS. 912. F-LE. 1. 1 Which function represents the relationship shown in the table? 0 1 2 3 5 3 1 -1 C

MAFS. 912. A-CED. 1. 2 The cost to fill a car’s tank with gas is a linear function of the capacity of the tank. The costs of a fill-up for three different customers are shown in the table. Write an equation for the function in slope-intercept form. Then, find the cost of a fill-up for a customer with a truck whose tank size is 22 gallons. 11 21. 45 15 28. 25 17 31. 65 B

MAFS. 912. F-BF. 2. 3

MAFS. 912. F-IF. 2. 6, F-IF. 3. 9 Which function has a greater rate of change: the graph, the table, or the situation? Explain your answer. 0 2 4 6 8 5 9 13 17 21 The bus company charges $1. 25 initial fee and $0. 55 for every county your ride the bus. The graph

MAFS. 912. F-BF. 2. 3 A. B. C. D. Function 2’s graph is shifted down 4 units from Function 1’s graph and is reflected. Function 2’s graph is shifted down 4 units from Function 1’s graph and is not reflected. Function 2’s graph is shifted up 4 units from Function 1’s graph and is not reflected. C

MAFS. 912. F-BF. 2. 3 A. Function 2’s graph is less steep than Function 1’s graph and is reflected. B. Function 2’s graph is steeper than Function 1’s graph and is reflected. C. Function 2’s graph is less steep than Function 1’s graph and is not reflected. D. Function 2’s graph is steeper than Function 1’s graph and is not reflected. B

MAFS. 912. F-LE. 1. 1 You are sitting in the passenger seat of your mom’s car while she is getting gas. You look at the gas pump which shows the gallons pumped and the price of the gas at that moment. The table below shows some of the numbers you see. Does the relationship between number of gallons pumped and the total cost of the gas represent a linear function? If you say NO, please explain why not (using data from this problem). If you say YES, please predict the cost of 14 gallons of gas. 4. 5 6 9 10. 5 13. 5 18 27 31. 5 Yes, $42

MAFS. 912. F-LE. 1. 1 Determine whether the tables below represent a linear or nonlinear function. Explain your answer. 1 4 7 10 3 5 7 9 0 9 18 27 1 6 12 20 Linear, rate of change is constant Nonlinear, rate of change is not constant

MAFS. 912. F-IF. 2. 6, F-IF. 3. 9 Which has the greater rate of change, the situation or the equation? Stephanie climbs two steps at a time. Both rates of change are the same. The only difference is that the situation’s rate of change is positive, while the equation’s rate of change is negative.

MAFS. 912. F-LE. 1. 1 A

MAFS. 912. F-LE. 2. 5 D

MAFS. 912. F-BF. 2. 3

MAFS. 912. F-BF. 2. 3 A

MAFS. 912. F-LE. 2. 5 Zeus keeps a record of his i. Tunes account. At the Pi Day celebration, he won a $50 i. Tunes gift card. That night he spent $30. The table below represents his remaining balance over the last four weeks. Week # Remaining Balance (w) (B) 0 $20 2 $14. 84 4 $9. 68 20 is the balance after he spent $30 Average rate Zeus is spending weekly b) How much money was remaining after one week? About 7 weeks

MAFS. 912. F-LE. 1. 1, F-LE. 2. 5 The relationship between the number of tickets sold at a movie theater, �� , and the total profit gained, �� , in dollars is represented in four different ways below. Which of the four representations is most helpful for determining the following information: a) The daily operating cost of theater? I b) The number of tickets that must be sold for theater to gain a profit of $500? III c) The daily break-even point for the movie theater? d) The rate of change in the relationship? II for exact III or IV visual e) The major family of functions (ie. linear, quadratic, exponential, etc. ) to which this relationship belongs? III f) For each of the three representations that you did not choose as most helpful in the previous slide, explain how you would find a) to e). Answers may vary

MAFS. 912. F-LE. 2. 5 During a recent snowstorm in Red Hook, NY, Jaime noted that there were 4 inches of snow on the ground at 3: 00 p. m. , and there were 6 inches of snow on the ground at 7: 00 p. m. If she were to graph these data, what does the slope of the line connecting these two points represent in the context of this problem? The rate of change. How much snow falls on the ground per hour.

MAFS. 912. A-CED. 1. 2 An airplane leaves New York City and heads toward Los Angeles. As it climbs, the plane gradually increases its speed until it reaches cruising altitude, at which time it maintains a constant speed for several hours as long as it stays at cruising altitude. After flying for 32 minutes, the plane reaches cruising altitude and has flown 192 miles. After flying for a total of 92 minutes, the plane has flown a total of 762 miles. a) Determine the speed of the plane, at cruising altitude, in miles per minute. 9. 5 miles per minute b) Write an equation to represent the number of miles the plane has flown, y, during x minutes at cruising altitude, only. c) Assuming that the plane maintains its speed at cruising altitude, determine the total number of miles the plane has flown 2 hours into the flight.

MAFS. 912. F-LE. 2. 5 C

MAFS. 912. F-LE. 1. 1 The table below shows the elapsed time when two different cars pass a 10, 20, 30, 40 and 50 -meter mark on a test track. a) For car 1, what is the average velocity (change in distance divided by change in time) between the 0 and 10 -meter mark? Between the 0 and 50 -meter mark? Between the 20 and 30 -meter mark? Analyze the data to describe the motion of car 1. Meter interval Average velocity (meters per sec) Car 2 0 -10 meters 2. 24 5. 74 0 -50 meters 5 9. 35 20 -30 meters 7. 04 10. 73 b) How does the velocity of car 1 compare to that of car 2? Car 2 outperformed Car 1 in all distance intervals. d 10 20 30 40 50 Car 1 t 4. 472 6. 325 7. 746 8. 944 10. 000 Car 2 t 1. 742 2. 899 3. 831 4. 633 5. 348
 The per minute fee for Company B")
MAFS. 912. F-LE. 2. 5 False a) The per minute fee for Company B is greater than Company A. � True � False a) The fixed fee for Company B is greater than Company A. � True � False a) A call using Company B will always cost more than the same length call using Company A. � True � False
 (1, 3) (-1, 4)")
MAFS. 912. A-REI. 4. 10 � � � (-2, 0) (1, 3) (-1, 4) (1, -4) (0, -1)

MAFS. 912. F-LE. 2. 5 III IV II I V I. Plant # 1 starts as a seed and grows at a rate of 4 inches every 2 days. It takes an extra day to emerge from the ground. II. Plant # 2 was already 1 inch tall when planted and grows half of a foot every 4 days. III. Plant # 3 started as a seed and grows 6 inches every 2 days. IV. Plant # 4 was already 4 inches tall when planted and grows 1 foot every 12 days. V. Plant # 5 was already 1 inch tall when planted and grows 8 inches every 2 days.
")
MAFS. 912. A-CED. 1. 2 Consider the line containing the points (– 1, 3) and (4, 6). a) Write the equation for the line. b) Find another point on the line that has integer coordinates. Write the coordinates of the point you found.

MAFS. 912. F-LE. 2. 5, A-CED. 1. 2 What is the slope and y-intercept of the table? Write an equation to represent the table. -2 -1 0 1 2 -6 -5 -4 -3 -2

MAFS. 912. A-CED. 1. 2 Which linear equation represents the data in the accompanying table? 0 1 2 3 20. 00 21. 50 23. 00 24. 50 B

MAFS. 912. A-REI. 4. 10

MAFS. 912. A-REI. 4. 10 A

MAFS. 912. A-REI. 4. 10 C

MAFS. 912. A-CED. 1. 2 B

MAFS. 912. A-CED. 1. 2 Suppose you are preparing a snack mix. You want the total protein from peanuts and granola to equal 28 grams. Peanuts have 7 grams of protein per ounce, and granola has 3 grams of protein per ounce. a) Write an equation for the protein content of your mix. b) Graph your equation. Use your graph to find how many ounces of granola you should use if you use 1 ounce of peanuts. 7 ounces of granola will be required

MAFS. 912. A-CED. 1. 2 B

MAFS. 912. A-REI. 4. 10 B
- Slides: 78