Algebra 1 Chapter 3 3 1 Graphing Linear

Algebra 1 Chapter 3

3 -1 Graphing Linear Equations 1 Linear Equations and Intercepts A linear equation is an equation that forms a line when it is graphed. Linear equations are often written in the form Ax + By = C. This is called the standard form of a linear equation. In this equation, C is called a constant, or a number. Ax and By are variable terms.

Example 1 Identify Linear Equations Determine whether each equation is a linear equation. Write the equation in standard form. a. y = 4 − 3 x b. 6 x − xy = 4

A linear equation can be represented on a coordinate graph. The x-coordinate of the point at which the graph of an equation crosses the x-axis is an x-intercept. The ycoordinate of the point at which the graph crosses the y-axis is called a y-intercept.

2 Graph Linear Equations Example 4 Graph by Using Intercepts Graph 2 x + 4 y = 16 by using the x- and y-intercepts. To find the x-intercept, let y = 0. To find the y-intercept, let x = 0.

3 -2 Solving Linear Equations by Graphing A linear function is a function for which the graph is a line. The simplest linear function is f(x) = x and is called the parent function of the family of linear functions. A family of graphs is a group of graphs with one or more similar characteristics.

The solution or root of an equation is any value that makes the equation true. Values of x for which f(x) = 0 are called zeros of the function f. The zero of a function is located at the xintercept of the function. The root of an equation is the value of the x-intercept. • 4 is the x-intercept of 2 x − 8 = 0. • 4 is the solution of 2 x − 8 = 0. • 4 is the root of 2 x − 8 = 0. • 4 is the zero of f(x) = 2 x − 8.

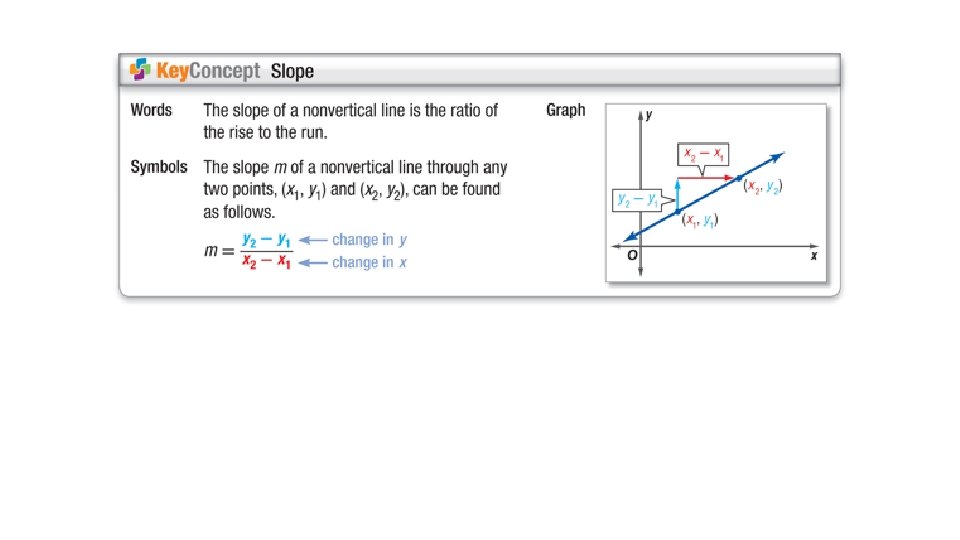
3 -3 Rate of Change and Slope 1 Rate of Change Rate of change is a ratio that describes, on average, how much one quantity changes with respect to a change in another quantity.

Example 1 Find Rate of Change Use the table to find the rate of change. Then explain its meaning.

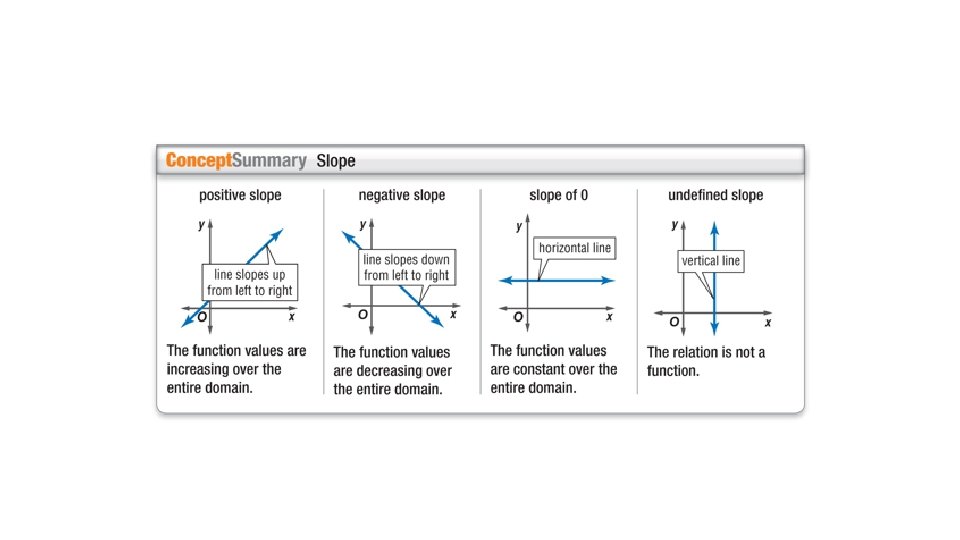
Example 4 Positive, Negative and Zero Slope Find the slope of a line that passes through each pair of points. a. (− 2, 0) and (1, 5) b. (− 3, 4) and (2, − 3)
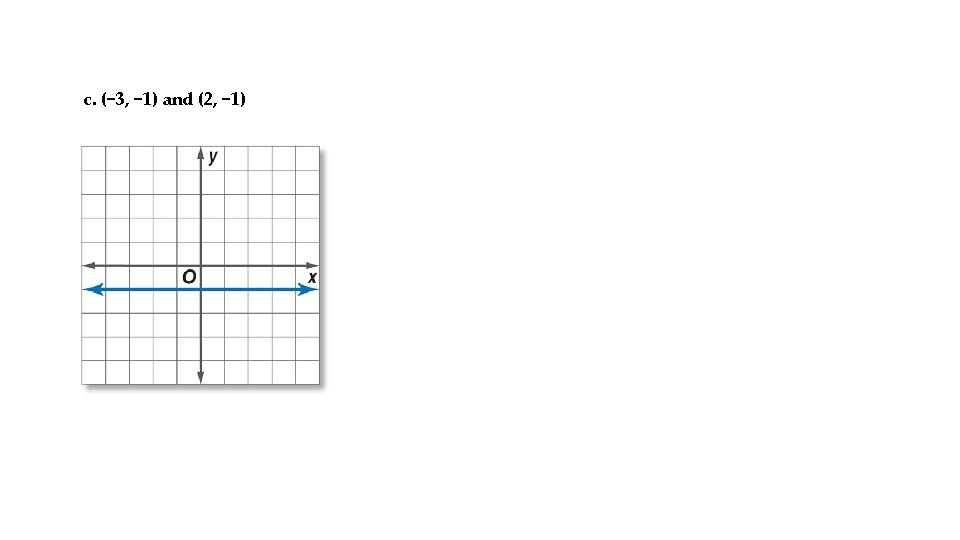

Example 5 Undefined Slope Find the slope of the line that passes through ( − 2, 4) and (− 2, − 3). Zero and Undefined Slopes If the change in y-values is 0, then the graph of the line is horizontal. If the change in x-values is 0, then the slope is undefined. This graph is a vertical line.

Example 6 Find Coordinates Given the Slope

CW 3. 3 • Log into Math. XL • Complete CW 3. 3 https: //www. mathxlforschool. com/home_school. htm

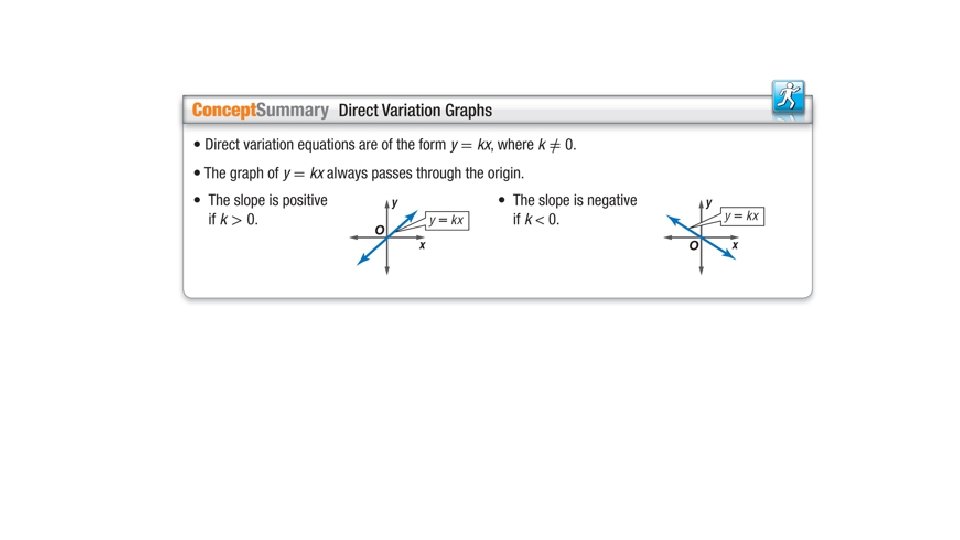
3 -4 Direct Variation 1 Direct Variation Equations A direct variation is described by an equation of the form y = kx, where k ≠ 0. The equation y = kx illustrates a constant rate of change, and k is the constant of variation, also called the constant of proportionality. Example 1 Slope and Constant of Variation Name the constant of variation for each equation. Then find the slope of the line that passes through each pair of points.

Example 2 Graph a Direct Variation Graph y = − 6 x. y = − 5 x y = 6 x

Example 3 Write and Solve a Direct Variation Equation Suppose y varies directly as x, and y = 72 when x = 8. a. Write a direct variation equation that relates x and y. b. Use the direct variation equation to find x when y = 63.

3 -5 Arithmetic Sequences as Linear Functions 1 Recognize Arithmetic Sequences A sequence is a set of numbers, called the terms of a sequence, in a specific order. Look for a pattern in the information given for the women’s crew team. Make a table to analyze the data. Since the difference between successive terms is constant, this is an arithmetic sequence. The difference between the terms is called the common difference d.

Example 1 Identify Arithmetic Sequences Determine whether each sequence is an arithmetic sequence. Explain. a. − 4, − 2, 0, 2, … b.

Example 2 Find the Next Term Find the next three terms of the arithmetic sequence 15, 9, 3, − 3, …. Step 1 Find the common difference by subtracting successive terms. Step 2 Add − 6 to the last term of the sequence to get the next term.
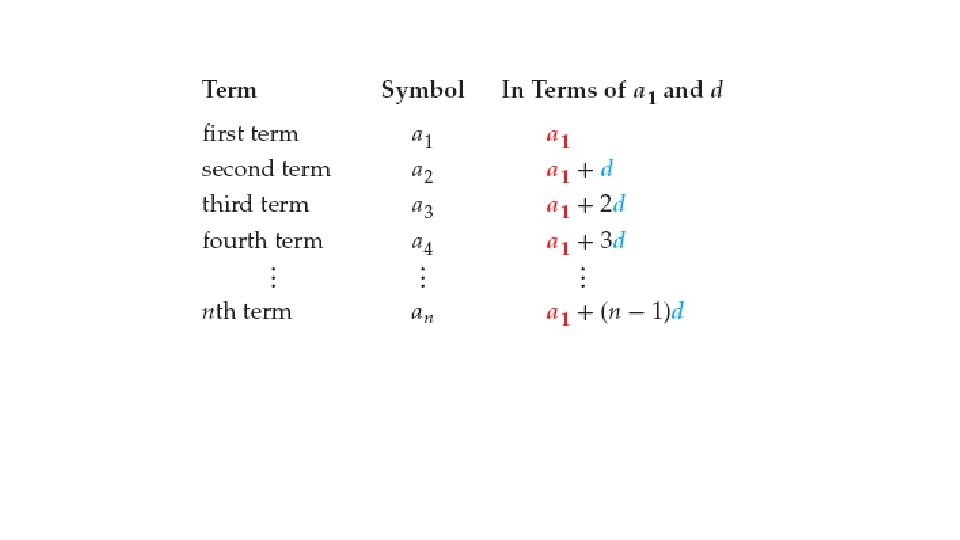

Example 3 Find the nth Term a. Write an equation for the nth term of the arithmetic sequence − 12, − 8, − 4, 0, …. b. Find the 9 th term of the sequence. Step 1 Find the common difference. Step 2 Write an equation.

3 -6 Proportional & Nonproportional Relationships 1 Proportional Relationships If the equation is of the form y = kx, then the relationship is proportional. In a proportional relationship, the graph will pass through (0, 0). So, direct variations are proportional relationships.

Example 1 Proportional Relationships Marcos is a personal trainer at a gym. In addition to his salary, he receives a bonus for each client he sees. Write an equation to describe this relationship. Use this equation to predict the amount of Marcos’s bonus if he sees 8 clients.

2 Nonproportional Relationships Some linear equations can represent a nonproportional relationship. If the ratio of the value of x to the value of y is different for select ordered pairs that are on the line, the equation is nonproportional and the graph will not pass through (0, 0). Example 2 Nonproportional Relationships Write an equation in function notation for the graph.
- Slides: 28