Algal Blooms and Cyanotoxins in Jordan Lake NC

Algal Blooms and Cyanotoxins in Jordan Lake, NC Dan Wiltsie NC Division of Water Resources Upper Cape Fear River Basin Association Technical Advisory Committee meeting July 31, 2018
 and Jordan Lake • Cyanobacteria - blue-green algae")
Cyanobacterial Harmful Algal Blooms (Cyano. HABs) and Jordan Lake • Cyanobacteria - blue-green algae • Jordan Lake Microcystis spp. • Built from 1967 to 1983 • Flood control, drinking water, recreation Popular Science • Has been monitored for a long time (NC Division of Water Resources) 2014

Cyano. HABs in Jordan Lake Research questions 1. Are there spatiotemporal patterns for phytoplankton assemblages? 2. Can environmental parameters be identified as drivers of phytoplankton abundance and/or composition shifts? 3. Are cyanotoxins present and can they be linked to environmental conditions?

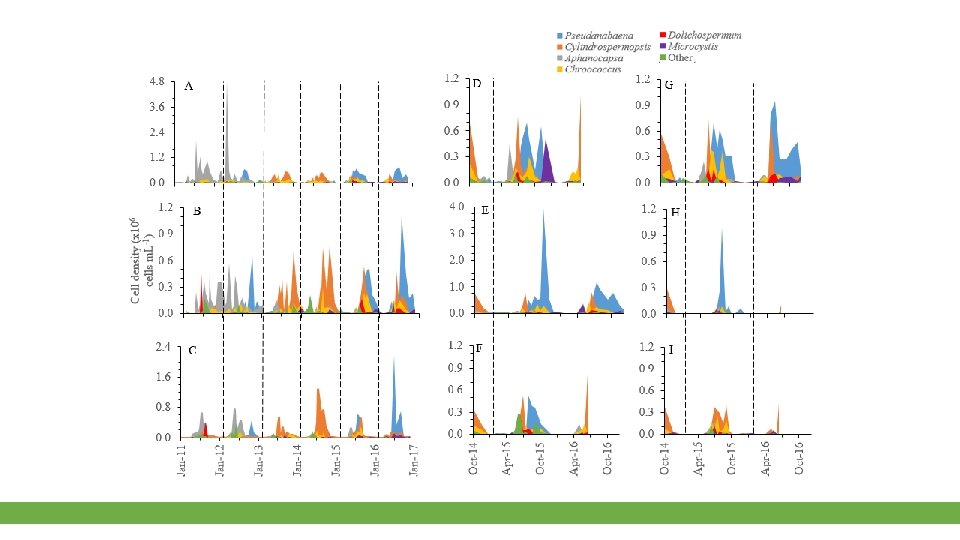
New Hope Creek Jordan Lake Morgan Creek Sampling and methods • 6 year time series D F E G • Biweekly to monthly sampling A • Biological (algal abundance and composition) • Environmental parameters • • Chemical (NH 3, NOx, TKN, TP, turbidity) Physical (temperature, dissolved oxygen, p. H) Meteorological (precipitation, wind speed, solar radiation) Hydrological (river flows) • Toxin sampling Haw River H C I Dam B

1. Are there spatiotemporal patterns for phytoplankton assemblages? NCCOS NOAA Cylindrospermopsis spp. Culture Collection Yerseke Algal Web Aphanocapsa spp. Pseudanabaena spp. Mikro Forum Cawthron Institute Chroococcus spp. Microcystis spp. Dolichospermum spp.

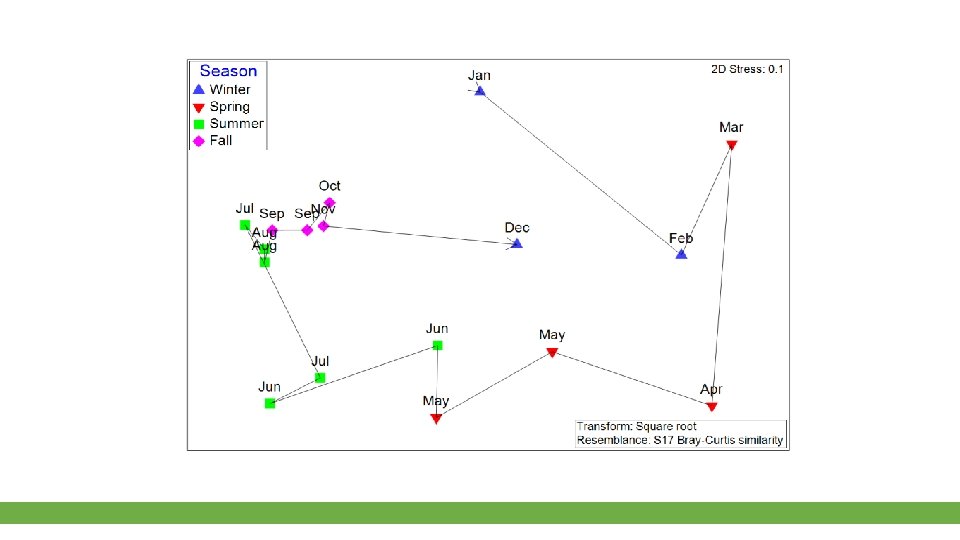
Cyanobacterial composition changes at 3 long-term sites 2012 v Monthly and seasonal but no interannual trends v Low spatial variability v 2 year shifts in dominant genus Cell density (x 106 cells m. L-1) 2011 2. 4 2015 2014 2013 2016 Site C 1. 6 0. 8 0. 0 Jan-11 Jan-12 Jan-13 Jan-14 Jan-15 Jan-16 Jan-17

2. Can environmental parameters be identified as drivers of phytoplankton abundance and/or composition shifts? Chemical • NOx (nitrate plus nitrite) • NH 3 (ammonia) • TKN (total Kjeldahl nitrogen) • Organic N plus ammonia • TP (total phosphorus) • TKN: TP • Turbidity Physical • Temperature • DO (dissolved oxygen) • p. H Meteorological • Precipitation • Wind speed • PAR (Photosynthetically Active Radiation) Hydrological • Morgan Creek flow • New Hope Creek flow • Haw River flow

2. Can environmental parameters be identified as drivers of phytoplankton abundance and/or composition shifts? Chemical • NOx (nitrate plus nitrite) • NH 3 (ammonia) • TKN (total Kjeldahl nitrogen) • Organic N plus ammonia • TP (total phosphorus) • TKN: TP • Turbidity Physical • Temperature • DO (dissolved oxygen) • p. H Meteorological • Precipitation • Wind speed • PAR (Photosynthetically Active Radiation) Hydrological • Morgan Creek flow • New Hope Creek flow • Haw River flow v Nitrogen species as consistent driver of biomass and density changes

2. Can environmental parameters be identified as drivers of phytoplankton abundance and/or composition shifts? Chemical • NOx (nitrate plus nitrite) • NH 3 (ammonia) • TKN (total Kjeldahl nitrogen) • Organic N plus ammonia • TP (total phosphorus) • TKN: TP • Turbidity Physical • Temperature • DO (dissolved oxygen) • p. H Meteorological • Precipitation • Wind speed • PAR (Photosynthetically Active Radiation) Hydrological • Morgan Creek flow • New Hope Creek flow • Haw River flow v Nitrogen species as consistent driver of biomass and density changes v Dissolved N and temperature best explain genera composition shifts

2. Can environmental parameters be identified as drivers of phytoplankton abundance and/or composition shifts? Chemical • NOx (nitrate plus nitrite) • NH 3 (ammonia) • TKN (total Kjeldahl nitrogen) • Organic N plus ammonia • TP (total phosphorus) • TKN: TP • Turbidity Physical • Temperature • DO (dissolved oxygen) • p. H Meteorological • Precipitation • Wind speed • PAR (Photosynthetically Active Radiation) Hydrological • Morgan Creek flow • New Hope Creek flow • Haw River flow v Nitrogen species as consistent driver of biomass and density changes v Dissolved N and temperature best explain genera composition shifts v Meteorological parameters did not correlate well with shifts

3. Are cyanotoxins present and can they be linked to environmental conditions? • Toxin removal - WTPs • Over 12 cyanotoxin classes • 5 different types of toxins tested MCY Guidelines (EPA) Drinking water (10 -day health advisories) 0. 3 µg L-1 for infants 1. 6 µg L-1 for adults Recreational water 4 µg L-1 Toxin Main Effect National Guidelines Comparable Toxin Microcystin (MCY) Hepatotoxin Yes Sarin Cylindrospermopsin (CYN) Hepatotoxin Yes Strychnine Anatoxin-a (ANA) Neurotoxin No Curare Saxitoxin (STX) Neurotoxin No Ricin β-N-methylamino-L-alanine (BMAA) Neurotoxin No

Complicating issues • What toxin ranges are found naturally? • Multiple toxins present? • Lack of epidemiological studies SPATTs (Solid Phase Adsorption Toxin Tracking) Pros • Time-integrative signal • Low detection limit • Fresh to marine application • Multiple toxin detection • Easy to deploy and recover Cons • Semi-quantitative • No link to regulatory limit

New Hope Creek Toxin testing Morgan Creek D • SPATTs E (Sites E and G) G A • Grab samples (Sites A through G) • Enzyme-Linked Immunosorbent Assay (ELISA) F Haw River H C I Dam B
 Consistent SPATT and grab data for ANA Microcystin 60 0.")
Toxin presence (site E) Consistent SPATT and grab data for ANA Microcystin 60 0. 8 2016 0. 6 40 0. 4 20 0. 2 0 Aug-15 ng toxin [g resin]-1 d-1 Limited data for CYN 2015 0 Dec-15 0. 06 Apr-16 Aug-16 0. 45 0. 36 0. 27 0. 18 0. 09 0 Dec-16 Aug-16 0. 25 0. 2 0. 15 0. 1 0. 05 0 Dec-16 Cylindrospermopsin 0. 04 0. 02 0 Aug-15 Dec-15 12 Apr-16 Anatoxin-a 8 4 0 Aug-15 Dec-15 Apr-16 ng toxin m. L-1 80 SPATTs detected MCY yearround
 ng toxin m. L-1")
Anatoxin positively correlated with TKN: TP Saxitoxin not detected (n=40) ng toxin m. L-1 Microcystin and anatoxin were correlated

Lingering questions/future research o Tying assemblage information to toxins o Chronic exposure to year-round, low toxin levels? o Exposure to multiple toxins? o Potential food web accumulations (fish, shellfish consumption)? o Different resins for different toxins (chemistry)

Thank you! Questions?
 – Jason Green, Mark")
Acknowledgments • North Carolina Division of Water Resources (NC DWR) – Jason Green, Mark Vander Borgh, Elizabeth Fensin • Master’s thesis committee – Dr. Astrid Schnetzer, Dr. Chris Osburn, Dr. Nathan Hall • Plankton Ecology lab • Tarek Aziz and Dan Obenour, Dept. of Civil, Construction, and Environmental Engineering • Raphe Kudela, UCSC • Bob Clarke, PRIMER-E Ltd. • NC Sea Grant • Urban Water Consortium (UWC)/Water Resources Research Institute (WRRI)
 0. 06 0. 02")
Status of knowledge of toxins in NC Ave (µg L-1) 0. 06 0. 02 0. 11 9. 32 ND 0. 17 n 65 63 69 64 40 6 0. 25 1 or 2 Location Apex Month, year Aug 2015 – Dec 2016 Water body Jordan Lake Piedmont Statewide Jun – Aug 2002 Jun – Jul 2007 11 reservoirs (including Jordan Lake) 10 reservoirs Toxin MCY CYN ANA BMAA STX MCY STX (1 lake) MCY Waterville Oct 2007 Waterville Reservoir MCY 824. 3 3 Riegelwood Fall 2009, Summer 2012 Jun 2011 – Sep 2012 Cape Fear River MCY Positive 4 reservoirs MCY 0. 19 Not given 5 Piedmont Reference This study Touchette et al. , 2007 Loftin et al. , 2016 Allender et al. , 2009 Isaacs et al. , 2014 Grubbs et al. , 2014
 National Lakes Assessment 2007 v v v Loftin et al.")
Environmental Protection Agency (EPA) National Lakes Assessment 2007 v v v Loftin et al. , 2016

Loftin et al. , 2016 v vv Loftin et al. , 2016

Loftin et al. , 2016

Site ID A B C D E F G H I DWR ID CPF 086 F CPF 087 D CPF 055 C CPF 086 CUPS CPF 086 C CPF 081 A 1 B CPF 081 A 1 C CPF 055 C 1 CPF 055 C 6 Lat (o. N) 35. 794 35. 742 35. 687 35. 837 35. 825 35. 836 35. 815 35. 699 35. 682 Long (o. W) 79. 004 79. 021 79. 083 79. 001 78. 998 78. 976 78. 983 79. 082 79. 078 From Jan 2011 Oct 2014 Oct 2014 To Dec 2016 Jun 2016 Dec 2016 Jun 2016 n 98 96 95 26 34 25 32 27 27 Ave. Water Column Depth (m) 5. 06 7. 67 5. 87 1. 47 2. 92 1. 82 3. 16 2. 25 8. 50

Units m o. C Collecting agency NC DWR Day delays Parameter Sample deptha Temperatureb Dissolved oxygenb p. Hb mg L-1 NC DWR NH 3 c mg L-1 NC DWR NOxc TKNc TPc Turbidityc Drought indexd Precipd Wind speedd PARd Morgan Creek flowd mg L-1 NTU cm m s-1 W m-2 m 3 s-1 New Hope Creek flowd m 3 s-1 Haw River flowd m 3 s-1 NC DWR NC DWR State Climate Office of NC USGS: Morgan Creek near Chapel Hill, NC (35. 89333ºN, 79. 01972ºW, 02097517) USGS: New Hope Creek near Blands, NC (35. 885ºN, 78. 96528ºW, 02097314) USGS: Haw River near Bynum, NC (35. 76528ºN, 79. 13583ºW, 02096960) 0, 5, 10 0, 5 4 0, 5, 10

Month Temperature Chl a NOx NH 3 TKN TP TKN: TP DO p. H Turbidity Precipitation Wind speed PAR Morgan Creek flow New Hope Creek flow Haw River flow R 0. 702 Season R 0. 614 0. 197 0. 103 0. 021 0. 054 0. 154 0. 333 0. 221 0. 266 P 0. 0001 NS 0. 0001 0. 018 NS NS 0. 0001 0. 012 0. 0001 0. 025 0. 146 0. 103 0. 038 0. 066 0. 253 0. 188 0. 193 P 0. 0001 NS 0. 0001 0. 042 NS 0. 003 0. 0001 NS 0. 0001 0. 249 0. 0001 0. 201 0. 0001 0. 185 0. 086 0. 022 0. 194 0. 091 0. 015 Year R 0. 031 0. 028 0. 044 0. 118 0. 094 0. 054 P NS NS NS 0. 0001 NS NS NS 0. 015 NS 0. 013 0. 011 0. 0001 NS 0. 0001 0. 0003 0. 038 0. 0006 0. 183 Site R 0. 133 0. 215 0. 21 0. 385 0. 335 0. 07 0. 346 P NS 0. 0001 NS 0. 0001

Site A B C D E F G H I Temp Chl a NOx NH 3 TKN TP TKN: TP DO p. H Turb Min Max Ave Min Max Ave (o. C) 4. 37 30. 78 20. 66 6. 26 30. 53 20. 53 4. 04 31. 45 21. 56 5. 65 32. 45 19. 97 5. 29 31. 37 20. 03 4. 95 31. 75 19. 85 4. 65 31. 25 19. 88 (µg L-1) 9. 00 99. 00 47. 21 7. 10 57. 00 28. 57 4. 60 72. 00 31. 26 21. 00 116. 00 58. 91 20. 00 116. 00 59. 84 9. 10 128. 00 76. 00 23. 00 120. 00 62. 30 (mg L-1) 0. 01 0. 41 0. 07 0. 01 0. 41 0. 09 0. 01 1. 10 0. 37 0. 01 1. 40 0. 24 0. 01 0. 59 0. 11 0. 02 0. 60 0. 14 0. 01 0. 48 0. 09 (mg L-1) 0. 01 0. 18 0. 04 0. 01 0. 20 0. 04 0. 01 0. 18 0. 03 0. 01 0. 06 0. 02 0. 01 0. 08 0. 02 0. 01 0. 14 0. 03 0. 01 0. 08 0. 02 (mg L-1) 0. 70 1. 50 0. 98 0. 58 1. 10 0. 78 0. 50 1. 10 0. 82 0. 72 1. 50 1. 04 0. 68 1. 40 1. 02 0. 63 1. 80 1. 16 0. 71 1. 40 1. 03 (mg L-1) 0. 04 0. 13 0. 08 0. 00 0. 06 0. 04 0. 16 0. 08 0. 06 0. 10 0. 05 0. 14 0. 08 0. 05 0. 24 0. 13 0. 05 0. 14 0. 09 7. 69 21. 75 13. 39 12. 67 36. 67 20. 60 5. 08 20. 5 11. 46 7. 50 16. 67 10. 89 7. 86 20. 00 12. 59 6. 54 30. 00 9. 43 8. 57 18. 80 12. 09 (mg L-1) 3. 23 13. 33 8. 02 4. 60 12. 83 8. 00 4. 10 13. 46 9. 07 5. 59 13. 12 9. 69 4. 97 12. 82 9. 43 4. 67 13. 20 9. 32 4. 61 12. 52 9. 17 5. 33 9. 17 7. 69 6. 57 8. 90 7. 60 6. 77 9. 43 7. 97 5. 47 9. 52 8. 09 5. 47 9. 40 8. 05 5. 43 9. 30 8. 05 5. 57 9. 07 7. 90 (NTU) 6. 50 35. 00 14. 24 3. 40 17. 00 7. 05 4. 30 60. 00 12. 78 11. 00 70. 00 30. 48 7. 90 40. 00 19. 14 14. 00 80. 00 37. 81 7. 90 45. 00 21. 77 Min Max Ave Average Std dev 4. 24 30. 46 18. 80 4. 54 31. 14 19. 38 20. 07 0. 79 1. 00 59. 00 17. 92 6. 90 67. 00 30. 46 45. 83 19. 61 0. 09 1. 50 0. 64 0. 02 0. 83 0. 36 0. 23 0. 19 0. 01 0. 32 0. 05 0. 01 0. 25 0. 03 0. 01 0. 45 1. 30 0. 83 0. 50 1. 10 0. 82 0. 94 0. 13 0. 05 0. 29 0. 12 0. 05 0. 22 0. 08 0. 09 0. 03 5. 14 13. 20 7. 35 5. 56 18. 20 11. 58 12. 15 3. 64 6. 10 13. 54 9. 58 5. 47 13. 19 9. 59 9. 10 0. 65 6. 91 8. 70 7. 78 7. 00 9. 31 7. 93 7. 90 0. 65 5. 00 180. 00 26. 26 5. 00 160. 00 19. 59 21. 01 9. 45 n 98 96 95 26 34 25 32 27
 Min 0. 00 Max 0. 02 Ave 0. 01 Wind speed")
Parameter Precipitation (cm) Min 0. 00 Max 0. 02 Ave 0. 01 Wind speed (m s-1) 1. 11 8. 20 4. 07 PAR (W m-2) 39. 38 371. 79 172. 34 Morgan Creek flow (m 3 s-1) 0. 10 0. 21 0. 12 New Hope Creek flow (m 3 s-1) 0. 09 0. 29 0. 14 Haw River flow (m 3 s-1) 1. 53 275. 52 27. 79

Group Diatom Chlorophyte Chrysophyte Cryptophyte Euglenophyte Prymnesiophyte Cyanobacteria Genus Achnanthidium Aulacoseira Navicula Synedra Unknown centric Ankistrodesmus Coelastrum Crucigenia Dictyosphaerium Kirchneriella Scenedesmus Tetrastrum Ochromonas Cryptomonas Komma Trachelomonas Species spp. spiriliformis falcatus spp. crucifera pulchellum spp. bijuga quadricauda bicaudatus heterocanthum spp. caudata spp. Chrysochromulina Anabaenopsis Aphanizomenon Aphanocapsa Merismopedia spp. circularis spp. delicatissima pulchra saxicola spp. raciborskii circinale planctonicum spiroides spp. punctata Microcystis aeruginosa Planktolyngbya firma undulata Pseudanabaena Raphidiopsis spp. Aphanothece Chroococcus Cylindrospermopsis Dolichospermum

Density Cyano Month Season P Site R P R A 0. 225 0. 0001 0. 249 B 0. 214 0. 0001 C 0. 415 A-C 0. 260 Biovolume Cyano Year R Month Season P P Site R P R 0. 0001 NS A 0. 234 0. 0001 0. 262 0. 0001 0. 19 0. 0001 NS B 0. 106 0. 002 0. 118 0. 0006 0. 0001 0. 416 0. 0001 NS C 0. 384 0. 0001 0. 376 0. 0001 0. 254 0. 0001 0. 037 A-C 0. 225 0. 0001 0. 224 0. 0001 0. 013 Microeuk Year R P NS 0. 045 0. 016 NS 0. 03 0. 001 Microeuk Month Site R P A 0. 065 0. 021 B Season R P NS Year Month R P Site R P NS 0. 299 0. 0001 A NS NS 0. 294 0. 0001 B NS 0. 046 0. 044 0. 208 0. 0001 C NS A-C 0. 043 0. 002 0. 022 0. 046 0. 261 0. 0001 A-C 0. 032 0. 015 Season R P Year R P Total phytoplankton Month Site R P A 0. 239 0. 0001 0. 248 0. 0001 0. 092 0. 0003 A B 0. 220 0. 0001 0. 198 0. 0001 0. 081 0. 0006 B C 0. 389 0. 0001 0. 398 0. 0001 0. 051 0. 02 C A-C 0. 262 0. 0001 0. 251 0. 0001 0. 083 0. 0001 A-C NS C Total phytoplankton Month Site R P Season R P 0. 137 R Year R P NS 0. 227 0. 0001 NS 0. 169 0. 0001 NS 0. 179 0. 0001 Season P Year R P 0. 0001 0. 145 0. 0001 0. 200 0. 0001 NS 0. 048 0. 037 0. 153 0. 0001 0. 183 0. 0001 0. 173 0. 0001 0. 140 0. 0001 0. 139 0. 0001 0. 119 0. 0001 0. 160 0. 0001

Density Site Cyano Microeuk Total phytoplankton R 0. 07 0. 137 0. 102 P 0. 0001 Biovolume Site R P 0. 053 0. 0001 0. 209 0. 0001 0. 113 0. 0001

Toxin Sample Type Avea Rangea MCY ANA CYN BMAA STX Diss SPATT Diss 0. 056 36. 202 0. 112 3. 971 0. 025 0. 006 1. 612 0. 000 0 - 1. 98 0 - 347. 45 0 - 0. 683 0. 31 - 13. 28 0 - 0. 83 0 - 0. 05 0 - >500 0 Positive Total n (%) 15 92 57 100 10 13 16 0 65 24 69 23 63 24 64 40 LDL Rec Thresh Drink Thresh (µg L-1) 0. 10 0. 04 4. 00 0. 015 4. 0 8. 0 0. 3 (infant) 1. 6 (adult) 0. 7 (infant) 3. 0 (adult)

MCY SPATT ANA dissolved Month R P NS NS Season R 0. 194 P 0. 024 NS NS Year R P NS NS NS Site R 0. 094 P NS NS 0. 018
 (mm 3 m-3) Chl a Cyano (cells m. L-1) 0.")
Cyano (cells m. L-1) (mm 3 m-3) Chl a Cyano (cells m. L-1) 0. 555 0. 515 0. 851 0. 358 0. 367 Cyano (mm 3 m-3) Microeuk (cells m. L-1) Microeuk (mm 3 m-3) Dissolved MCY Dissolved ANA Microeuk Diss MCY Diss ANA (µg L-1) 0. 447 0. 469 0. 101 0. 272 -0. 166 0. 125 -0. 352 -0. 257 -0. 540 -0. 586 0. 314 0. 364 0. 313 0. 132 -0. 229 -0. 499 0. 329 0. 408 -0. 008 -0. 154 -0. 295 0. 055 0. 277 0. 270 -0. 210 -0. 044 -0. 135 -0. 349 -0. 102 -0. 106 (cells m. L-1) (mm 3 m-3) NH 3 NOx (mg L-1)
 (mg")
TKN TP Turb Temp DO p. H Chl a Cyano (cells m. L-1) (mg L-1) (NTU) (o. C) (mg L-1) 0. 705 0. 217 0. 110 0. 164 0. 322 -0. 018 0. 441 0. 498 -0. 022 0. 306 -0. 112 0. 524 -0. 309 0. 458 Cyano (mm 3 m-3) 0. 492 0. 061 0. 229 0. 002 0. 470 -0. 229 0. 437 Microeuk (cells m. L-1) 0. 314 0. 049 0. 089 0. 068 0. 175 -0. 081 0. 200 Microeuk (mm 3 m-3) 0. 282 -0. 031 0. 158 -0. 105 0. 238 -0. 101 0. 231 Dissolved MCY Dissolved ANA 0. 147 -0. 016 -0. 023 -0. 183 0. 200 0. 326 -0. 075 -0. 230 0. 150 -0. 017 -0. 125 0. 255 0. 043 TKN: TP
 Adj. R 2 0. 680 0. 521 Cyano (mm 3")
Cyano (cells m. L-1) Adj. R 2 0. 680 0. 521 Cyano (mm 3 m-3) 0. 406 NOx TKN Microeuk (cells m. L-1) 0. 132 NOx TKN Microeuk (mm 3 m-3) 0. 189 NH 3 NOx Chl a Parameter 1 NH 3 Parameter 2 NOx Parameter 3 TKN Parameter 4 DO n 427 NOx TKN DO p. H 446 p. H 452 454 TKN Turbidity 454

Location Apex Month, year Oct 2014 – Dec 2016 Piedmont Waterville Jun – Aug 2002 Oct 2007 Water body Jordan Lake Toxin MCY CYN ANA BMA A Jordan Lake MCY Kerr Scott Reservoir MCY Tuckertown Reservoir MCY Oak Hollow Lake MCY Falls Lake MCY Narrows Reservoir MCY Lake Rhodhiss MCY Lake Michie MCY High Rock Lake MCY Lake Tillery MCY High Point Lake MCY Waterville Reservoir MCY Ave (µg L-1) 0. 06 0. 02 0. 11 Range (µg L-1) BDL - 1. 98 BDL - 0. 83 BDL - 0. 68 n 65 63 69 Method ELISA Reference This study 9. 32 0. 20* 0. 30* 0. 12* 0. 10* 0. 22* 0. 15* 0. 25* 0. 15* 0. 05* 0. 35* 0. 12* 824. 3 BDL - ADL ND ND ND 64 6 6 6 3 ELISA LC-MS Touchette et al. , 2007 Allender et al. , 2009 Particle fraction Dissolved ND Particulate

Location Riegelwood Piedmont Statewide Month, year Fall 2009, Summer 2012 Jun 2011 – Sep 2012 Jun – Jul 2007 Water body Cape Fear River Toxin MCY Ave (µg L-1) Positive City Lake Oak Hollow Lake Randleman Reservoir Lake Mackintosh Lake Lee Lake Rhodhiss MCY MCY MCY STX MCY MCY 0. 22 0. 21 0. 17 0. 21 0. 14 0. 03 0. 54 0. 17 0. 52 0. 16 0. 28 0. 16 0. 23 BDL – 0. 31 BDL – 0. 26 BDL – 0. 18 BDL – 0. 17 – 0. 24 BDL - 0. 14 BDL - 0. 03 0. 54 0. 17 0. 52 0. 16 0. 28 0. 16 0. 23 6 4 7 5 2 2 2 1 1 1 1 ELISA Grubbs et al. , 2014 Loftin et al. , 2016 0. 11 0. 22 0. 11 1 Lake Orange Lake Fisher High Rock Lake Townsend Falls Lake Hickory Beaverdam Lake Total Ave (MCY) Graham-Mebane Lake MCY Range (µg L-1) ND n ND Metho d LC-MS Referenc e Isaacs et al. , 2014 Particle Fraction Particulate Dissolved
 Average value 58. 6 Cyano den 765, 000 (cells")
Parameter Chl a (µg L-1) Average value 58. 6 Cyano den 765, 000 (cells m. L-1) MCY (µg L-1) CYN (µg L-1) 0. 120 0. 046 Risk Threshold Assignment Risk Threshold Concentration High >50 µg L-1 High >100, 000 cells m. L-1 Low 0. 1 - 10 µg L-1 Low 0. 05 - 1 µg L-1

2011 A 100 80 60 40 20 0 B 1. 2 0. 9 0. 6 0. 3 0 C 0. 16 0. 12 0. 08 0. 04 0 D TKN: TP NH 3 (mg L-1) NOx (mg L-1) Chl a (µg L-1) Temp (o. C) 35 28 21 14 7 0 30 E 20 10 0 Jan-11 Jan-12 Jan-13 Jan-14 2016 2015 2014 2013 2012 Jan-15 Jan-16 Jan-17
 0. 08 A 2011 2013 2012 2014 2015 2016 0. 04 0.")
Precipitation (cm) 0. 08 A 2011 2013 2012 2014 2015 2016 0. 04 0. 02 0. 00 Wind speed (m s-1) 10. 0 B 7. 5 5. 0 2. 5 0. 0 Overall flow (m 3 s-1) PAR (W m-2) 400 C 300 200 100 0 400 300 200 D 100 0 Jan-11 Jan-12 Jan-13 Jan-14 Jan-15 Jan-16 Jan-17

0. 0 Oct-16 Apr-16 Oct-15 Apr-15 Oct-14 1. 2 F 0. 9 0. 6 0. 3
![ng toxin [g resin]-1 d-1 1000 B MCY ANA 100 10 1 0. 1](http://slidetodoc.com/presentation_image_h/1b0032010901c3dfbae65e2ab51a19ac/image-44.jpg "ng toxin [g resin]-1 d-1 1000 B MCY ANA 100 10 1 0. 1")
ng toxin [g resin]-1 d-1 1000 B MCY ANA 100 10 1 0. 1 Spring Summer Fall Winter

Picture References • Slide 4: http: //www. algaebase. org/search/species/detail/? species_id=30050 ; https: //eoimages. gsfc. nasa. gov/images/imagerecords/84000/84125/Lake. Erie. Bloom_amo_2014215_lrg. jpg • Slide 6: http: //www. algaebase. org/search/species/detail/? species_id=30050 ; https: //en. wikipedia. org/wiki/Microcystin-LR#/media/File: Microcystin-LR. svg • Slide 7: https: //en. wikipedia. org/wiki/Cylindrospermopsin#/media/File: Cylindrospermopsin_structure 2. png
 NOx (mg L-1) Chl a (µg L-1) 2011 2013 2012 2016")
Temp (o. C) NOx (mg L-1) Chl a (µg L-1) 2011 2013 2012 2016 2015 2014 100 80 60 40 20 0 1. 2 0. 9 0. 6 0. 3 0 0. 16 0. 12 0. 08 0. 04 TKN: TP NH 3 (mg L-1) 35 28 21 14 7 0 0 30 20 10 0 Jan-11 Jan-12 Jan-13 Jan-14 Jan-15 Jan-16 Jan-17

Environmental Parameters • • • Temperature Chl a NOx NH 3 TKN TP TKN: TP DO p. H Turbidity
 (mm 3 m-3) Microeuk (cells m.")
Environmental Drivers Chl a Cyano (cells m. L-1) (mm 3 m-3) Microeuk (cells m. L-1) Microeuk NH 3 NOx (mm 3 m-3) (mg L-1) TKN (mg L-1) Temp (o. C) p. H 0. 555 0. 515 0. 851 0. 358 0. 367 0. 447 0. 469 -0. 352 -0. 257 -0. 540 -0. 586 0. 705 0. 498 0. 322 0. 524 0. 441 0. 458 Cyano (mm 3 m-3) 0. 314 0. 364 -0. 229 -0. 499 0. 492 0. 470 0. 437 Microeuk (cells m. L-1) 0. 329 -0. 154 -0. 295 0. 314 0. 175 0. 200 Microeuk (mm 3 m-3) -0. 210 -0. 349 0. 282 0. 238 0. 231
 2011")
Main environmental drivers Microeukaryote cell density NOx, TKN Adjusted R 2=0. 132 (n=454) 2011 2012 2013 2014 2016 2015 75 50 25 Cyanobacterial cell density (x 106 cells m. L-1) Cyanobacterial cell density NOx, TKN, DO, p. H Adjusted R 2=0. 521 (n=446) Microeukaryote cell density (x 106 cells m. L-1) Chl a NH 3, NOx, TKN, DO Adjusted R 2=0. 680 (n=427) Chl a (µg L-1) 100 0 Jan-11 2. 0 Jan-12 Jan-13 Jan-14 Jan-15 Jan-16 Jan-17 1. 5 1. 0 0. 5 0. 0 Jan-11 0. 3 0. 2 0. 1 0 Jan-11
- Slides: 49