Aldine Professional Development Workshop Navasota River Project Purpose


 were created in Arc. GIS")
- Slides: 25
Aldine Professional Development Workshop: Navasota River Project
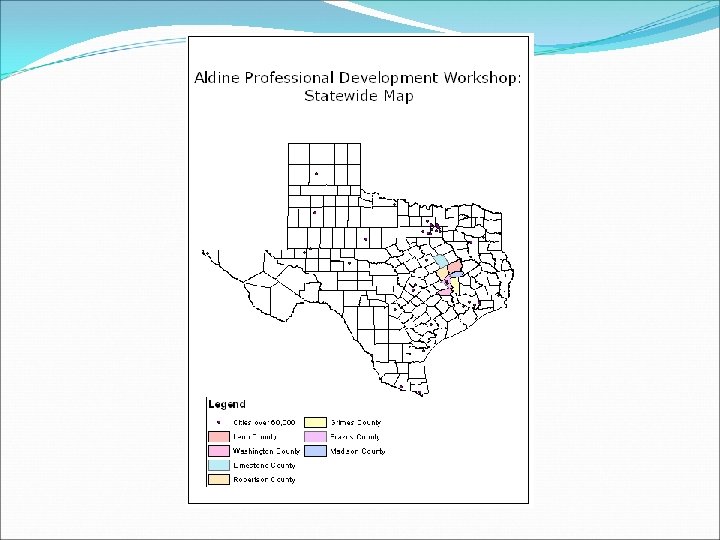
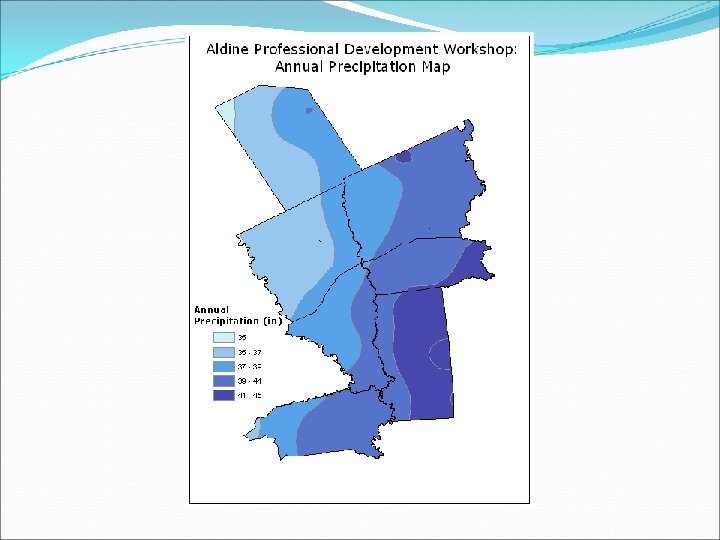
Purpose There are both statewide & maps of the 7 counties in which the Navasota flows Notice the context of the 7 counties in the overall statewide view for each parameter (i. e. precipitation, natural regions, etc. )
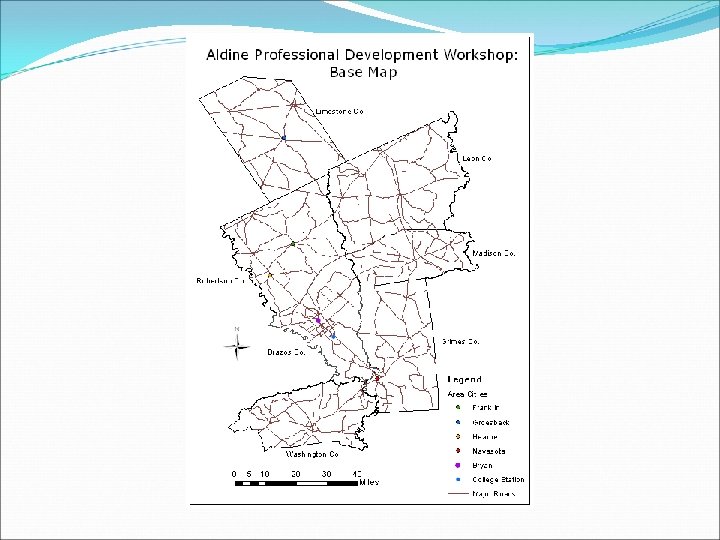
Geographic Location of Area of Interest The Navasota River is a tributary of the Brazos River Its headwaters (its beginning) are near Ft. Parker State Park outside of Groesbeck, Texas The Navasota River ends when it flows into the Brazos River southeast of Navasota, Texas It runs through 7 different counties: Limestone Robertson Leon Madison Brazos Grimes Washington
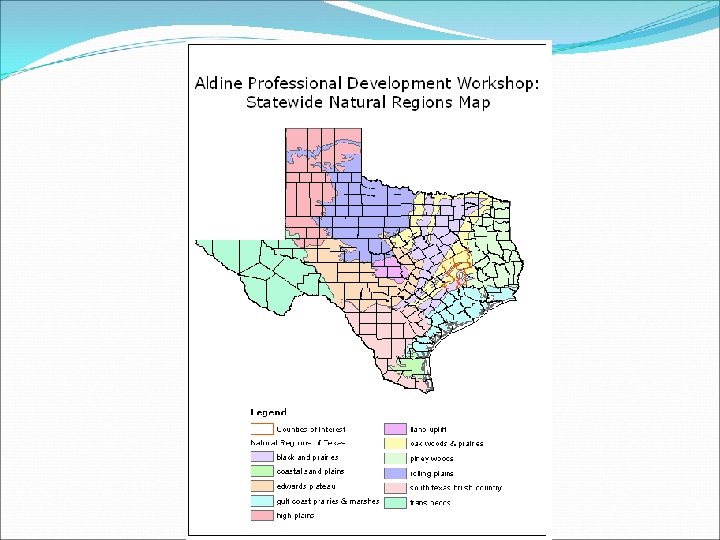
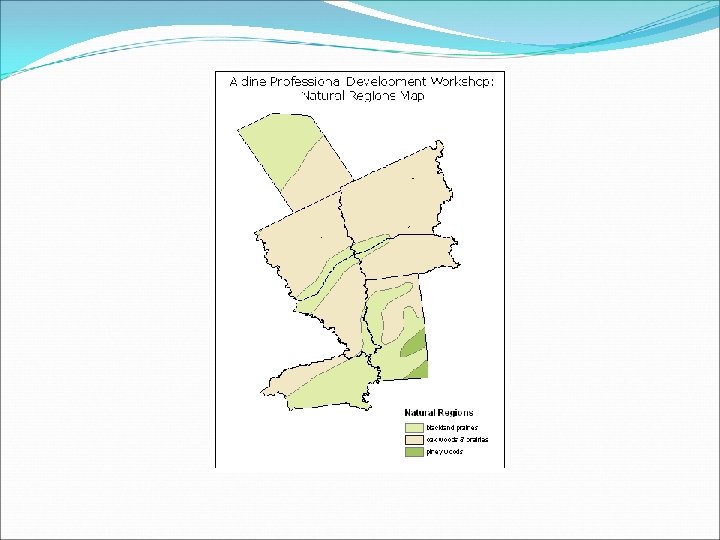
Texas Natural Regions Texas has 11 different natural regions Only 4 states have more than 10! On the statewide map, the 7 counties are highlighted with an orange outline Our 7 county study area encompasses 3 natural regions
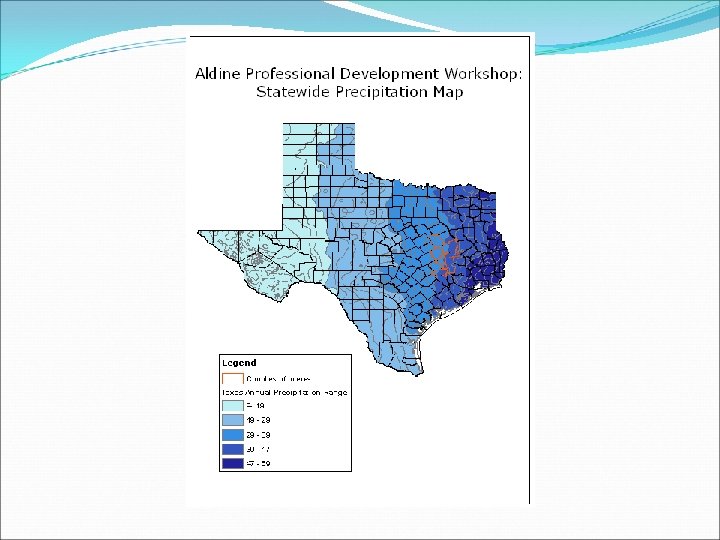
Precipitation is the amount of water that falls from the sky, which includes rain, snow, hail, & sleet Texas gets drier i. e. receives less precipitation the farther west you travel Why is that?
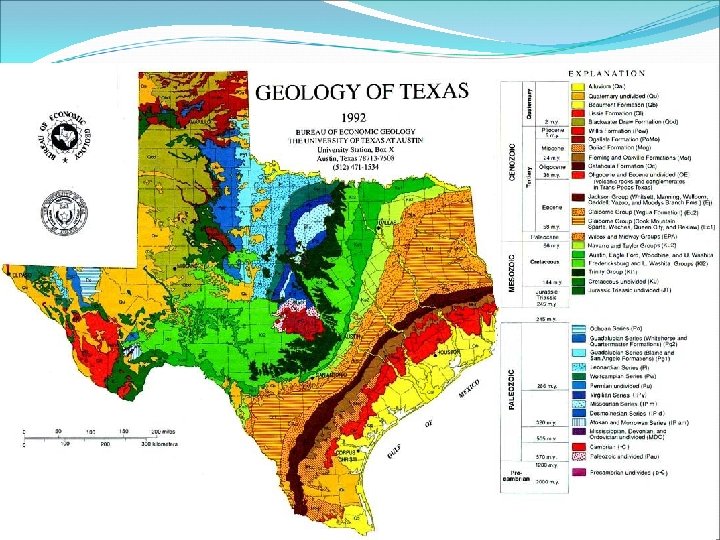
Geology of Texas is unique in terms of its geology You can see rocks that span all of geologic time in different parts of the state This is very cool for geologists! Our study area consists mainly of Cenozoic sediments Sorry, no dinosaur fossils – they came earlier in the Mesozoic
Questions: Statewide Maps What is the relationship between geologic regions & natural regions? What is the relationship between natural regions & precipitation? What
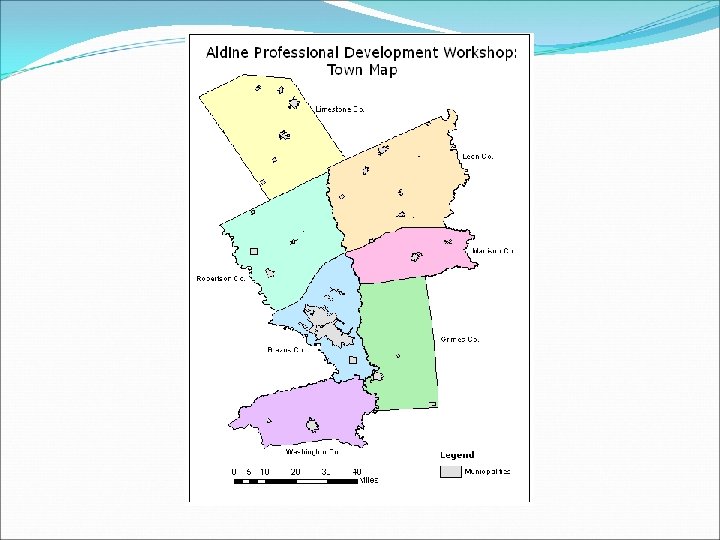
Area of Interest Let’s now focus on the 7 counties that comprise our study area To get your bearings, we’ll first see a map where the towns are marked with different colored dots Next we’ll see a map with the city limits outlined to gain a better understanding of large these towns are
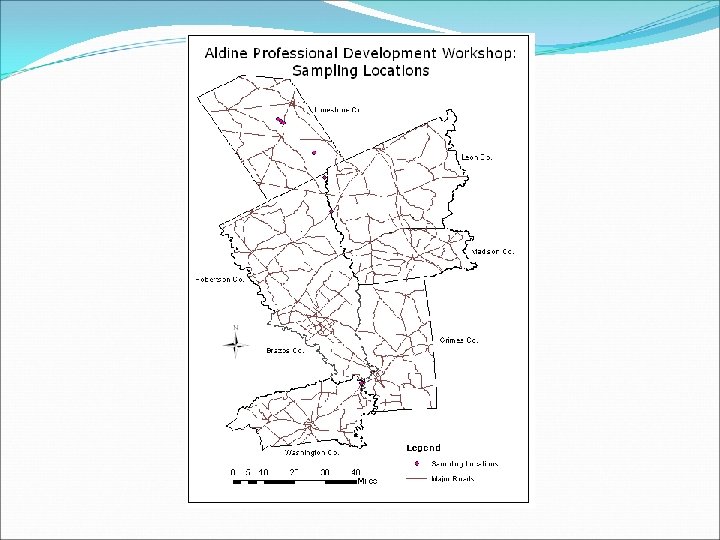
Sampling Locations Let’s now focus on the sampling locations The following map shows pink dots Each of which is a sampling location
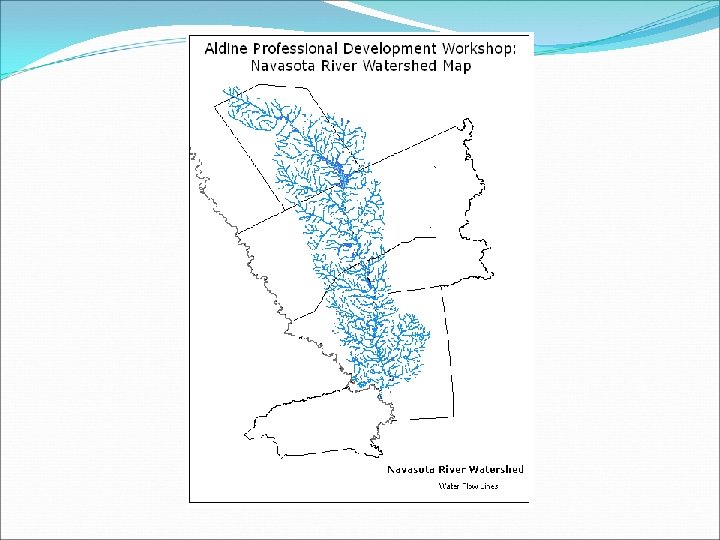
Watershed Map What exactly is a watershed? “A watershed is the area of land where all of the water that is under it or drains off of it goes into the same place. ” US EPA This following map illustrates the Navasota River’s drainage The United States Environmental Protection Agency “Surf Your Watershed” for the Navasota River: http: //cfpub. epa. gov/surf/huc. cfm? huc_code=12070103
Soil Type Map GIS Data source: USDA-NRCS
Questions: Relating Statewide to 7 county maps The precipitation maps show an overall trend that the farther you go from the Gulf of Mexico, the drier it is. On the statewide map, our counties are split between 2 regions while the 7 county map shows 5 regions. Why is that?
Questions: 7 county study area maps What is the relationship between natural regions & soil type? Why are there lakes where the Navasota River flows? On the soil type map, how can you tell where the river is? What type of soil is that? Brazos county’s eastern border is the Navasota river. Why is there clay along the river, but almost nowhere else in the county? Where did the clay come from?
Turbidity is a measure of the cloudiness or murkiness of water caused by suspended solids, and is an indicator of water quality. How might the various parameters (precipitation, soil type, etc. ) mentioned before affect turbidity in a river? How would human interference affect the turbidity in a river?
About the Maps All maps (excluding the geologic map) were created in Arc. GIS by Jayme M. Foster GIS data was downloaded for free from Texas Natural Resource Information System (TNRIS), United States Geologic Survey – National Hydrography Dataset (USGS-NHD), & United States Department of Agriculture Natural Resource Conservation Service (USDA-NRCS) Soil type data is available on the web (no GIS necessary) for free from the USDA Web Soil Survey http: //websoilsurvey. nrcs. usda. gov/app/