
Alcohol Withdrawal and Diabetes Mellitus Management October 20
Alcohol Withdrawal and Diabetes Mellitus Management October 20, 2014 Jennifer Bauman, RN, BA, PCCN Ph. D Student The Ohio State University College of Nursing 6270 Autumn 2014
Objectives • Define alcohol withdrawal. • Discuss the CIWA scale. • Describe nursing management of inpatient alcohol withdrawal. • Define diabetes mellitus. • Discuss nursing considerations for the hospitalized patient with diabetes mellitus. • Describe medical and lifestyle (i. e. , outpatient) management of diabetes mellitus.
Prevalence and Definition • Estimated 8 million alcohol dependent individuals in the U. S. • 500, 000 episodes of alcohol withdrawal require pharmacological intervention • Alcohol use disorder (DSM-V) • As of September 17, 10/33 patients on 8 PCU had a primary/admitting diagnosis of drug or alcohol intoxication/withdrawal (unknown number of patients had it listed as a secondary diagnosis) • Estimated 15 -20% of hospitalized patients afflicted by alcohol use disorder (Kosten et al. , 2003)
DSM-V Diagnostic Criteria for Alcohol Use Disorder • A problematic pattern of alcohol use leading to clinically significant impairment or distress, as manifested by at least two of the following, occurring within a 12 -month period: • Alcohol is often taken in larger amounts or over a longer period than was intended. • There is a persistent desire or unsuccessful efforts to cut down or control alcohol use. • A great deal of time is spent in activities necessary to obtain alcohol, use alcohol, or recover from its effects. • Craving, or a strong desire or urge to use alcohol. • Recurrent alcohol use resulting in a failure to fulfill major role obligations at work, school, or home. • Continued alcohol use despite having persistent or recurrent social or interpersonal problems caused or exacerbated by the effects of alcohol. • Important social, occupational, or recreational activities are given up or reduced because of alcohol use. • Recurrent alcohol use in situations in which it is physically hazardous. • Alcohol use is continued despite knowledge of having a persistent or recurrent physical or psychological problem that is likely to have been caused or exacerbated by alcohol. • Tolerance, as defined by either of the following: – A need for markedly increased amounts of alcohol to achieve intoxication or desired effect. – A markedly diminished effect with continued use of the same amount of alcohol. • Withdrawal, as manifested by either of the following: – The characteristic withdrawal syndrome for alcohol (refer to Criteria A and B of the criteria set for alcohol withdrawal). – Alcohol (or a closely related substance, such as a benzodiazepine) is taken to relieve or avoid withdrawal symptoms.
(cont’d) DSM-V Diagnostic Criteria for Alcohol Use Disorder • Specify if: In early remission: After full criteria for alcohol use disorder were previously met, none of the criteria for alcohol use disorder have been met for at least 3 months but for less than 12 months (with the exception that Criterion A 4, “Craving, or a strong desire or urge to use alcohol, ” may be met). • In sustained remission: After full criteria for alcohol use disorder were previously met, none of the criteria for alcohol use disorder have been met at any time during a period of 12 months or longer (with the exception that Criterion A 4, “Craving, or a strong desire or urge to use alcohol, ” may be met). • Specify if: In a controlled environment: This additional specifier is used if the individual is in an environment where access to alcohol is restricted
Common, Fatal, Costly Problem • Alcohol Use Disorders (AUDs) in the United States: – Adults (ages 18+): Approximately 17 million adults ages 18 and older (7. 2 percent of this age group) had an AUD in 2012. This includes 11. 2 million men (9. 9 percent of men in this age group) and 5. 7 million women (4. 6 percent of women in this age group). 3 – Youth (ages 12– 17): In 2012, an estimated 855, 000 adolescents ages 12– 17 (3. 4 percent of this age group) had an AUD. This number includes 444, 000 females (3. 6 percent) and 411, 000 males (3. 2 percent). 5 • Alcohol-Related Deaths: – Nearly 88, 0007 people (approximately 62, 000 men and 26, 000 women 8) die from alcohol related causes annually, making it the third leading preventable cause of death in the United States. 7 – In 2012, alcohol-impaired-driving fatalities accounted for 10, 322 deaths (31 percent of overall driving fatalities). 9
Common, Fatal, Costly Problem • Economic Burden: – In 2006, alcohol misuse problems cost the United States $223. 5 billion. 10 – Almost three-quarters of the total cost of alcohol misuse is related to binge drinking. 10 • Global Burden: – In 2012, 3. 3 million deaths, or 5. 9 percent of all global deaths (7. 6 percent for men and 4 percent for women), were attributable to alcohol consumption. 11 – Alcohol contributes to over 200 diseases and injury-related health conditions, most notably alcohol dependence, liver cirrhosis, cancers, and injuries. 12 In 2012, alcohol accounted for 5. 1 percent of disability adjusted life years (DALYs) worldwide. 11 – Globally, alcohol misuse is the fifth leading risk factor for premature death and disability; among people between the ages of 15 and 49, it is the first. 13 • Family Consequences: – More than 10 percent of U. S. children live with a parent with alcohol problems, according to a 2012 study. 14
(Ethyl) Alcohol = Ethanol • Ethyl alcohol is the only type of consumable ethanol. • Central nervous system (CNS) depressant • Simultaneously enhances inhibitory tone via modulation of gamma-aminobutyric acid (GABA) activity and dampens excitatory tone via modulation of excitatory amino acid activity • To keep the inhibitory and excitatory tones balanced (i. e. , homeostasis), must have constant presence of ethanol. • Abrupt cessation of ethanol creates an imbalance (i. e. , interrupts homeostasis) = overactivity of CNS
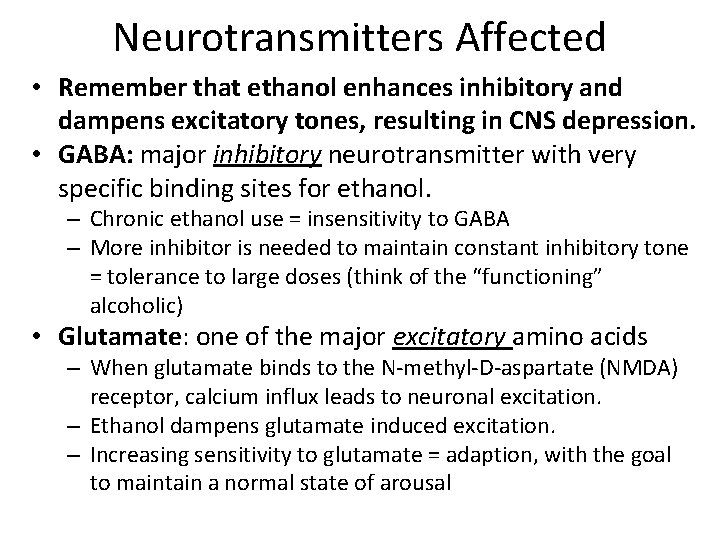
Neurotransmitters Affected • Remember that ethanol enhances inhibitory and dampens excitatory tones, resulting in CNS depression. • GABA: major inhibitory neurotransmitter with very specific binding sites for ethanol. – Chronic ethanol use = insensitivity to GABA – More inhibitor is needed to maintain constant inhibitory tone = tolerance to large doses (think of the “functioning” alcoholic) • Glutamate: one of the major excitatory amino acids – When glutamate binds to the N-methyl-D-aspartate (NMDA) receptor, calcium influx leads to neuronal excitation. – Ethanol dampens glutamate induced excitation. – Increasing sensitivity to glutamate = adaption, with the goal to maintain a normal state of arousal
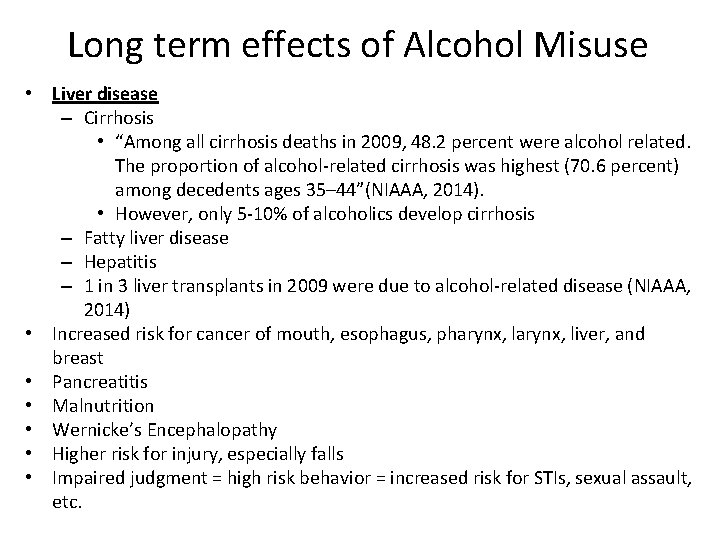
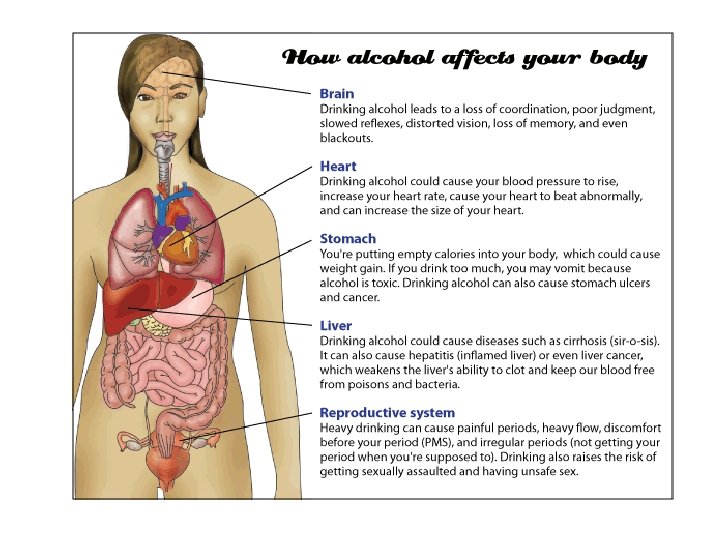
Long term effects of Alcohol Misuse • Liver disease – Cirrhosis • “Among all cirrhosis deaths in 2009, 48. 2 percent were alcohol related. The proportion of alcohol-related cirrhosis was highest (70. 6 percent) among decedents ages 35– 44”(NIAAA, 2014). • However, only 5 -10% of alcoholics develop cirrhosis – Fatty liver disease – Hepatitis – 1 in 3 liver transplants in 2009 were due to alcohol-related disease (NIAAA, 2014) • Increased risk for cancer of mouth, esophagus, pharynx, liver, and breast • Pancreatitis • Malnutrition • Wernicke’s Encephalopathy • Higher risk for injury, especially falls • Impaired judgment = high risk behavior = increased risk for STIs, sexual assault, etc.
Alcohol Withdrawal (If it doesn’t work, use this link: http: //www. youtube. com/watch? v=b. AEc. A 4 m. CMfc)

DSM-V Diagnostic Criteria for Alcohol Withdrawal • Cessation of (or reduction in) alcohol use that has been heavy and prolonged. • Two (or more) of the following, developing within several hours to a few days after the cessation of (or reduction in) alcohol use described in Criterion A: – – – – Autonomic hyperactivity (e. g. , sweating or pulse rate greater than 100 bpm). Increased hand tremor. Insomnia. Nausea or vomiting. Transient visual, tactile, or auditory hallucinations or illusions. Psychomotor agitation. Anxiety. Generalized tonic-clonic seizures.
DSM-V Diagnostic Criteria for Alcohol Withdrawal • The signs or symptoms in Criterion B cause clinically significant distress or impairment in social, occupational, or other important areas of functioning. • The signs or symptoms are not attributable to another medical condition and are not better explained by another mental disorder, including intoxication or withdrawal from another substance. • Specify if: With perceptual disturbances: This specifier applies in the rare instance when hallucinations (usually visual or tactile) occur with intact reality testing, or auditory, visual, or tactile illusions occur in the absence of a delirium.
Symptoms of Withdrawal Insomnia Anxiety and/or Fear Restlessness Nausea and/or Vomiting Headache Seizures – may need CT scan, lumbar puncture Altered Sensory Perceptions, including visual (common), tactile (common), auditory • Tremors • Diaphoresis • Tachycardia, which may/may not be accompanied by palpitations (why? ? ) • •
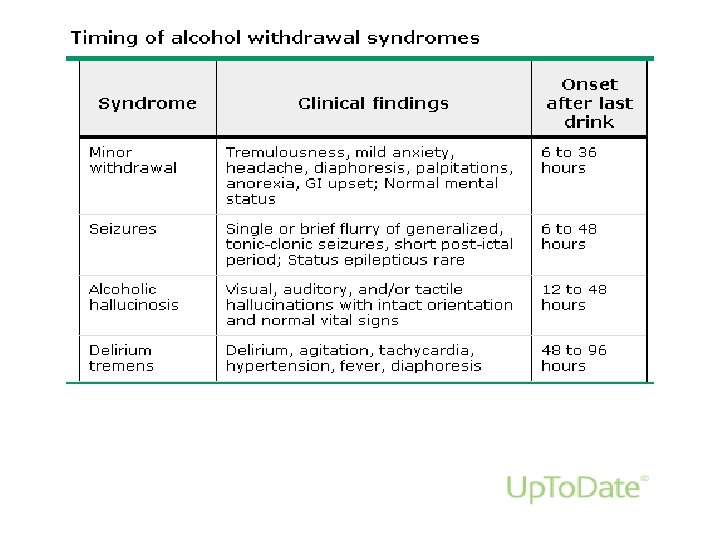
Delirium Tremens (DT) • “… hallucinations, disorientation, tachycardia, hypertension, fever, agitation, and diaphoresis in the setting of acute reduction or abstinence from alcohol. ” • Last up to 7 days, mortality rate of 5% • Increased cardiac indices, oxygen delivery, and oxygen consumption • Arterial p. H rises due to hyperventilation (respiratory alkalosis) = decrease in cerebral blood flow • Fluid and electrolyte status: • Hypovolemic r/t diaphoresis, hyperthermia, vomiting, and tachypnea • Hypokalemia r/t renal and extrarenal losses, alterations in aldosterone levels, and changes in potassium distribution across the cell membrane • Hypomagnesemia r/t malnutrition; may predispose to dysrhythmia (torsades pointes) and seizures • Hypophosphatemia r/t malnutrition; may contribute to cardiac failure and rhabdomyolysis.
Who is at risk for DT? • A history of sustained drinking • A history of previous DT • Over age 30 • The presence of a concurrent illness • The presence of significant alcohol withdrawal in the presence of an elevated alcohol level • A longer period since the last drink (ie, patients who present with alcohol withdrawal more than two days after their last drink are more likely to experience DT than those who present within two days)
Other diagnoses to consider • “A premature diagnosis of alcohol withdrawal can lead to inappropriate use of sedatives, which can further delay accurate diagnosis. ” • Infection (e. g. , meningitis) • Trauma (e. g. , intracranial hemorrhage) • Metabolic derangements • Drug overdose • Hepatic failure • Gastrointestinal bleeding
Nursing Management: ADPIE • Assessment • Diagnosis • Plan and Goals of Care • Implementation • Evaluation
Assessment: Clinical Institute Withdrawal Assessment (CIWA)
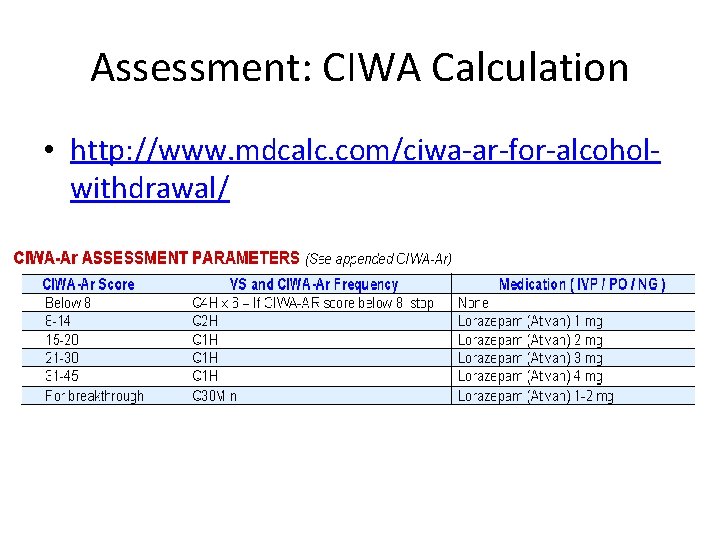
Assessment: CIWA Calculation • http: //www. mdcalc. com/ciwa-ar-for-alcoholwithdrawal/
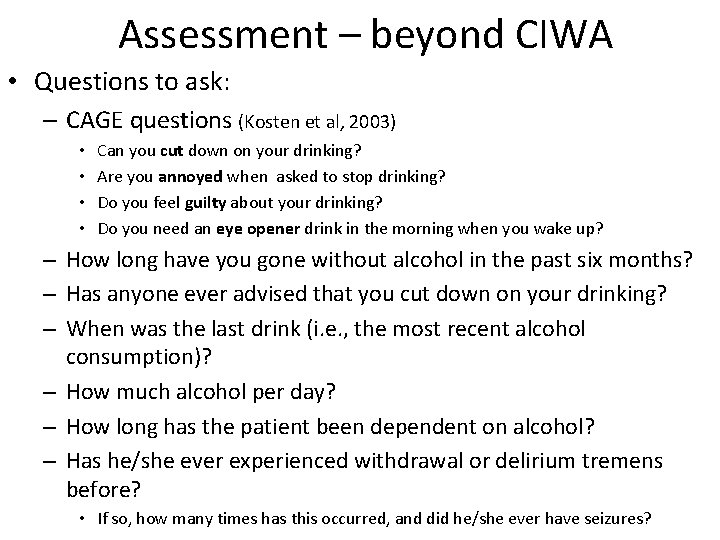
Assessment – beyond CIWA • Questions to ask: – CAGE questions (Kosten et al, 2003) • • Can you cut down on your drinking? Are you annoyed when asked to stop drinking? Do you feel guilty about your drinking? Do you need an eye opener drink in the morning when you wake up? – How long have you gone without alcohol in the past six months? – Has anyone ever advised that you cut down on your drinking? – When was the last drink (i. e. , the most recent alcohol consumption)? – How much alcohol per day? – How long has the patient been dependent on alcohol? – Has he/she ever experienced withdrawal or delirium tremens before? • If so, how many times has this occurred, and did he/she ever have seizures?
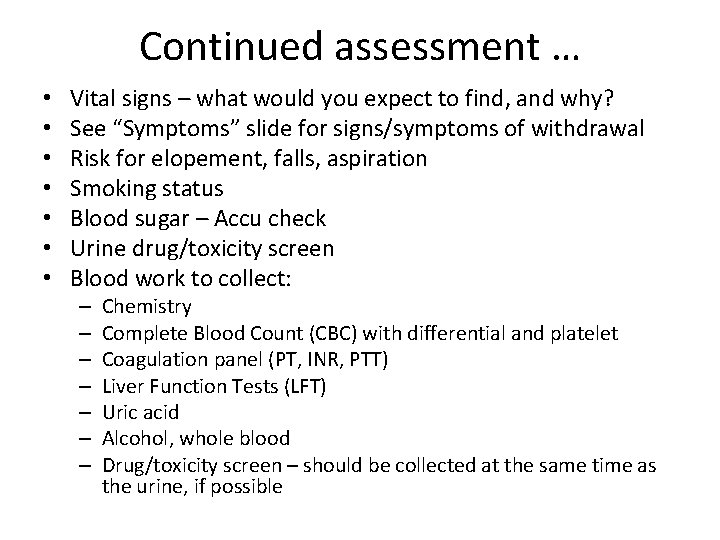
Continued assessment … • • Vital signs – what would you expect to find, and why? See “Symptoms” slide for signs/symptoms of withdrawal Risk for elopement, falls, aspiration Smoking status Blood sugar – Accu check Urine drug/toxicity screen Blood work to collect: – – – – Chemistry Complete Blood Count (CBC) with differential and platelet Coagulation panel (PT, INR, PTT) Liver Function Tests (LFT) Uric acid Alcohol, whole blood Drug/toxicity screen – should be collected at the same time as the urine, if possible
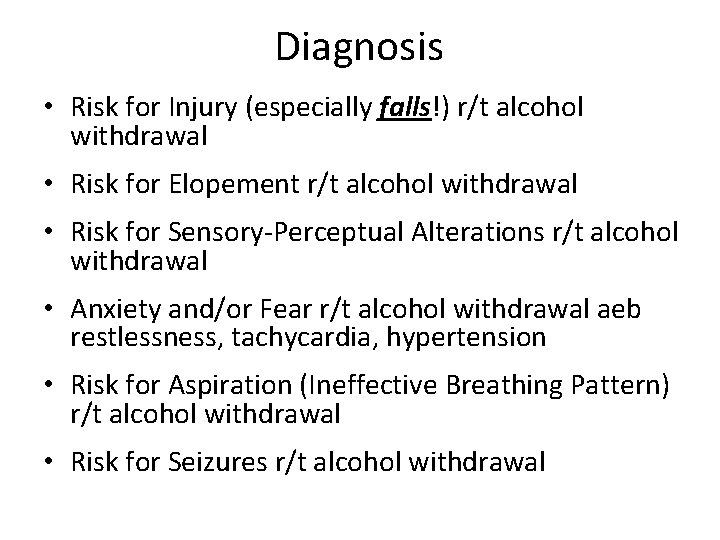
Diagnosis • Risk for Injury (especially falls!) r/t alcohol withdrawal • Risk for Elopement r/t alcohol withdrawal • Risk for Sensory-Perceptual Alterations r/t alcohol withdrawal • Anxiety and/or Fear r/t alcohol withdrawal aeb restlessness, tachycardia, hypertension • Risk for Aspiration (Ineffective Breathing Pattern) r/t alcohol withdrawal • Risk for Seizures r/t alcohol withdrawal
Plan and Goals of Care • The patient will remain free from falls during the hospital stay by using bed exit alarm and frequent monitoring by staff. • The patient will not elope from the hospital during his/her stay through frequent monitoring, purple gown, security alert. • The patient will not aspirate during his/her stay by keeping HOB > 30 degrees, monitoring during PO intake, staff evaluation for safe swallow.

Interventions • IV access • Administer medications (as ordered by LIP) • Possible sitter/safety coach and/or to be closer to nurses’ station • If at risk for elopement, place in special gown (at OSUWMC, it is bright purple), notify security of increased risk, and keep close to nurses’ station, away from elevators. • Going off the unit is contraindicated, both due to risk for elopement and medication administration • Avoid the use of restraints, especially LBB

Interventions • • • Bed exit alarm Seizure pads on bedrails HOB at 30 degrees or greater, if no contraindications Quiet, dark, calm environment Fan or cool washcloths Nurse should present calm demeanor Limit setting Nicotine replacement Consults: social work, nutrition, psychiatry, nicotine dependence
Interventions: Medications • • • Chlordiazepoxide (Librium) – long-acting benzodiazepine Diazepam (Valium) – long-acting benzo Lorazepam (Ativan) – short-acting benzo Flumazenil (Romazicon) – reversal agent for benzo Clonidine (Catapres) - centrally acting alpha-2 agonist, for severe DT, but may mask symptoms of worsening status Phenobarital – anticonvulsant, if severe DT or status epilecticus AVOID the routine use of anticonvulsants, beta blockers (mask symptoms) and antipsychotics (lower the seizure threshold) Vitamins, especially folic acid and thiamine Electrolytes, especially glucose, magnesium, phosphate, and potassium Intravenous fluids, if not contraindicated
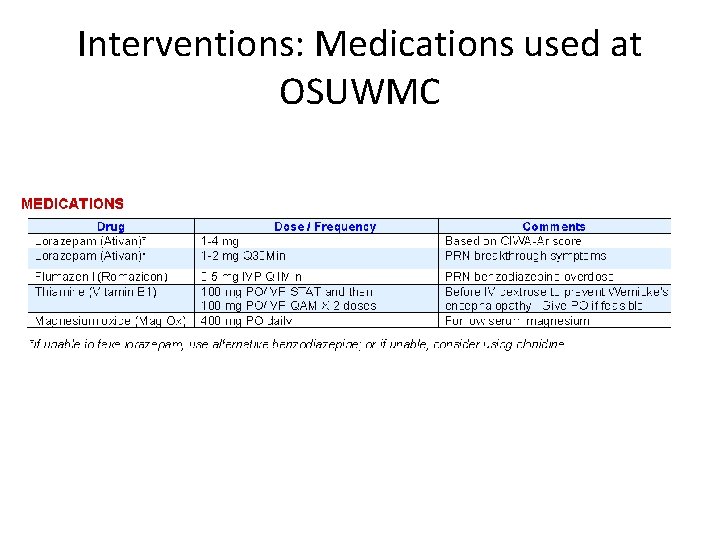
Interventions: Medications used at OSUWMC

Evaluation • Back to assessment – check CIWA score per the protocol • Re-assess

Questions?

References • • • American Psychiatric Association. (2013). Diagnostic and statistical manual of mental disorders (5 th ed. ). Arlington, VA: American Psychiatric Publishing. Retrieved September 30, 2014, from http: //dsm. psychiatryonline. org/book. aspx? bookid=556. Hoffman, R. S. , & Weinhouse, G. L. (2013). Management of moderate and severe alcohol withdrawal syndromes. In S. J. Traub & J. Grayzel (Eds. ), Up. To. Date. Retrieved from http: //www. uptodate. com/. Kosten, T. R. , & O’Connor, P. G. (2003). Management of drug and alcohol withdrawal. New England Journal of Medicine, 348(18), 1786 -95. MDCalc. (2014). CIWA-Ar for Alcohol Withdrawal. Retrieved September 20, 2014, from http: //www. mdcalc. com/ciwa-ar-for-alcohol-withdrawal. National Institute on Alcohol Abuse and Alcoholism (NIAAA). (2014). Alcohol facts and statistics. Alcohol and Your Health. Retrieved September 30, 2014, from http: //www. niaaa. nih. gov/alcohol-health/overview-alcohol -consumption/alcohol-facts-and-statistics. National Institute on Alcohol Abuse and Alcoholism. (n. d. ). What is a standard drink? . Alcohol and Your Health. Retrieved September 30, 2014, from http: //www. niaaa. nih. gov/alcohol-your-health/overview-alcohol -consumption/standard-drink. Nurselabs. com (n. d. ). 5 Alcohol Withdrawal Nursing Care Plans. Retrieved September 30, 2014, from http: //nurseslabs. com/5 -alcohol-withdrawal-nursing-care-plans/. Office of Women’s Health at the U. S. Department of Health and Human Services. (2013). Straight talk about alcohol. Girls. Health. gov. Retrieved September 30, 2014, from www. girlshealth. gov. Weed, H. G. (2011). Clinician’s Guide to Alcohol Withdrawal as a Secondary Diagnosis. 2 nd Edition. From The Ohio State University Medical Center Evidence Based Practice Clinical Resources. Retrieved September 20, 2014, from http: //www. osumc. edu.

TAKE A BREAK (please)!
Diabetes
Diabetes: A huge public health problem • Diabetes affects 29. 1 million people of all ages – Diagnosed: 21 million – Undiagnosed: 8. 1 million • That’s 9. 3% of the U. S. population! • About 1. 7 million adults were newly diagnosed with diabetes in 2012 in the U. S. • An estimated 86 million American adults have pre-diabetes • By 2050, 1 in 3 Americans will have diabetes!
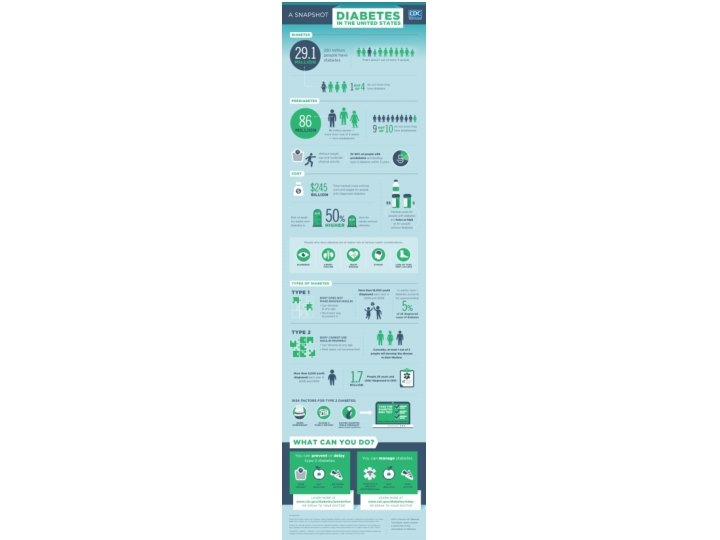
Why individuals with diabetes should be concern • Medical expenses for people with diabetes are more than 2 times higher than for people without diabetes. • The total annual cost of diabetes is $245 billion (CDC, 2014) – Direct medical: $176 billion – Indirect: $69 billion • “In 2003– 2006, after adjusting for population age differences, rates of death from all causes were about 1. 5 times higher among adults aged 18 years or older with diagnosed diabetes than among adults without diagnosed diabetes” (CDC, 2014). • INEQUALITIES – those in lower socioeconomic position and nonwhites are more likely to develop T 2 DM
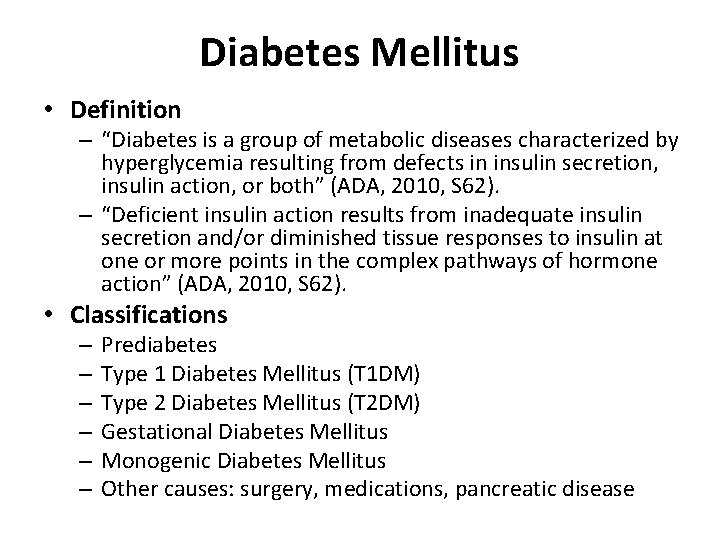
Diabetes Mellitus • Definition – “Diabetes is a group of metabolic diseases characterized by hyperglycemia resulting from defects in insulin secretion, insulin action, or both” (ADA, 2010, S 62). – “Deficient insulin action results from inadequate insulin secretion and/or diminished tissue responses to insulin at one or more points in the complex pathways of hormone action” (ADA, 2010, S 62). • Classifications – – – Prediabetes Type 1 Diabetes Mellitus (T 1 DM) Type 2 Diabetes Mellitus (T 2 DM) Gestational Diabetes Mellitus Monogenic Diabetes Mellitus Other causes: surgery, medications, pancreatic disease
Diabetes complications https: //www. youtube. com/watch? v=p. Qj. Wg. OSFCh. I
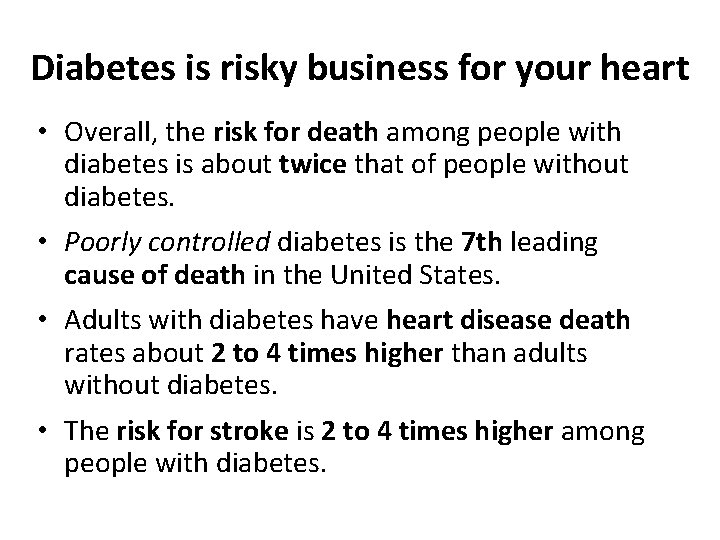
Diabetes is risky business for your heart • Overall, the risk for death among people with diabetes is about twice that of people without diabetes. • Poorly controlled diabetes is the 7 th leading cause of death in the United States. • Adults with diabetes have heart disease death rates about 2 to 4 times higher than adults without diabetes. • The risk for stroke is 2 to 4 times higher among people with diabetes.
… and for your eyes, kidneys, nerves, mouth, and mental health … • Poorly controlled diabetes is the leading cause of kidney failure, non-traumatic lower-limb amputations, and new cases of blindness among adults in the United States. • Those with diabetes have about twice the risk of gum disease than those without diabetes. • People with diabetes are more susceptible to many other illnesses. • People with diabetes are twice as likely to have depression.
True or False? • Diabetes is the leading cause of blindness, amputations, and kidney problems.

How to prevent complications • Proper glycemic control can prevent or delay the micro- and macro-vascular complications that lead to poor outcomes (DCCT, 1993; Stratton et al. , 2000). • This can be achieved through adequate selfmanagement (SM) (Atak et al. , 2008; Chen et al. , 2013; Aljasem et al. , 2001; Osborn, Bains, & Egede, 2010). • Regular follow-up with primary care providers is ESSENTIAL.
Diabetes overview https: //www. youtube. com/watch? v=MGL 6 km 1 NBWE

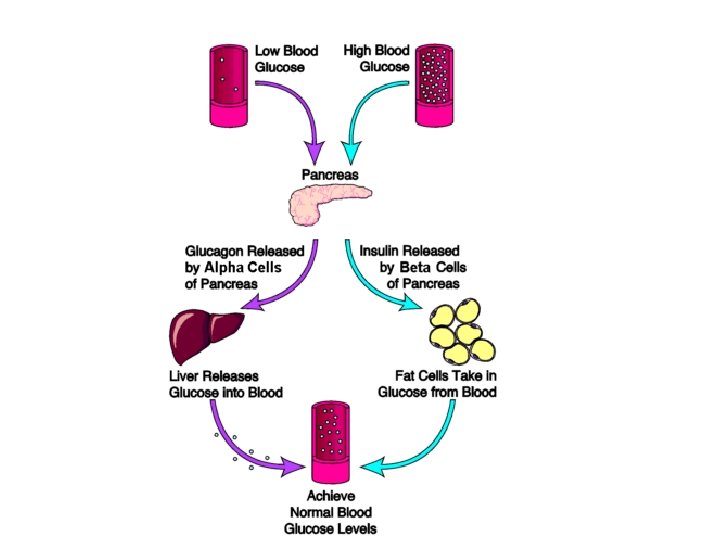
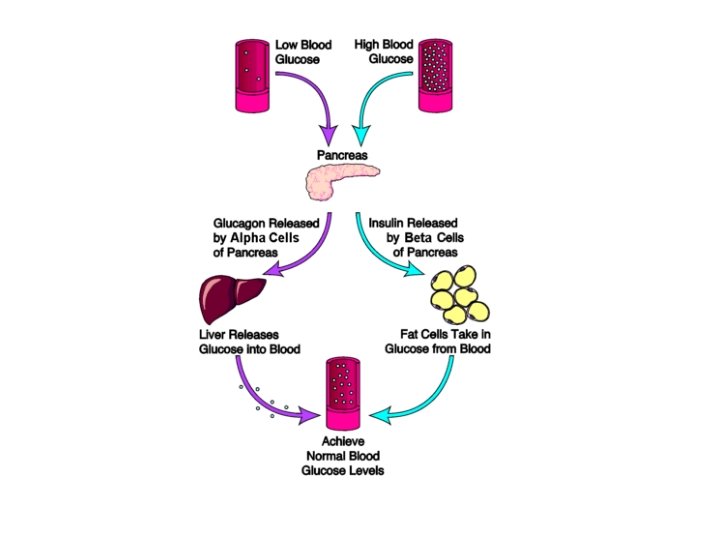
Pathophysiology Overview • The pancreas produces insulin in response to an increase in blood sugar, which occurs after eating food • Insulin functions as the “key” to let the sugar into the cells. Without the insulin, the sugar remains in the blood and cannot be used by the cell for daily functions. • For those with Type 1 diabetes, the pancreas is unable to make insulin. • For those with Type 2 diabetes, the cells have difficulty using the insulin, which happens when the cells become resistant to the insulin. After a while, the pancreas gets “tired” and produces less insulin. • Both result in high blood sugar levels, which leaves the cells starved of sugar.
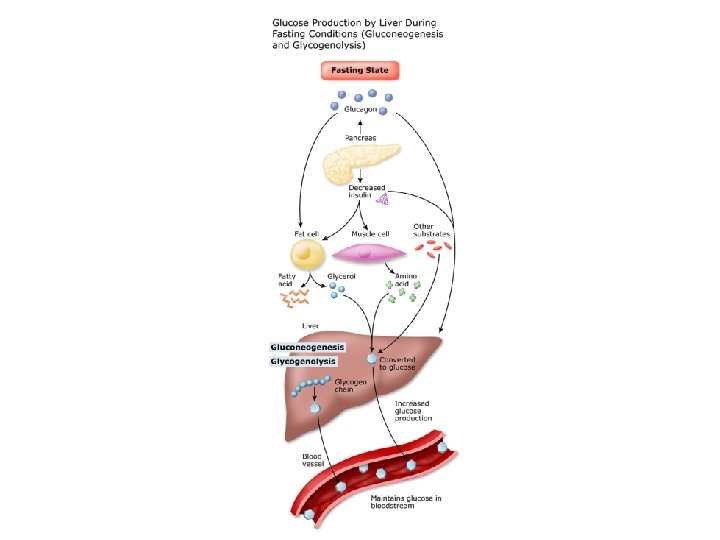
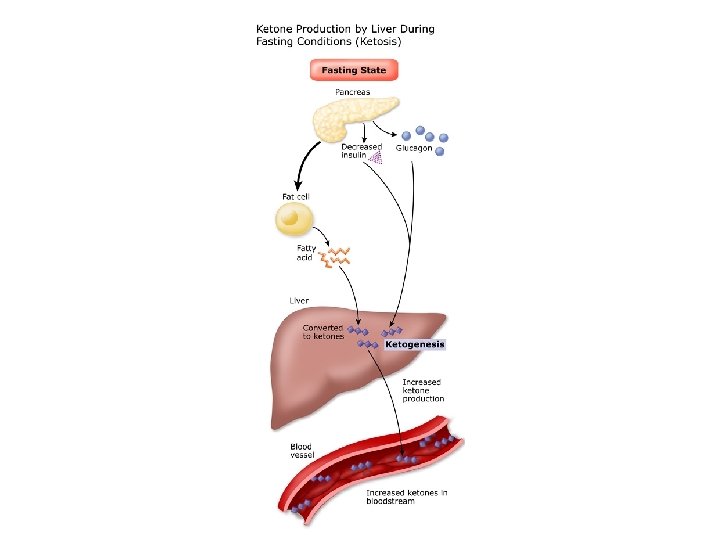
Glucose Regulation • Glucose = major energy source • BG level “regulated by rate of consumption and intestinal absorption of dietary carbohydrate, the rate of utilization of glucose by peripheral tissues and the loss of glucose through the kidney tubule, and the rate of removal or release of glucose by the liver” (Nordlie et al. , 1999, p. 380). • Liver regulates BG level through the following: – Glycogenesis: uptake of extra glucose, to store as glycogen – Glycogenolysis: release of glucose by turning glycogen into glucose – Gluconeogenesis: release of glucose by harvesting amino acids, waste products, fat byproducts – Ketogenesis: when glycogen and insulin levels are low, the liver breaks down fats into ketones to use as energy for less essential organs, reserving glucose for brain, RBCs, some of the kidneys (REMEMBER THIS FOR LATER!)
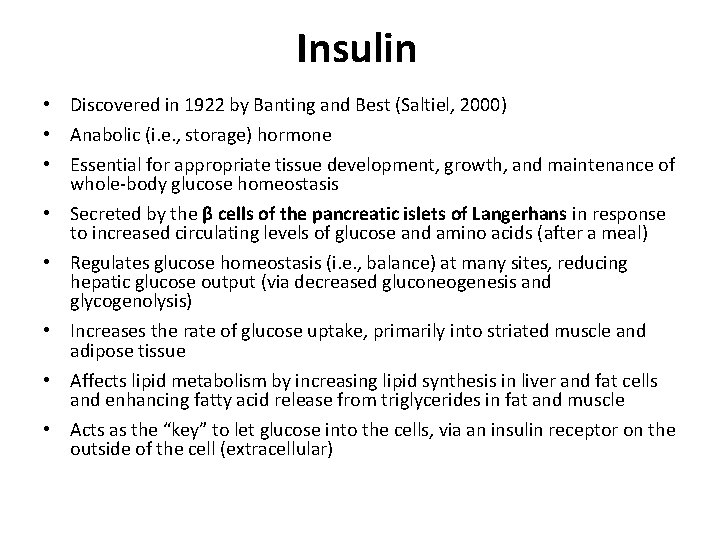
Insulin • Discovered in 1922 by Banting and Best (Saltiel, 2000) • Anabolic (i. e. , storage) hormone • Essential for appropriate tissue development, growth, and maintenance of whole-body glucose homeostasis • Secreted by the β cells of the pancreatic islets of Langerhans in response to increased circulating levels of glucose and amino acids (after a meal) • Regulates glucose homeostasis (i. e. , balance) at many sites, reducing hepatic glucose output (via decreased gluconeogenesis and glycogenolysis) • Increases the rate of glucose uptake, primarily into striated muscle and adipose tissue • Affects lipid metabolism by increasing lipid synthesis in liver and fat cells and enhancing fatty acid release from triglycerides in fat and muscle • Acts as the “key” to let glucose into the cells, via an insulin receptor on the outside of the cell (extracellular)
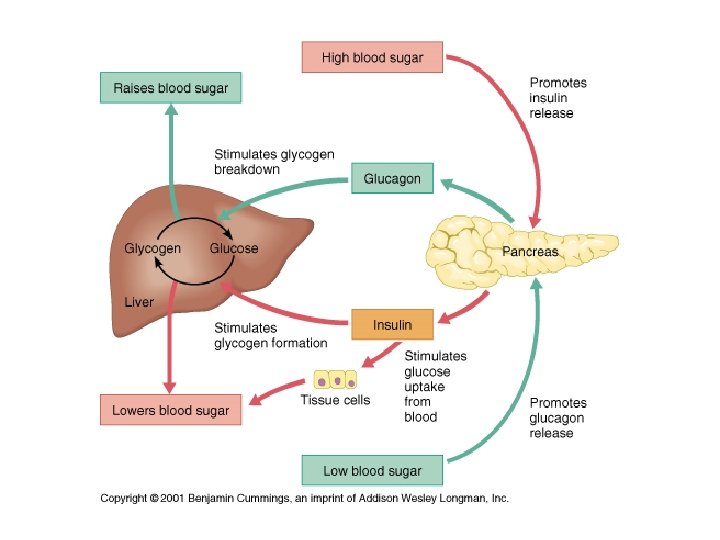
Insulin Functions


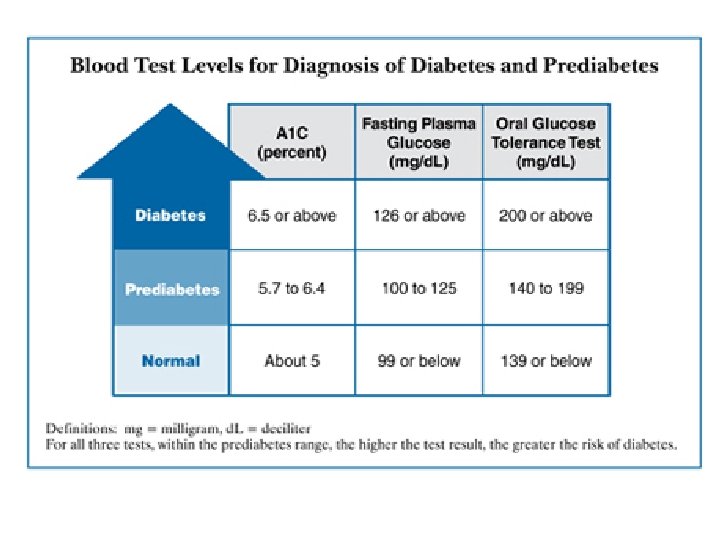
Pre-Diabetes and Metabolic Syndrome • Metabolic Syndrome (AHA, 2014) – Affects approximately 1/3 of Americans – Increased risk for diabetes, stroke, heart disease – 3 of 5 criteria • Fasting BG greater than 100 mg/d. L • Waist circumference greater than 35 inches for women, 40 inches for men (central obesity, indicating increased visceral adipose tissue) • Hypertension (BP >130/85) • Triglyceride level greater than 150 mg/d. L • HDL less than 50 mg/d. L for women, 40 mg/d. L for men • Pre-diabetes (CDC, 2014; ADA, 2012) – – 15 -30% of those with prediabetes will develop T 2 DM in 5 years Elevated fasting BG (>100 -125 mg/d. L) on two occasions Oral glucose tolerance test of 140 -199 mg/d. L Hb. A 1 c 5. 7 -6. 4%
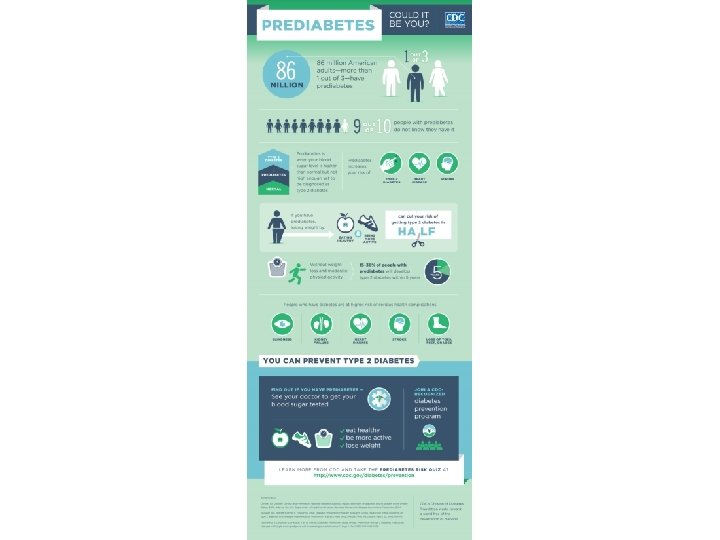
Treatment of Prediabetes and Metabolic Syndrome • LOSE WEIGHT • Physical activity >150 minutes/week • Dietary considerations • Control BP, lipids, cholesterol levels • Diabetes Prevention Program (DPP)

Type 1 Diabetes • INSULIN DEPENDENT – no insulin is made by the pancreas • 5 -10% of total diabetes cases • Genetic predisposition and environmental factors • Autoimmune destruction of insulin-producing beta cells – Also at risk for other autoimmune diseases, such as Graves’, Hashimoto’s, Addison’s, vitiligo, celiac sprue, autoimmune hepatitis, myasthenia gravis, pernicious anemia (ADA, 2010). • Minority do not exhibit autoimmune destruction = idiopathic • 50 -75% of cases diagnosed in childhood or adolescence • 25 -50% diagnosed in adulthood – Latent Autoimmune Disease of Adults (LADA) – Many misdiagnosed as type 2 diabetes (T 2 DM) – For LADA, typically only 1 antibody present (often GADA)
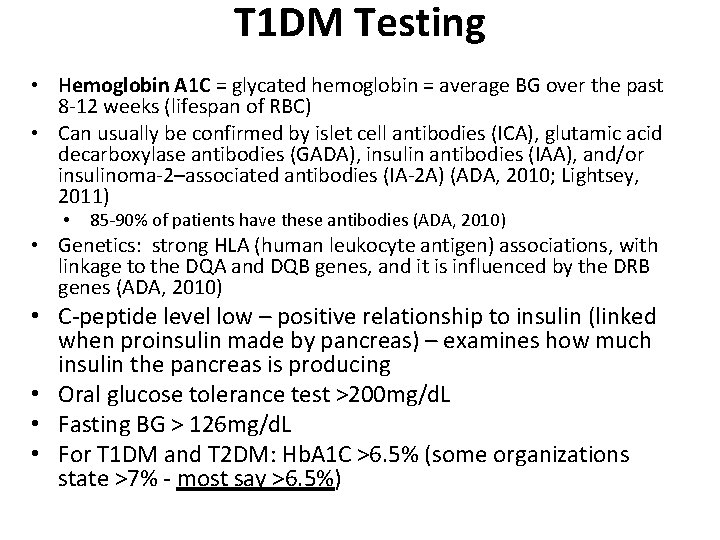
T 1 DM Testing • Hemoglobin A 1 C = glycated hemoglobin = average BG over the past 8 -12 weeks (lifespan of RBC) • Can usually be confirmed by islet cell antibodies (ICA), glutamic acid decarboxylase antibodies (GADA), insulin antibodies (IAA), and/or insulinoma-2–associated antibodies (IA-2 A) (ADA, 2010; Lightsey, 2011) • 85 -90% of patients have these antibodies (ADA, 2010) • Genetics: strong HLA (human leukocyte antigen) associations, with linkage to the DQA and DQB genes, and it is influenced by the DRB genes (ADA, 2010) • C-peptide level low – positive relationship to insulin (linked when proinsulin made by pancreas) – examines how much insulin the pancreas is producing • Oral glucose tolerance test >200 mg/d. L • Fasting BG > 126 mg/d. L • For T 1 DM and T 2 DM: Hb. A 1 C >6. 5% (some organizations state >7% - most say >6. 5%)
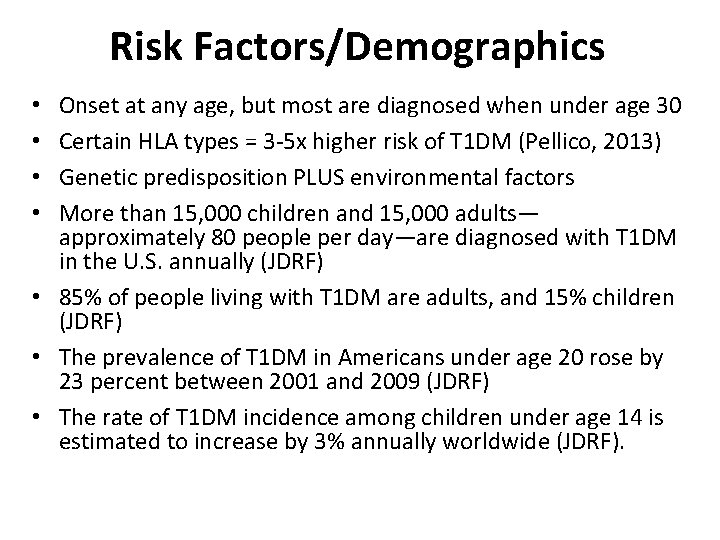
Risk Factors/Demographics Onset at any age, but most are diagnosed when under age 30 Certain HLA types = 3 -5 x higher risk of T 1 DM (Pellico, 2013) Genetic predisposition PLUS environmental factors More than 15, 000 children and 15, 000 adults— approximately 80 people per day—are diagnosed with T 1 DM in the U. S. annually (JDRF) • 85% of people living with T 1 DM are adults, and 15% children (JDRF) • The prevalence of T 1 DM in Americans under age 20 rose by 23 percent between 2001 and 2009 (JDRF) • The rate of T 1 DM incidence among children under age 14 is estimated to increase by 3% annually worldwide (JDRF). • •
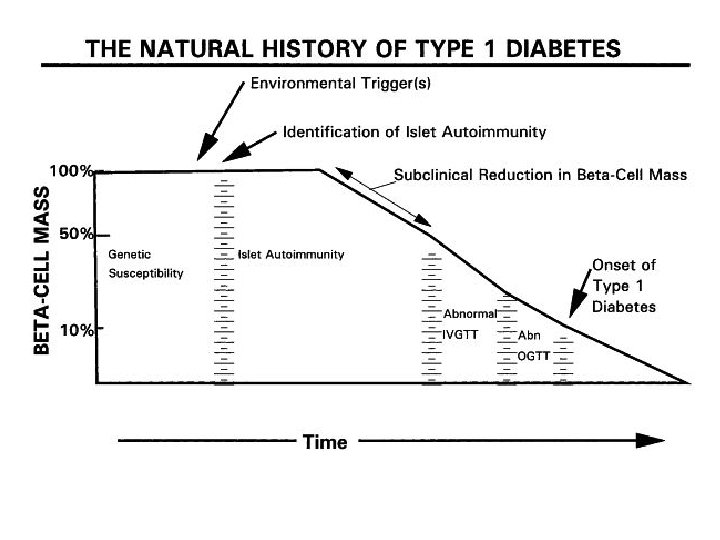
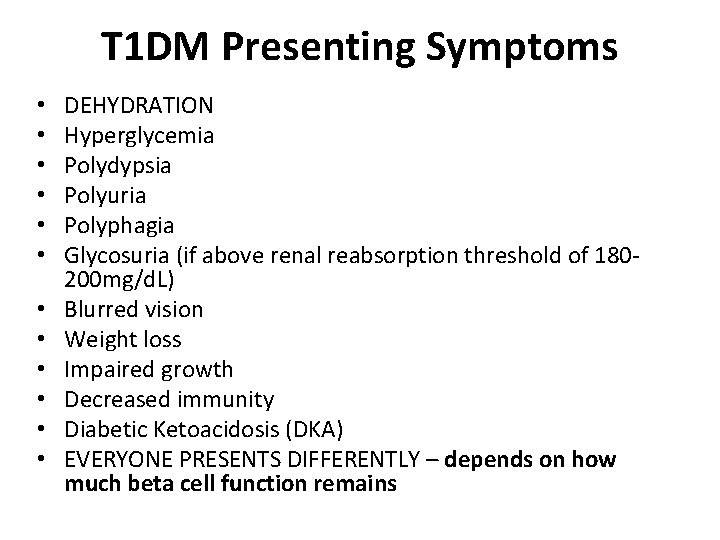
T 1 DM Presenting Symptoms • • • DEHYDRATION Hyperglycemia Polydypsia Polyuria Polyphagia Glycosuria (if above renal reabsorption threshold of 180200 mg/d. L) Blurred vision Weight loss Impaired growth Decreased immunity Diabetic Ketoacidosis (DKA) EVERYONE PRESENTS DIFFERENTLY – depends on how much beta cell function remains
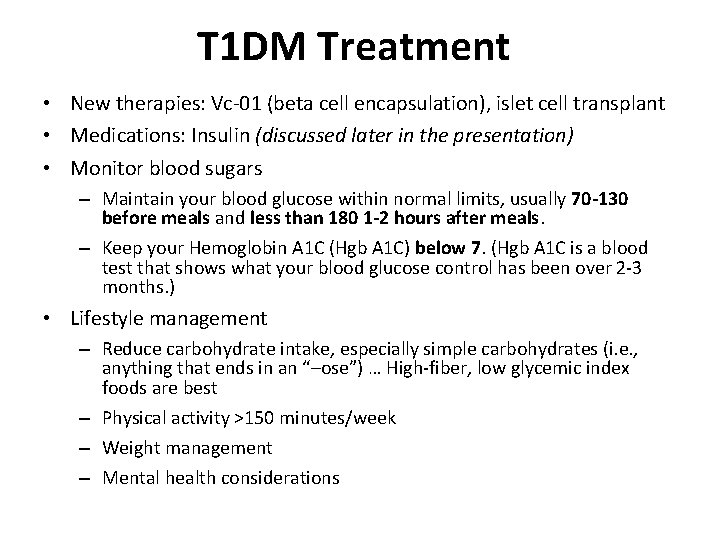
T 1 DM Treatment • New therapies: Vc-01 (beta cell encapsulation), islet cell transplant • Medications: Insulin (discussed later in the presentation) • Monitor blood sugars – Maintain your blood glucose within normal limits, usually 70 -130 before meals and less than 180 1 -2 hours after meals. – Keep your Hemoglobin A 1 C (Hgb A 1 C) below 7. (Hgb A 1 C is a blood test that shows what your blood glucose control has been over 2 -3 months. ) • Lifestyle management – Reduce carbohydrate intake, especially simple carbohydrates (i. e. , anything that ends in an “–ose”) … High-fiber, low glycemic index foods are best – Physical activity >150 minutes/week – Weight management – Mental health considerations

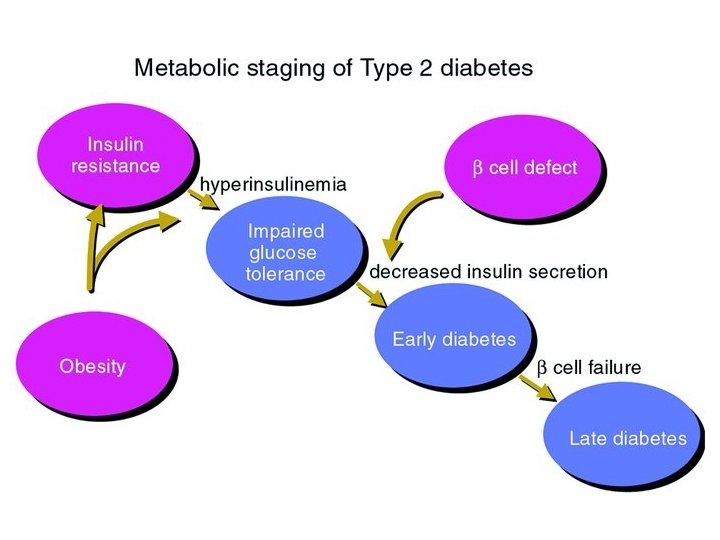
Type 2 Diabetes (T 2 DM) • NON-INSULIN DEPENDENT • Obesity, sedentary lifestyle, aging, genetic predisposition • Increased insulin resistance Relative insulin deficiency (i. e. , insulin supply is less than the demand) – Resistance = “state of reduced responsiveness to normal circulating concentrations of insulin” (Saltiel, 2000). • Pancreas compensates for insulin resistance by producing more insulin (hyperinsulinemia). After a while, the beta cells can no longer compensate, creating glucose intolerance and hyperglycemia. • Hyperglycemia for many years prior to diagnosis = increased risk of micro- and macro-vascular complication development
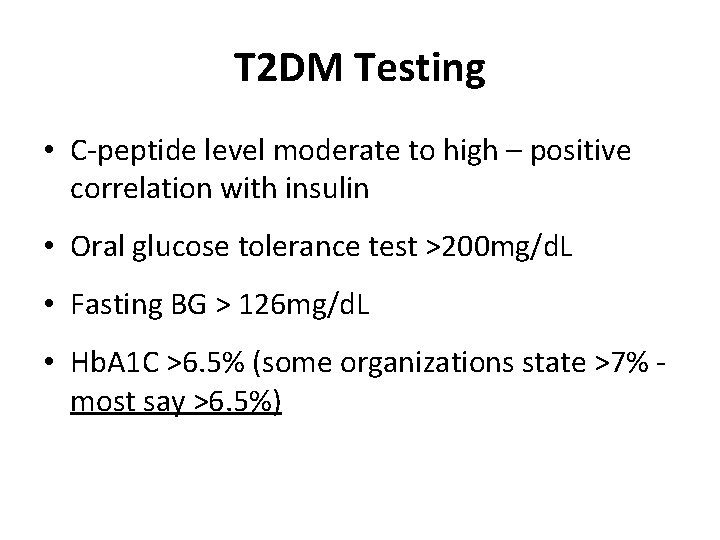
T 2 DM Testing • C-peptide level moderate to high – positive correlation with insulin • Oral glucose tolerance test >200 mg/d. L • Fasting BG > 126 mg/d. L • Hb. A 1 C >6. 5% (some organizations state >7% most say >6. 5%)
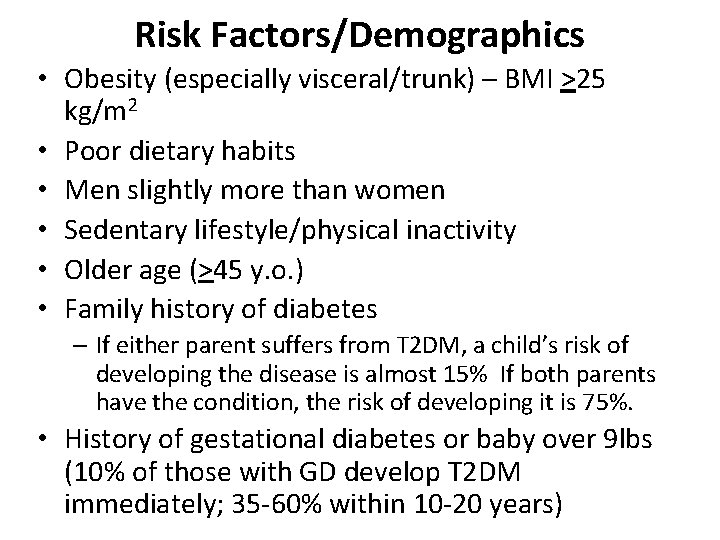
Risk Factors/Demographics • Obesity (especially visceral/trunk) – BMI >25 kg/m 2 • Poor dietary habits • Men slightly more than women • Sedentary lifestyle/physical inactivity • Older age (>45 y. o. ) • Family history of diabetes – If either parent suffers from T 2 DM, a child’s risk of developing the disease is almost 15% If both parents have the condition, the risk of developing it is 75%. • History of gestational diabetes or baby over 9 lbs (10% of those with GD develop T 2 DM immediately; 35 -60% within 10 -20 years)
Risk Factors/Demographics • Impaired glucose metabolism • HDL cholesterol <35 mg/d. L and/or triglyceride level >250 mg/d. L • Insulin resistance and hyperinsulinemia • Race/ethnicity – Increased risk for African Americans, Hispanics/Latinos, American Indians (e. g. , Pima Indians), some Asians, and Native Hawaiians or other Pacific Islanders – Asian Americans have a 9% higher risk of diabetes. Hispanics have a 12. 8% higher risk, and non-Hispanic blacks have a 13. 2% higher risk of diabetes than non. Hispanic white adults in the U. S. – In children and adolescents, diagnosed more frequently among American Indians, African Americans, Hispanics/Latinos, Asians, and Pacific Islanders
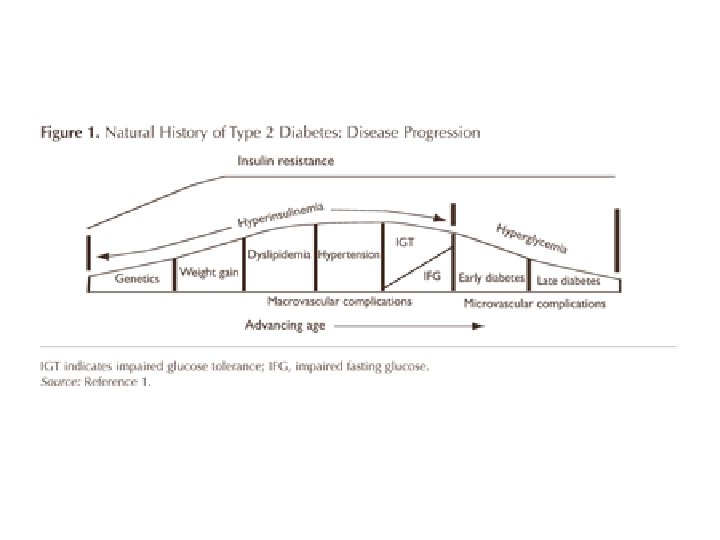

T 2 DM Presenting Symptoms • Slow progression of glucose intolerance, so minimal to no symptoms (usually) • May include – – – – Irritability Fatigue Polydipsia Polyuria Polyphagia (sometimes) Poor wound healing Frequent infections Vision changes
T 2 DM Treatment • Medications: oral agents, then insulin in later stages (we’ll speak more about this later) • Monitor blood sugars – Maintain your blood glucose within normal limits, usually 70130 before meals and less than 180 1 -2 hours after meals. – Keep your Hemoglobin A 1 C (Hgb A 1 C) below 7. (Hgb A 1 C is a blood test that shows what your blood glucose control has been over 2 -3 months. ) • Lifestyle management – Reduce carbohydrate intake, especially simple carbohydrates (i. e. , anything that ends in an “–ose”) … High-fiber, low glycemic index foods are best – Physical activity >150 minutes/week – Weight management – lose 5 -10% of body weight – Mental health considerations
Gestational Diabetes Mellitus (GDM) • A form of glucose intolerance diagnosed during the second or third trimester of pregnancy. • Placental hormones cause hyperglycemia and insulin resistance. • In up to 14% of pregnancies (Pellico, 2013, p. 820). • Usually glucose tolerance testing at 24 -28 weeks, but do earlier if at increased risk. • The risk factors for GDM are similar to those for T 2 DM. • Within 1 year after pregnancy, 5% -10% of women with GDM continue to have high BG levels and are diagnosed as having diabetes, usually T 2 DM. 35 -60% of women with GDM develop T 2 DM in 10 -20 years. • At risk for recurrent GDM with future pregnancies. • Treatment: diet, exercise, insulin • BG goals: – < 95 mg/d. L pre-prandial – < 130 -140 mg/d. L 1 hour post-prandial – < 120 mg/d. L 2 hours post-prandial
Monogenic Diabetes • Two forms: Maturity Onset Diabetes of the Young (MODY) and Neonatal Diabetes Mellitus • 1 -5% of U. S. diabetics have monogenic diabetes, usually MODY • Due to mutations in a single gene – 20 genes have been implicated in the development of monogenic diabetes • May happen spontaneously BUT has strong hereditary component • Management depends on severity of disease • Genetic testing of family members necessary
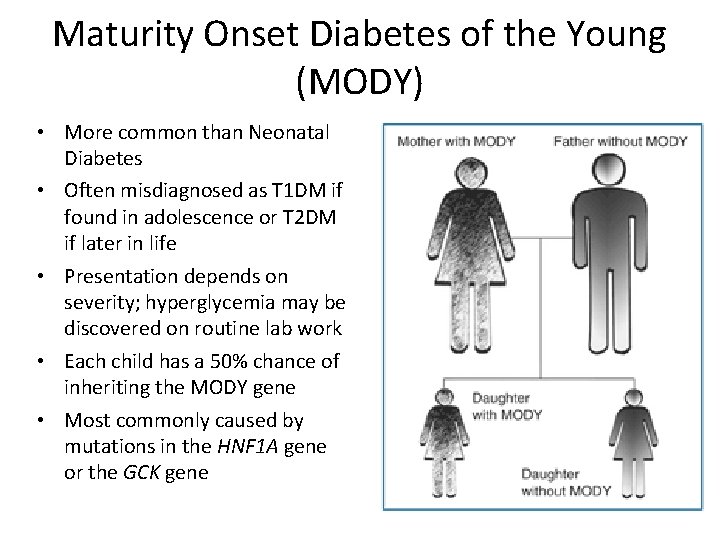
Maturity Onset Diabetes of the Young (MODY) • More common than Neonatal Diabetes • Often misdiagnosed as T 1 DM if found in adolescence or T 2 DM if later in life • Presentation depends on severity; hyperglycemia may be discovered on routine lab work • Each child has a 50% chance of inheriting the MODY gene • Most commonly caused by mutations in the HNF 1 A gene or the GCK gene
Neonatal Diabetes Mellitus – First 6 months of life – Symptoms similar to that of T 1 DM – Most commonly caused by mutations in the KCNJ 11, ABCC 8 o r INS genes – Management same as T 1 DM (need to replace insulin)
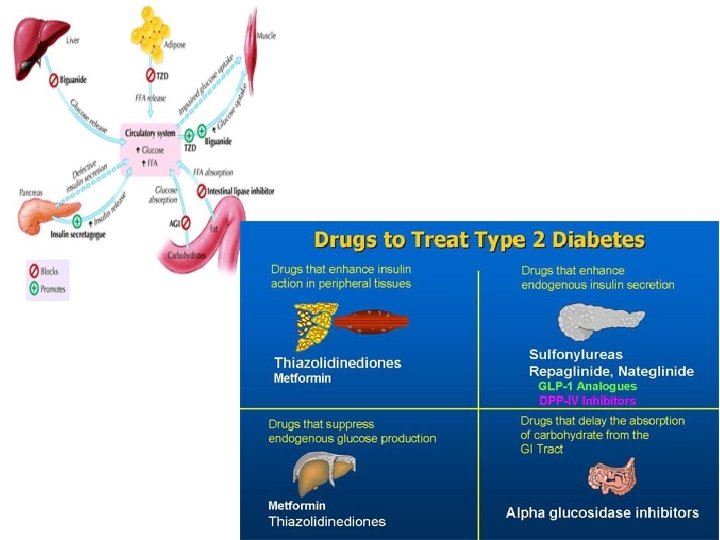
Medications: Oral Agents • Alone, only lower Hb. A 1 c 1 -2% (Faulds, 2014) • Can combine agents with different mechanisms of action (Faulds, 2014) – With combination, can only decrease Hb. A 1 c by 2 -3% (Faulds, 2014) • Insulin Secretagogues: action increases secretion of insulin by the beta cells – Sulfonylureas – Nonsulfonylurea insulin secretagogues (meglitinides and phenylalanine derivatives) • • Biguanides Alpha-glucosidase inhibitors Thiazolidinediones (glitazones) SEE TABLE 30 -6 (pages 836 -7) IN BOOK
Sulfonylureas • Action: directly stimulate the pancreas to secrete insulin, increase insulin effectiveness at cellular level, decrease glucose production by the liver • Lower Hb. A 1 c by 1 -2% (Faulds, 2014) • Must have a functioning pancreas, liver, kidneys • Side effects: hypoglycemia; mild GI; sulfa allergy; weight gain; interact with NSAIDs, warfarin, sulfonamides • Recommend not to take with beta blocker (mask symptoms of hypoglycemia) • No alcohol • Second-generation fewer side effects, drug interactions, excreted by liver and kidneys – Glipizide, glyburide, glimepiride
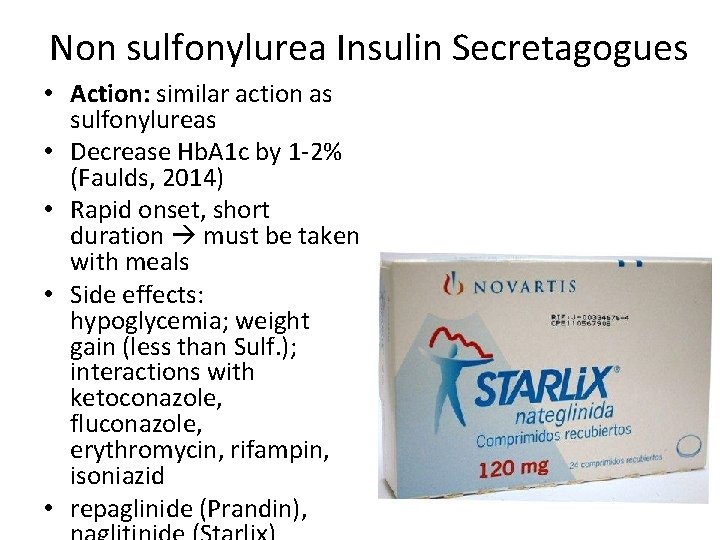
Non sulfonylurea Insulin Secretagogues • Action: similar action as sulfonylureas • Decrease Hb. A 1 c by 1 -2% (Faulds, 2014) • Rapid onset, short duration must be taken with meals • Side effects: hypoglycemia; weight gain (less than Sulf. ); interactions with ketoconazole, fluconazole, erythromycin, rifampin, isoniazid • repaglinide (Prandin),
Biguanides • Action: decreasing hepatic production of glucose, facilitate action of insulin on peripheral receptor sites • Lower Hb. A 1 c 1 -2% (Faulds, 2014) • May be used with Sulf. to further lower BG • Do not use if renal or liver impairment, respiratory insufficiency, infection, alcohol abuse • Side effects: lactic acidosis, GI disruptions, drug interactions • D/c use 2 days prior to contrast administration (renal) • Metformin, metformin with glyburide
Alpha-Glucosidase Inhibitors • Action: delay absorption of complex carbohydrates in intestine, slow entry of glucose into systemic circulation = lower post-prandial BG • Decrease Hb. A 1 c 0. 5 -1% (Faulds, 2014) • Side effects: hypoglycemia, GI side effects, drug interactions • Take with first bite of food • Monitor liver function • Do not use if renal or GI dysfunction, cirrhosis • acarbose (Precose), miglitol (Glyset)
Thiazolidinediones • Action: Sensitize body tissue to insulin, stimulate insulin receptor sites • Decrease Hb. A 1 c 0. 5 -1% (Faulds, 2014) • May be used in combination with other meds • Side effects: hypoglycemia, anemia, weight gain, edema, liver dysfunction, drug interactions, hyperlipidemia, impaired platelet function, decrease effectiveness of oral contraceptives • pioglitazone (Actos), rosiglitazone (Avandia)
DPP-4 Inhibitors/Incretin Enhancers • Action: stimulates release of insulin, prevents secretion of glucagon, slows postprandial gastric emptying • Decrease Hb. A 1 c 0. 5 -1% (Faulds, 2014) • Side effects: may promote weight loss, GI disturbances, hypoglycemia, pancreatitis • Combination with metformin or Sulf. • sitagliptin (Januvia), saxaglipton (Onglyza), exenatide (Byetta)
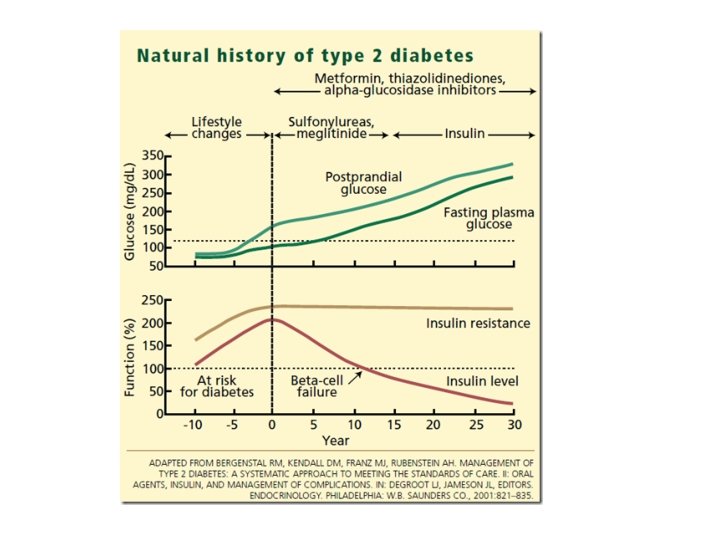
Who gets insulin? (Dungan, 2014) • All T 1 DM • Depending on severity, GDM (pregnancy) • Eventually, most T 2 DM – At the time of diagnosis, approximately 50% of beta cell function is lost – Only a matter of time (average about 10 years) before require insulin • • • Hb. A 1 c > 8% on two oral agents Unable to take oral agents Hb. A 1 c > 10% Symptomatic Other – – Hospitalization Corticosteroid administration Infection Cost
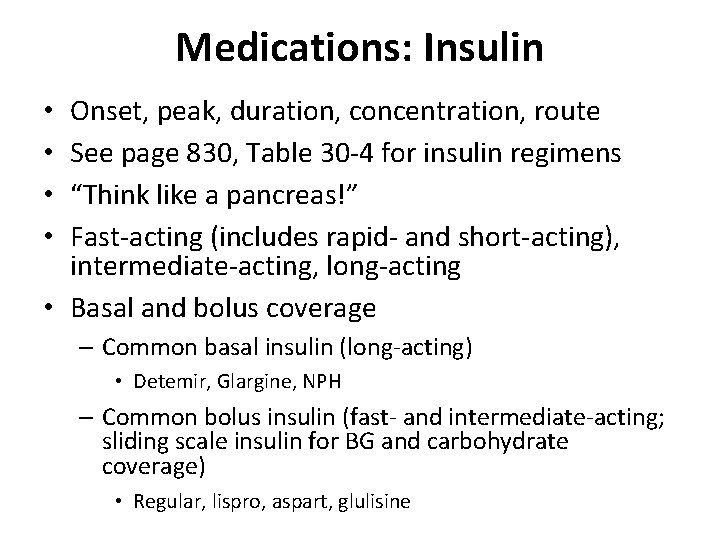
Medications: Insulin Onset, peak, duration, concentration, route See page 830, Table 30 -4 for insulin regimens “Think like a pancreas!” Fast-acting (includes rapid- and short-acting), intermediate-acting, long-acting • Basal and bolus coverage • • – Common basal insulin (long-acting) • Detemir, Glargine, NPH – Common bolus insulin (fast- and intermediate-acting; sliding scale insulin for BG and carbohydrate coverage) • Regular, lispro, aspart, glulisine
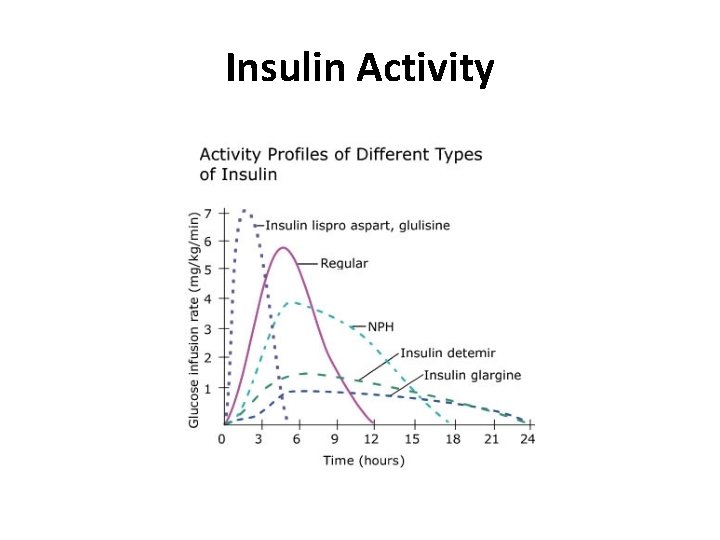
Insulin Activity
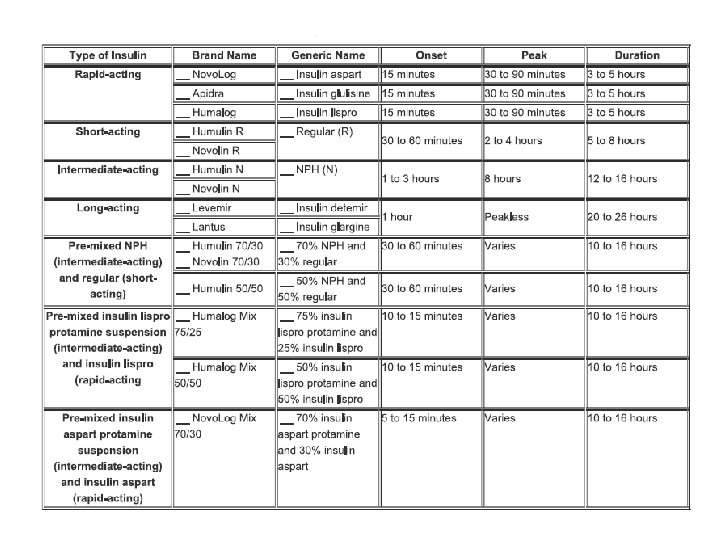
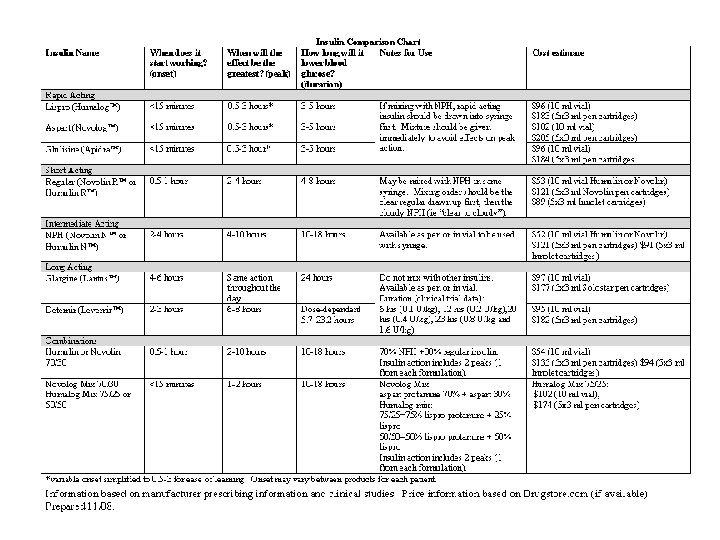
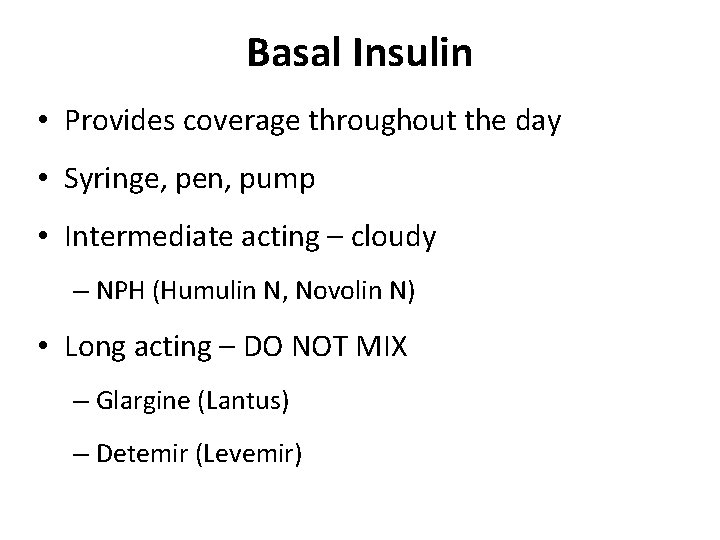
Basal Insulin • Provides coverage throughout the day • Syringe, pen, pump • Intermediate acting – cloudy – NPH (Humulin N, Novolin N) • Long acting – DO NOT MIX – Glargine (Lantus) – Detemir (Levemir)
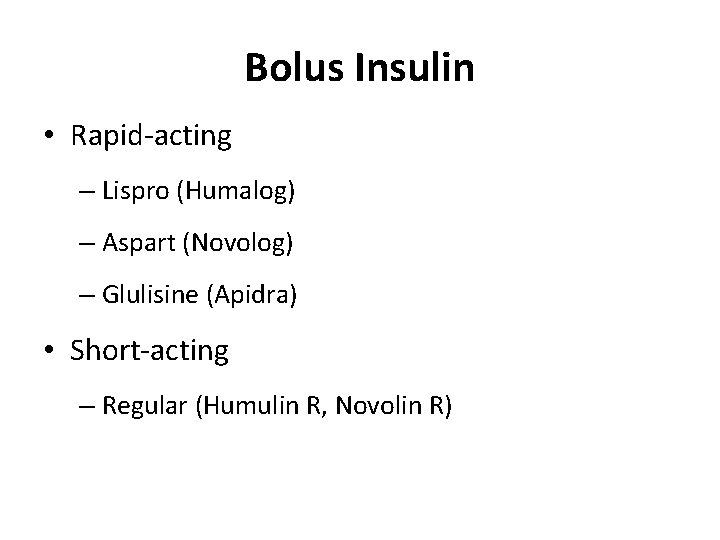
Bolus Insulin • Rapid-acting – Lispro (Humalog) – Aspart (Novolog) – Glulisine (Apidra) • Short-acting – Regular (Humulin R, Novolin R)
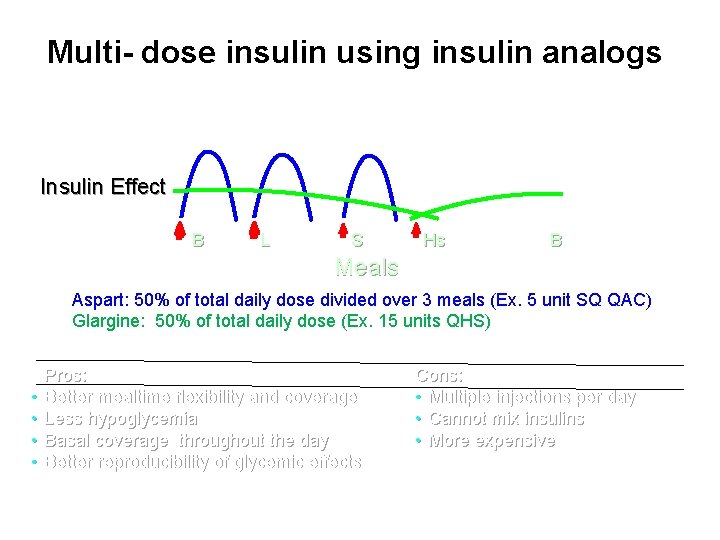
Multi- dose insulin using insulin analogs Insulin Effect B L S Hs B Meals Aspart: 50% of total daily dose divided over 3 meals (Ex. 5 unit SQ QAC) Glargine: 50% of total daily dose (Ex. 15 units QHS) • • Pros: Better mealtime flexibility and coverage Less hypoglycemia Basal coverage throughout the day Better reproducibility of glycemic effects Cons: • Multiple injections per day • Cannot mix insulins • More expensive

Combination Insulin • Novolin 70/30 (Humulin 70/30) – 70% NPH – 30% Regular • Humulin 50/50 – 50% each NPH and Regular • Novolog Mix 70/30 – 70% Aspart protamine suspension – 30% Aspart • Humalog Mix 75/25 – 75% Lispro protamine suspension – 25% Lispro • Humalog Mix 50/50 – 50% each Lispro protamine suspension and Lispro
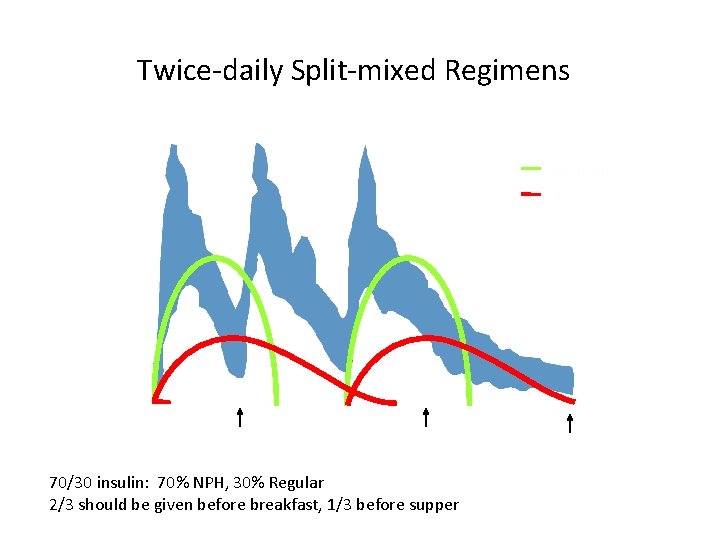
Twice-daily Split-mixed Regimens Insulin Effect Regular NPH B L S HS 70/30 insulin: 70% NPH, 30% Regular 2/3 should be given before breakfast, 1/3 before supper B

Medication calculation • Carbohydrate count – 5 grams of CHO to 1 unit of insulin for tightest control – Can also be 10, 15, or 20 grams CHO: 1 unit • Sliding scale insulin (SSI) for BG – Often 1 unit for every 50 mg/d. L over 150 mg/d. L – Different for every person
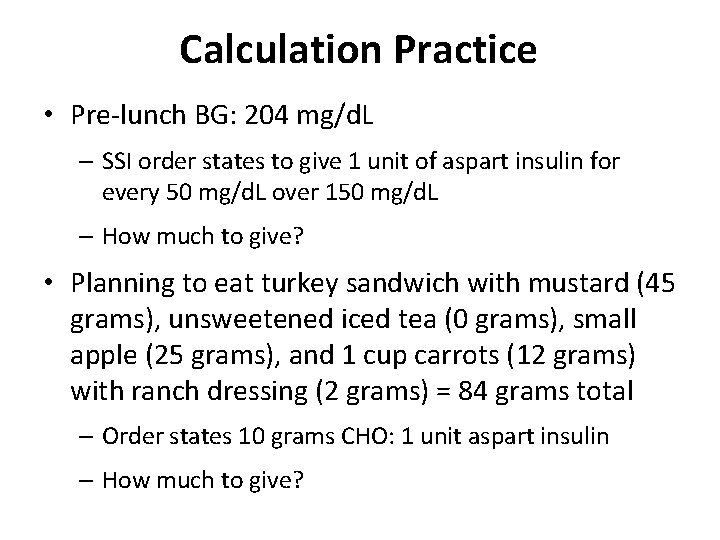
Calculation Practice • Pre-lunch BG: 204 mg/d. L – SSI order states to give 1 unit of aspart insulin for every 50 mg/d. L over 150 mg/d. L – How much to give? • Planning to eat turkey sandwich with mustard (45 grams), unsweetened iced tea (0 grams), small apple (25 grams), and 1 cup carrots (12 grams) with ranch dressing (2 grams) = 84 grams total – Order states 10 grams CHO: 1 unit aspart insulin – How much to give?

Insulin Administration • Store in refrigerator EXCEPT the current vial, which is stored at room temperature (good for 1 month) • Inspect for clarity, precipitate, flocculation (frosted, whitish coating inside bottle) • Check expiration date, opening date • Roll vial between hands (do not shake) • Pen versus syringe/needle • Syringe selection – 1 ml, . 5 ml, . 3 ml – 27 or 29 gauge needle, 0. 5 inches long • May draw up insulin up to 3 weeks early, store with needle in upright position • Subcutaneous sites: posterior arms, anterior thighs, hips, abdomen • Rotate sites to prevent lipodystrophy • See page 832 -3 for instructions
Insulin Administration
Insulin Administration Complications • Insulin resistance • Morning hyperglycemia • Dawn phenomenon: relatively normal BG until 3 am, due to nocturnal surges in growth hormone secretions • Somogyi effect: nocturnal hypoglycemia with rebound hyperglycemia • Insulin waning: progressive increase in BG from bedtime to morning • Local allergic reaction 1 -2 hours after administration • Systemic allergic reaction (hives) – rare • Lipodystrophy – Lipoatrophy: loss of subcutaneous fat, slight dimpling or pitting of subcutaneous fat – Lipohypertrophy: fibrofatty mass, raised and hardened tissue
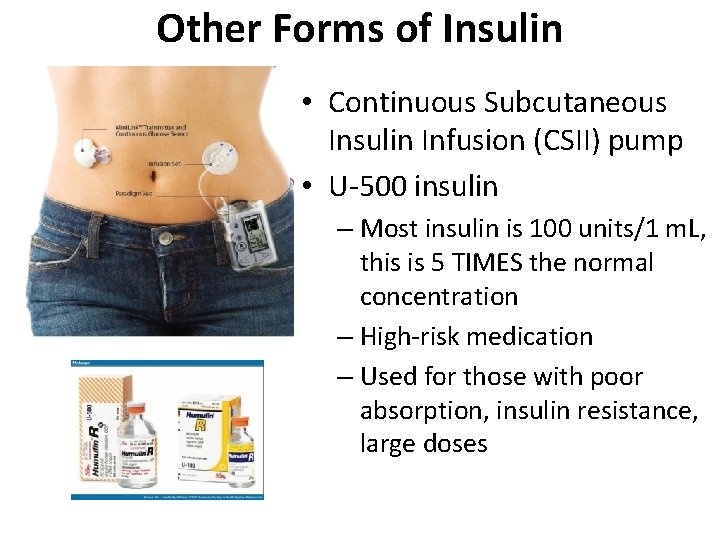
Other Forms of Insulin • Continuous Subcutaneous Insulin Infusion (CSII) pump • U-500 insulin – Most insulin is 100 units/1 m. L, this is 5 TIMES the normal concentration – High-risk medication – Used for those with poor absorption, insulin resistance, large doses
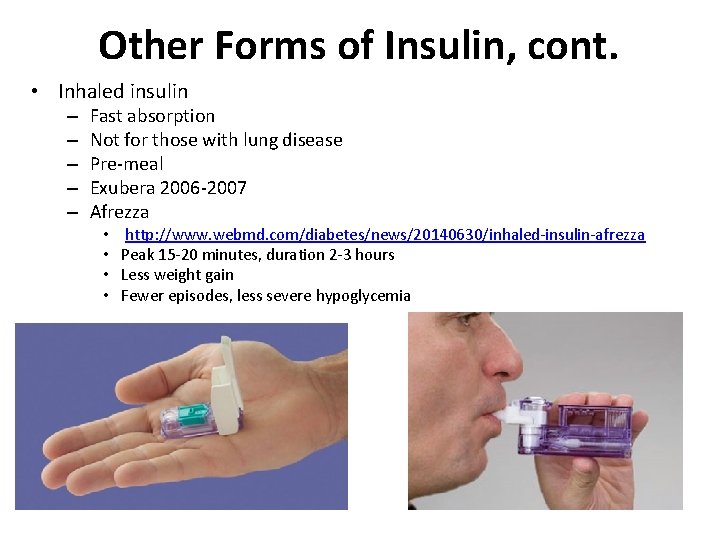
Other Forms of Insulin, cont. • Inhaled insulin – – – Fast absorption Not for those with lung disease Pre-meal Exubera 2006 -2007 Afrezza • • http: //www. webmd. com/diabetes/news/20140630/inhaled-insulin-afrezza Peak 15 -20 minutes, duration 2 -3 hours Less weight gain Fewer episodes, less severe hypoglycemia
Patient Teaching • • • Gerontologic Considerations – page 2 821 -22 (Box 30 -4) Medications Physical activity Nutrition Self-monitoring of blood glucose (SMBG) Care for the following: – – – – Feet Eyes Kidneys Heart/brain Mental health Teeth Also higher risk for fatty liver disease
Gerontologic Considerations • Age-related changes make diabetes management difficult • See Box 30 -4 on page 822
Teaching: Medications
Teaching: Physical Activity • Goal > 150 minutes per week • Weight control, improve insulin utilization, ease stress, CVD risk factor improvement (i. e. , lower lipids, increase HDL, decrease total cholesterol and triglycerides) • Slow, gradual increase • Consistent, daily exercise • For those who take insulin, may need a snack after exercise to avoid hypoglycemia
Teaching: SMBG • T 2 DM who are not on insulin 2 -3 times per week, including a 2 -hour post-prandial, also during medication changes or suspected hyperor hypoglycemia • If on insulin before meals and at bedtime, suspected hyper- or hypoglycemia • Continuous Glucose Monitoring (CGM) • Urine Glucose Testing: renal threshold for glucose is 180 -200 mg/d. L (affected by age and renal function) • Keep a logbook/record – There’s an (well, more than one!) app for that.
Teaching: Nutrition • Consistent carbohydrate and caloric intake, at consistent intervals (especially for those who take insulin) – to prevent hypoglycemia • Personalize care: consider lifestyle, preferences, culture, ethnicity, eating times • Include skills such as reading labels, eating out, adjusting meal plan for special occasions/illness/exercise • Exchange List for Meal Planning – see page 824 -5 and http: //www. nhlbi. nih. gov/health/educational/lose_wt/eat/fd_exch. htm • Create Your Plate: http: //www. diabetes. org/food-andfitness/food/planning-meals/create-your-plate/ • 50 -60% calories from carbohydrates, 20 -30% from fat (cholesterol less than 200 mg/day, saturated fat <7%), 10 -20% from protein • Fiber – Soluble: legumes, oats, fruits (help lower LDL and BG) – Insoluble: whole grains, cereals, vegetables

Create Your Plate
Inpatient Diabetes Management • Usually hyperglycemia, but also hypoglycemia • Typically discontinue oral agents, switch to bolus insulin (lispro and aspart are commonly used at OSUWMC) – why no oral agents? • Acute illnesses = hyperglycemia • Steroid administration • NPO for procedure, etc. • Electrolyte management
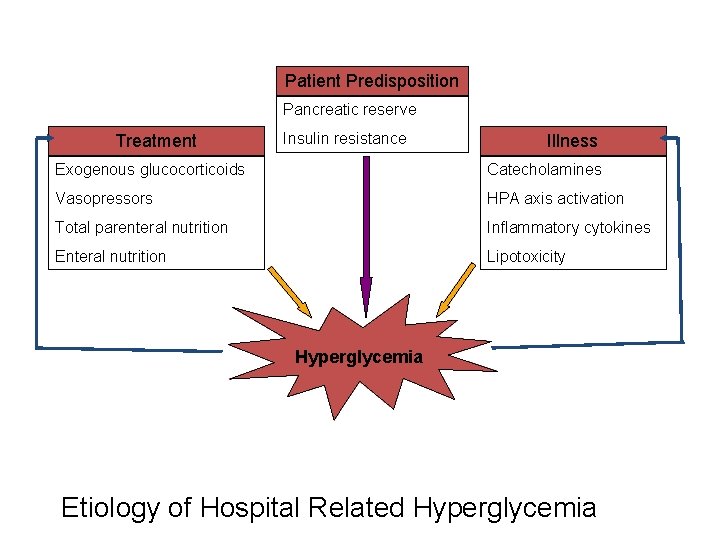
Patient Predisposition Pancreatic reserve Treatment Insulin resistance Illness Exogenous glucocorticoids Catecholamines Vasopressors HPA axis activation Total parenteral nutrition Inflammatory cytokines Enteral nutrition Lipotoxicity Hyperglycemia Etiology of Hospital Related Hyperglycemia
Complications requiring hospitalization: Diabetic Ketoacidosis (DKA) • Caused by lack of insulin • Results in hyperglycemia, ketosis, dehydration, electrolyte loss, acidosis • No insulin = glucose does not enter cells but stays in plasma; liver releases glucose; kidneys attempt to get rid of extra glucose by osmotic diuresis = dehydration and electrolyte loss • Breakdown of fat into free fatty acids and glycerol (see previous slides) converted into ketone bodies by liver metabolic acidosis – ABG: p. H low, bicarbonate low, CO 2 normal – Attempt to correct low p. H and low bicarbonate by “blowing off” CO 2 = Kussmal respirations
DKA Signs/Symptoms • Polyuria • Polydypsia • Diagnostic – – – – p. H 6. 8 -7. 3 BG > 250 mg/d. L Serum bicarbonate low (0 -15 m. Eq/L 0 Serum and urine ketones Glucose in urine Na, K, Cl serum levels abnormal – how? !? Anion gap • Blurred vision (osmotic changes on the lens) • SEE FIGURE 30 -7 on page 842 • Osmotic diuresis Water and electrolyte loss dehydration circulatory failure • Metabolic acidosis CNS depression coma
DKA Management • Correct dehydration, electrolyte loss, acidosis – 6 -10 L of IV fluids! (But not too quickly, due to risk for cerebral edema. ) Start with NS, then to dextrose-containing fluids when BG < 250 mg/d. L. – Frequent VS monitoring – respiratory, cardiac, neurological, intake/output balance. Ensure your patient is not fluid overloaded! – K and Cl replacement – most important to monitor K levels q 2 -4 h – WHY DOES K SHIFT IN/OUT OF CELLS? ! – Acidosis reversed by insulin administration • • Insulin gtt Do not lower BG too quickly! Hourly BG checks Dextrose when BG < 250 mg/d. L • See OSUWMC policy: https: //onesource. osumc. edu/sites/ebm/Documents/Guidelines/T ype 1 Diabetes. pdf
Complications requiring hospitalization: Hyperglycemic Hyperosmolar (non-ketotic acidosis) Syndrome • How is it different than DKA? NO KETOSIS OR ACIDOSIS (insulin is still present) • Mortality rate 10 -40% • Hyperosmolality (> 340 m. Osm/L) and hyperglycemia (> 600 mg/d. L) with minimal or no ketosis • Older, 50 -70 y. o. , with or without T 2 DM • Precipitating events: infection, acute or chronic illness, procedures such as dialysis or surgery, medications
HHNS Signs/Symptoms • • Hypotension Dehydration (more than DKA) Tachycardia Neurologic signs due to cerebral dehydration from hyperosmolality – Sensory alterations – Seizures – Hemiparesis
HHNS Management • Same as DKA, minus anion gap monitoring • Be very careful of fluid status (older patients)! • See OSUWMC policy: https: //onesource. osumc. edu/sites/ebm/Doc uments/Guidelines/Type 2 Diabetes. pdf
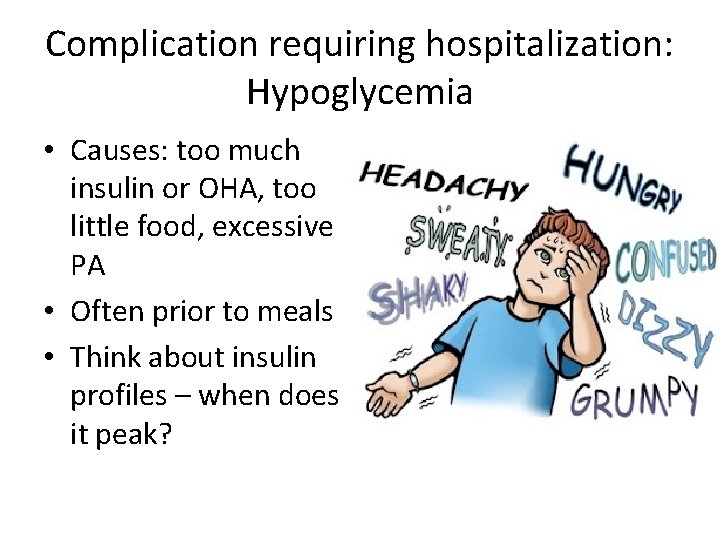
Complication requiring hospitalization: Hypoglycemia • Causes: too much insulin or OHA, too little food, excessive PA • Often prior to meals • Think about insulin profiles – when does it peak?
Hypoglycemia: Symptoms • DIFFERENT FOR EVERY PERSON • Autonomic Nervous System (ANS) (onset) – Epinephrine, Norepinephrine released – Sweating, tremor, tachycardia, palpitations, anxiety, hunger • Central Nervous System (CNS) (intermediate) – Brain cells do not have fuel – Impaired concentration, headache, lightheaded, dizzy, confusion, forgetful, numb lips/tongue, slurred speech, impaired coordination, labile emotions, irrational or combative behavior, double vision, drowsiness • CNS (severe) – Disoriented, seizures, somnolence, LOC
Hypoglycemia: Management • IF ABLE TO SWALLOW SAFELY, Give CHO – 15 grams of fast-acting carbohydrate PO • • 3 -4 glucose tablets 4 -6 oz fruit juice or soda (non-diet) 6 -10 hard candies 2 -3 TBL sugar/honey – Retest BG within 15 minutes; retreat if less than 075 mg/d. L – Plus snack with protein and starch within 30 -60 minutes (once symptoms resolve)
Hypoglycemia: Management • Glucagon 1 mg SQ or IM • 25 -50 m. L (12. 5 -25 g) of 50% D 50 W via IVP at 10 m. L/min • Be sure to evaluate if patient has insight to hypoglycemia, re-evaluate BG 15 minutes after intervention • See OSUWMC policy for hypoglycemia management: https: //onesource. osumc. edu/sites/diabetes/Doc uments/Hypoglycemia. pdf

Have a great day! • http: //whatshouldwecallnursing. tumblr. com/ • http: //whatshouldwecallnursingschool. tumblr. com/ • Have a wonderful semester!!!!!
References American Association of Diabetes Educators (AADE). (2014). Diabetes Tip Sheets. Retrieved May 27, 2014, from http: //www. diabeteseducator. org/Diabetes. Education/PWD_Web_Pages/Holiday_Eating_Patient_Resources. html. American Diabetes Association (ADA). (2013, March 6). American Diabetes Association Releases New Research Estimating Annual Cost of Diabetes at $245 billion. Retrieved December 1, 2013, from http: //www. diabetes. org/for-media/2013/annual-costs-of-diabetes 2013. html? loc=cost-of-diabetes. American Diabetes Association (ADA). (2010). Diagnosis and classification of diabetes mellitus. Diabetes Care, 33(S 1). American Diabetes Association (ADA). (2012). Standards of medical care in diabetes. Diabetes Care, 35(S 1), S 12, table 2. Retrieved October 14, 2014 from http: //diabetes. niddk. nih. gov/dm/pubs/diagnosis/. American Heart Association (AHA). (2014). About metabolic syndrome. American Heart Association. Retrieved October 14, 2014, from http: //www. heart. org/HEARTORG/Conditions/More/Metabolic. Syndrome/About-Metabolic-Syndrome_UCM_301920_Article. jsp. Aljasem, L. I. , Peyrot, M. , Wissow, L. , & Rubin, R. R. (2001). The impact of barriers and self-efficacy on self-care behaviors in type 2 diabetes. Diabetes Educator, 27(3). Atak, N. , Gurkan, T. , & Kose, K. (2008). The effect of education on knowledge, self-management behaviors, and self-efficacy of patients with type 2 diabetes. Australian Journal of Advanced Nursing, 26(2), 66. Atkinson, M. A. (2012). The pathogenesis and natural history of type 1 diabetes. Cold Spring Harbor Perspectives in Medicine. Centers for Disease Control and Prevention (CDC). (2014). National Diabetes Statistics Report: Estimates of Diabetes and Its Burden in the United States, 2014. Atlanta, GA: U. S. Department of Health and Human Services. Center for Disease Control and Prevention (CDC). (2014). Prediabetes. Diabetes Public Health Resource. Retrieved October 14, 2014, from http: //www. cdc. gov/diabetes/consumer/prediabetes. htm. Chen, C-P. , Peng, Y-S. , Weng, H-H. , Yen, H-Y. , & Chen, M-Y. (2013). Health-promoting behavior is positively associated with diabetic control among type 2 diabetes patients. Open Journal of Nursing, 3, 274. Diabetes Control and Complications Trial Research Group (DCCT). (1993). The effect of intensive treatment of diabetes on the development and progression of long term complications in insulin-dependent diabetes mellitus. New England Journal of Medicine, 329, 977– 986. Dungan, K. (2014). Insulin in Inpatients and Outpatients [Powerpoint slides]. Presentation, May 2014. JDRF. (n. d. ). Type 1 Diabetes Facts. Retrieved October 15, 2014, from http: //jdrf. org/about-jdrf/fact-sheets/type-1 -diabetes-facts/. Faulds, E. R. (2014). Pharmacological Management of Type 2 Diabetes: Oral Medications and Noninsulin Injectables [Powerpoint slides]. Nursing 6111, May 2014.
References King, D. K. , Glasgow, R. E. , Toobert, D. J. , Strycker, L. A. , Estabrooks, P. A. , Osuna, D. , & Faber, A. J. (2010). Self-efficacy, problem solving, and social-environmental support are associated with diabetes self-management behaviors. Diabetes Care, 33, 751 -753. King, P. , Peacock, P. , & Donnelly, R. (1999). The UK Prospective Diabetes Study (UKPDS): Clinical and therapeutic implications for type 2 diabetes. British Journal of Clinical Pharmacology, 48(5), 643 -648. Lightsey, R. (2011). Diagnosis and treatment of latent autoimmune diabetes in adults still evolving. Clinical. Advisor. Retrieved October 13, 2014, from http: //www. clinicaladvisor. com/diagnosis-and-treatment-of-latent-autoimmune-diabetes-in-adults-stillevolving/article/203578/. Longhurst, A. S. (2014). Type 2 Diabetes Statistics and Facts. Retrieved October 15, 2014, from http: //www. healthline. com/health/type-2 diabetes/statistics#1. Mercola, J. (2014). Sugar Consumption Accounts for a Big Chunk of Health Care Costs. Retrieved May 27, 2014, from http: //articles. mercola. com/sites/articles/archive/2014/03/29/sugar-consumption-healthcare-costs. aspx. National Institute of Diabetes, Digestive and Kidney Diseases (NIDDK). (2007). Monogenic forms of diabetes: Neonatal diabetes mellitus and maturity-onset diabetes of the young (NIH Publication No. 07 -6141). Bethesda, MD: National Diabetes Information Clearinghouse. National Institute of Diabetes, Digestive, and Kidney Diseases (NIDDK). (2011). National Diabetes Statistics, 2011. Retrieved from May 27, 2014, from http: //diabetes. niddk. nih. gov/dm/pubs/statistics/#fast. Nordlie, R. C. , Foster, J. D. , & Lange, A. J. (1999). Regulation of glucose production by the liver. Annual Review of Nutrition, 19, 379 -406. Osborn, C. Y. , Bains, S. S. , & Egede, LE. (2010). Health literacy, diabetes self-care, and glycemic control in adults with type 2 diabetes. Diabetes Technology & Therapeutics, 12(11), 913. Pellico, L. H. (2013). Focus on Adult Health Medical Surgical Nursing. Lippincott Williams & Wilkins: Philadelphia, PA. Pessin, J. E. , & Saltiel, A. R. (2000). Signaling pathways in insulin action: Molecular targets of insulin resistance. The Journal of Clinical Investigation, 106(2), 165 -169. Saltiel, A. R. (2000). Series Introduction: The molecular and physiological basis of insulin resistance: Emerging implications for metabolic and cardiovascular diseases. Journal of Clinical Investigation, 106(2), 163 -164. doi: 10. 1172/JCI 10533. Stratton, I. M. , Adler, A. I. , Andrew, H. , Neil, W. , Matthews, D. R. , Manley, S. E. , Cull, C. A. , Hadden, D. , Turner, R. C. , Holman, R. R. (on behalf of the U. K. Prospective Diabetes Study Group). (2000). Association of glycemia with macrovascular and microvascular complications of type 2 diabetes (UKPDS 35): Prospective observational study. British Medical Journal, 321, 405– 412. University of California San Francisco (UCSF). (2014). The liver and blood sugar. Diabetes Education Online. Retrieved October 14, 2014 from http: //dtc. ucsf. edu/types-of-diabetes/type 2/understanding-type-2 -diabetes/how-the-body-processes-sugar/the-liver-blood-sugar/. United States Department of Agriculture (USDA). (n. d. ). Choose. My. Plate. gov. Retrieved from May 27, 2014, from http: //www. choosemyplate. gov/.
- Slides: 125