aka msdownload WPT aka msdownload WPT Get started


 Description This summary table breaks down the CPU costs into several")
 Description This summary table shows overall CPU Usage, based on context")
 Description This graph provides a third view of CPU usage in")


 Problem: If other things are running on")


 HTML/XAML Problem: While we recommend offloading work from")


")


 Use this sample code to easily set up")

 HTML/XAML Problem: It is important for both animations")
 HTML/XAML Glitches can be caused by a lack")
 HTML apps can make use of")
- Slides: 67
§ § § § aka. ms/download. WPT
§ aka. ms/download. WPT § §
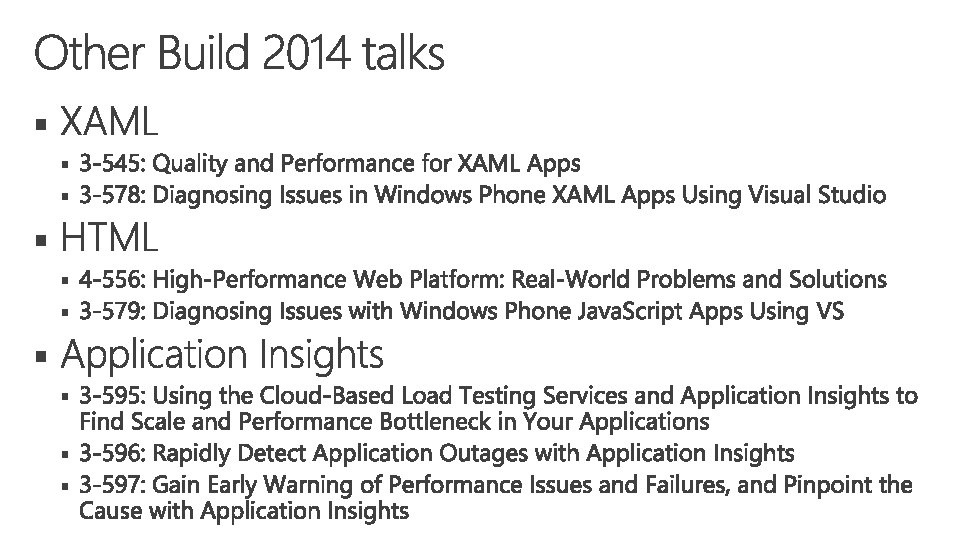
§ § § Get started with WPA Introduction to App Analysis Capabilities Big Picture Tab Frame Analysis Tab § § Performance fundamentals § XAML and content virtualization § Diagnosing overdraw – XAML
§ § Planning costs less than rearchitecting § From UX to APIs for 5 key scenarios § The Mental Model for Interacting with the Platform § § The Windows Performance Toolkit § § § XAML performance fundamentals § Web runtime performance
CPU Usage (Attributed) Description This summary table breaks down the CPU costs into several categories that are important for analysis. Key Info The Thread Activity Tag column aggregates costs into several defined categories. There are several preset views available (shown on the right) that allow you to filter the data to specific types of threads. We will typically use the UI Thread preset views for our analysis. Default Location: Frame Analysis tab 16
CPU Usage (Precise) Description This summary table shows overall CPU Usage, based on context switch events. Key Info You can use this summary table to understand, at a high level, what processes are running on your system. You can also expand each Process to see its component threads. Default Location: Big Picture tab 17
CPU Usage (Sampled) Description This graph provides a third view of CPU usage in your system based on CPU samples. Key Information This summary table is especially useful for understanding what code is running at any given time. To do this, you’ll first need to load symbols (Trace -> Load Symbols) Zoom into a region that you are interested in (CPU samples are typically collected every millisecond, so zoom in close) and expand the Stack column for your app. Default Location: Big Picture tab 18
Disk Usage Description The Disk Usage graph shows disk activity on your system. Key Info For our analysis, we will typically use this in its graph view, to correlate disk activity with delays in our app. There are numerous preset views that help you to dig in to the different types of disk I/O and utilization in your system. Default Location: Big Picture tab 19
DWM Frame Details Description This summary table presents information about the DWM (Desktop Window Manager) Key Info There are several default graph views that show different information related to the DWM frame rate (one way to measure smoothness) DWM Frame E 2 E – This graph plots a timeline of time spent per frame (from the start of the associated CPU work until the frame is flipped to the screen) DWM Frame GPU – This graph plots a timeline of GPU time spent per frame DWM Frame Rate – This graph plots the actual frame rate, to easily see when an app glitches and drops from the ideal 60 FPS Default Location: Frame Analysis tab Video - Frame Analysis Tab (part I) 20
File I/O Description The File I/O graph shows disk activity on your system with a per-file granularity. Key Info To populate this graph with data, you must enable the “File I/O activity” profile when you collect your trace. Note: Only enable this profile if you require File I/O data. This is a very verbose provider and can affect the performance of your app while tracing. This graph allows you to see exactly which files were requested by your app (See the File Name column) and what type of File operation it used. Default Location: Graph Explorer -> Storage 21
Generic Events Description This summary table presents all events that were collected in your trace. Key Info We have provided several filters to make these events more useful and easy to understand: Touch Events – shows marks for each type of touch event and highlights when they were generated with red lines ms. Write. Profiler. Mark – shows markers for each of the events that ms. Write. Profiler. Mark logs VSync-DWMFrame – marks the VSync events during screen updates with red lines Default Location: Trace Markers tab 22
HTML/XAML Frame Details Description This summary table presents information similar to the DWM Frame Details summary table, with a focus on the HTML/XAML platform. Key Info There are several default graph views that plot different aspects of the data: HTML/XAML Frame Visuals Composition – plots a timeline of the work the DWM performed on this frame (from when the app handed it off until it was flipped to the screen) HTML/XAML Frame E 2 E – plots a timeline of the total time spent per frame HTML/XAML Frame GPU – plots a timeline of GPU time spent per frame HTML/XAML Frame Work Breakdown – This summary table shows what UI elements contributed to work each frame, to help pinpoint optimization opportunities Default Location: Frame Analysis tab Video - Frame Analysis Tab (part II) 23
Window in Focus Description The Window in Focus graph simply shows which process has the current UI focus or is in the foreground of your system. Key Info This graph breaks down focus by process and thread. This graph should be used to locate your launch span, based on which thread of explorer. exe is in focus (since explorer. exe owns the system splash screen, the start of your launch scenario) Default Location: Big Picture tab 24
Win. INet Description The Win. INet summary table and graph show what network requests were made on your system. Key Information This graph helps to identify what network requests your app makes or is blocked by. If your app’s UI thread CPU usage dips, only to return after a network request completes, it was probably blocked by the network request. Default Location: Graph Explorer -> Other 25
§ aka. ms/download. WPT § § § § §
§ § § § Get started with WPA
Verifying a Good Trace Eliminate interference and other factors that affect the repeatability of your trace analysis
Bad Trace #1: CPU Interference (Other Processes) Problem: If other things are running on the system when you took your trace, they may be affecting your app’s performance. You may want to re-collect your trace if this happened. Identify the Problem: Check in the Big Picture tab – CPU Usage (Precise) summary table to see what processes are using CPU time. If other processes are taking CPU during your scenario, you should try to recapture the trace (there is little you can do from within your app) HTML/XAML “Your app” is shown in Red. Internet Explorer (Orange) and a second app (Green) are causing interference Solution Capture a trace on a clean, quiet system, to reduce interference. Note: explorer. exe, dwm. exe, Runtime. Broker. exe, and System may show up throughout your trace – these are typically ok. 32
HTML/XAML Bad Trace #2: Disk I/O Problem: Disk response times can vary greatly and can affect the repeatability of your trace capture. Identify the Problem: To find time spent waiting for Disk I/O, copy the Frame Analysis - CPU Usage (Attributed) table to the Big Picture tab. Correlate it with the Big Picture - Disk Usage summary table Find time when your app is not using 100% CPU of its UI thread. If these dips in CPU utilization occur during disk activity, you are probably waiting on disk I/O. Solution “Warm up” your app scenarios before capturing traces for analysis. We recommend launching your app and exercising the scenario to be analyzed at least once before capturing a trace. 33
Bad Trace #2: Disk I/O - Further Details HTML/XAML While the previous slide focused on reducing variability in your trace for the purposes of this workshop, Disk I/O can also be indicative of performance issues. Problem: The “real world” performance of your app can heavily depend on Disk I/O, since your app will often be “cold”. Also, even after being “warmed, ” your scenario may still be disk-bound if you require lots of resources stored on disk. Solution Reduce the amount of data you must read from disk to reach your responsive UI. Page #15 has more details about using the File I/O graph to see which resources you use 34
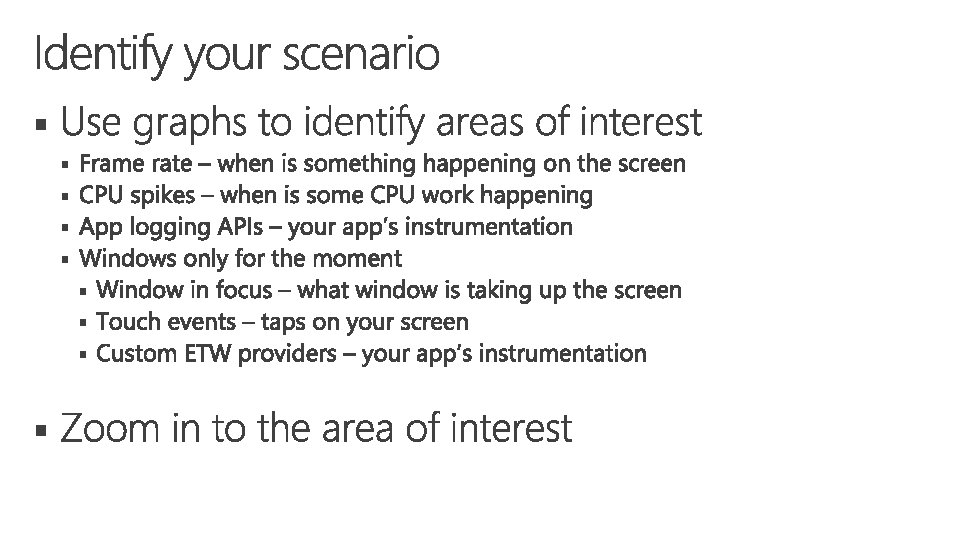
Identify Your Scenario in Your Trace 35
Launch Analysis
This Section Will Cover… 1. How to find your app’s launch within the trace 2. How to identify if common problems in app launch are impacting your app 3. Best practices for resolving these common problems All the issues that can affect page navigation can affect your launch – Go to the Page Navigation section for more analysis tips This section will not cover: 1. Analyzing animation frame rate problems (See the Animations section) 2. Analyzing panning frame rate and item realization problems (See the Panning section) 41
Locate your Launch Span in the Big Picture tab Your splash screen is shown when the Window in Focus graph shows explorer. exe switching threads to the system splash screen (First Box). You can consider launch complete when the DWM Frame Rate graph reaches a relatively steady idle state. This means you aren’t drawing new content to the screen anymore. If you do not use an extended splash screen, this should be immediately after your system splash screen (the green line) ends. If you do use an extended splash screen, the DWM should deliver a high frame rate while the extended splash screen is shown. When it is torn down, the frame rate will drop to idle (Second Box). 42
Investigation #1: CPU Interference (Background Threads) HTML/XAML Problem: While we recommend offloading work from your UI thread to background threads, this alone may not improve your app’s performance. Your UI thread may lose CPU time while waiting for background work to complete. Identify the Problem: Check in the Big Picture tab – CPU Usage (Precise) summary table to see what threads are using CPU time. Identify your UI thread using the CPU Usage (Attributed) summary table (see the Blue Boxes) If other threads of your app are taking significant CPU, you should investigate what work on background threads is running and if it can be deferred Solution Defer or de-prioritize work on background threads 43
HTML/XAML I-2: Network I/O Problem: Network connections can vary in signal strength and speed. Your app’s launch to a responsive UI should not be blocked by network I/O. Identify the Problem: To find time spent waiting for Network I/O correlate the Frame Analysis – Activity CPU summary table with the Win. INet Details summary table Find time when your app is not using 100% CPU of its UI thread. If these dips in CPU utilization end when a download ends, you are probably waiting for network I/O. Solution Design your app so that you can reach a responsive UI without network I/O 44
HTML/XAML I-5: Too Many Resources Problem: There is a per-file loading cost for each resource file you load (CSS and JS files for HTML apps, XAML code for XAML apps) Identify the Problem: Use the Frame Analysis - CPU Usage (Attributed) table to identify what your UI thread is working on. Time spent fetching code files appears in the summary table under: [Root]/Trident/Parsing/<Pre or Post> (HTML apps) [Root]/Xaml. UI/Parse (XAML apps) If you enabled File I/O activity in your trace, you can use the File I/O summary table to find which files are fetched. js files will not be called out in the File I/O table HTML apps - Most often these files are linked in your start page <head> tag. Solution HTML apps - When packaging the app, consolidate your JS and CSS into as few files as possible. XAML apps - Reduce the # of templates you use Though fewer files are better, be careful not to over-consolidate. For more details, see this MSDN page. 45
HTML/XAML I-6: Too Much Code Problem: It is easy to include all of your app code upfront at launch, but this will increase the time needed to launch your app. Identify the Problem: This time will appear in the Frame Analysis - CPU Usage (Attributed) summary table, in the following categories: HTML Code: CSS XAML Code: [Root]/Xaml. UI/Parse [Root]/Trident/Parsing/CSS Java. Script [Root]/JScript/ If there is a large amount of time in these categories, you should consider reducing the amount of code you include at launch. Solution You should only include the code that is needed for the launch scenario in your start page. Defer load everything else. For more details, see this MSDN page. 46
I-7: Non-Packaged Java. Script HTML/XAML Problem: If your app heavily uses web content on responsiveness critical paths, a large portion of time could be going towards script parsing and bytecode generation. Identify the Problem: This time will appear in the Frame Analysis – CPU Usage (Attributed) summary table, in the following categories: [Root]/Jscript/Parse. Source [Root]/Jscript/Byte. Code. Gen If you encounter large amounts of CPU in these two categories, examine if you are leveraging bytecode caching and strongly consider design changes. Solution Redesign/refactor your app so that a majority of your script can be in-package. Follow the best practices at http: //msdn. microsoft. com/enus/library/windows/apps/hh 849088. aspx 47
I-13: Animations for Hidden UI HTML/XAML Problem: Animating items that are offscreen or covered up by a splash screen can waste valuable CPU time. Identify the Problem: Use the Generic Events summary table to determine if you have any animations: Pivot by “Provider Name” and then “Task Name” columns. For HTML apps, expand the “Microsoft-IE” provider and look for “Mshtml_Animations_Animating” and “Mshtml_Animations_Transitioning” tasks. For XAML apps, expand the “Microsoft-XAML” provider and look for “Animation” and “[Begin/End/Stop]Storyboard” tasks If you have animations, there will be events under these tasks. Solution Turn off animations while under a splash screen and for all hidden UI elements 48
Page Navigation Analysis The app launch scenario contains a page navigation – many of the investigations for page navigation can also help your launch.
Locate your Page Navigation Span in the Frame Analysis tab Add the Trace Markers - Touch Events summary table to your Frame Analysis tab In general, your page navigation will start with the user’s touch event (First Box) The page navigation is probably done (in a responsive state) when your DWM Frame Rate reaches a steady state (Second Box). 50
I-8: Expensive Layout Work HTML/XAML Problem: If you have a complex UI, the process of laying out all of its elements can take a long time. Identify the Problem: Layouts can be identified in the Frame Analysis – CPU Usage (Attributed) by these thread activity tags: [Root]/Trident/Layout (HTML app) [Root]/Xaml. UI/Frame/Layout (XAML app) [Root]/Xaml. UI/Frame/Arrange (XAML app) Expensive layouts can result from a large UI (too many elements) or a complex one (expensive types of elements) Solution Check your UI – try to reduce the number of elements you use and avoid expensive elements & patterns (such as nesting Flexboxes inside each other) 51
I-9: Expensive Format Work HTML/XAML Problem: Like your layout work, formatting work is a direct result of the styles and formatting applied to your DOM elements. Identify the Problem: Formats can be identified in the Frame Analysis – CPU Usage (Attributed) by the thread activity tag: [Root]/Trident/Format Expensive formats can result from a large set of styles (too many CSS rules) or other bad patterns (expensive types of rules & selectors) Solution Reduce the number of your rules and avoid bad patterns, such as using “*” in your CSS selectors. You can use the HTML Frames summary table to examine which DOM elements are being formatted (check the Disp. Node. Desc column to see HTML tags, classes, and IDs) 52
I-10: Unnecessary Code Execution HTML/XAML Problem: Your app may be executing more code than is necessary to reach a responsive state. Identify the Problem: This time will appear in the Frame Analysis – CPU Usage (Attributed) summary table, in the following thread activity tags: [Root]/JScript/OM (HTML App) XAML UI (XAML App) If you are spending a long time executing code, you should examine what work is on this critical path Solution Defer work that is not necessary to reach a responsive state or schedule it at low priority You can see what code is executing by digging in to the Stacks in the CPU Usage (Sampled) summary table. 53
HTML/XAML I-11: Inline Format/Layout Problem: Your script can force the app platform to format and layout your DOM if you call certain functions. Identify the Problem: Inline layouts can be identified in the Frame Analysis – CPU Usage (Attributed) by looking for patterns in these categories: [Root]/Trident/Formatting [Root]/Trident/Layout [Root]/JScript/OM An inline layout will start in JScript/OM and call in to Trident/Format and/or Layout, then return to JScript/OM Solution Avoid querying DOM layout properties from your script such as get. Element. By. Tag(“div”). offset. Height For more details, see this MSDN page. 54
I-12: Excessive Win. RT Calls HTML/XAML Problem: Inefficient use or repeated calls to expensive Win. RT APIs can negatively impact performance Identify the Problem: For Win. RT costs, copy the Frame Analysis - CPU Usage (Attributed) summary table to the Big Picture Tab. Compare the two CPU Usage graphs: Look for time when your app is not using 100% CPU of its UI thread in Attributed. If Runtime. Broker. exe is using the CPU during these dips, you are probably making Win. RT calls (look in Precise). Solution Examine your code and try to improve the way you make Win. RT calls: For example, if your app is making repeated calls to the same function, consider calling it once and caching the result. 55
Panning Analysis Touch manipulation covers two aspects: Being Fast (quickly respond to input/render content) & Fluid (smooth animations)
This Section Will Cover… 1. How to find your panning scenario within the trace 2. How to identify if common problems in app panning are impacting your app 3. Best practices for resolving these common problems All the issues that can affect animation smoothness can affect your panning smoothness – Go to the Smooth Animations & Glitch-Free Panning section for more analysis tips This section will not cover analysis of Launch or Page Navigation scenarios (See the previous sections) 57
Locate your Panning Span in the Trace Markers tab Your panning span will start with the user’s touch event, such as a flick, to pan through a list (First Box) The scenario is complete when your DWM Frame Rate reaches a steady, idle state (Second Box). 58
I-15. 1: Always Display List Items HTML/XAML Problem: While panning through lists of content, it is important that a user always know where they are in the list. Identify the Problem: If you notice blank spots as you pan through your list, this means you are not rendering your items quickly enough. The Frame Analysis - XAML/HTML Frame Details summary tables can show what visuals contributed to the cost of each frame. You can be CPU or GPU bound Use the CPU Usage (Attributed) summary table to see what type of work is taking the most time Remember: if you aren’t keeping up, your DWM frame rate will be high (because it doesn’t have to do work on blank items!) Solution Check if your scenario is CPU or GPU bound – if so, reduce the complexity of your list items If the CPU breakdown shows high cost in script or app code, you should simplify your item template 59
I-15. 2 Always Display List Items HTML/XAML Identify Problem UI Elements: The Frame Analysis - HTML Frame Details summary table can also help identify which DOM elements caused format and layout costs If your Frame Analysis - CPU Usage (Attributed) summary table shows significant Formatting or Layout costs, open the HTML Frame Work Breakdown view of the HTML Frame Details summary table Dig in to your expensive frames to understand what elements contributed to that frame’s work The Work Stack column breaks down the work per frame into Layout and Format costs and shows information such as HTML tag and CSS class names Solution Identify the expensive pieces of your UI (those with the highest Task. Exclusive cost) and try to simplify those parts of your UI 60
I-16: Panning through Complex Items HTML/XAML HTML apps can use an item renderer function to specify different stages of content that will help to quickly fill in a list of data during panning: Stage 1: Placeholder – this stage presents an empty placeholder and should only be used if you do not have any data for the item Stage 2: Placeholder with Data – this stage fills in basic, meaningful data for the item, so that a user knows their location in the list Stage 3: Full Content – this stage is run after all Stage 2’s are complete and will fill in all remaining (expensive) data, such as images XAML apps do not have a multi-stage rendering function. Solution Apply these principles if you see lots of blank items while panning: Design your item renderer to have a very fast Stage 2 placeholder step. XAML apps do not have a multi-stage rendering function. If you cannot render items quickly enough, consider reducing the complexity of your item template. 61
HTML/XAML Panning through Complex Items (Sample) Use this sample code to easily set up your multi-stage item renderer. function item. Renderer(item. Promise, recycled) { // STAGE 1 // When this is called, we can immediately prepare a generic placeholder var div = document. create. Element("div"); div. inner. Text = "loading. . . "; // END STAGE 1 return { element: div, render. Complete: item. Promise. then(function (item) { // STAGE 2 // Note: Stage 2 may run inline immediately following stage 1 if the data is already available. // Lightweight placeholder with basic information div. inner. Text = item. data. title; // END STAGE 2 // Waiting for item. ready to do heavy work return item. ready. then(function () { // STAGE 3 // More expensive work should be done in stage 3 such as loading images. var img = document. create. Element('img'); img. src = item. data. imgurl; div. append. Child(img); // END STAGE 3 }); }) } } 62
Smooth Animations & Glitch-Free Panning
I-4. 1: Smoothness & Glitches (Identify) HTML/XAML Problem: It is important for both animations and touch manipulation (such as panning) to be smooth and free of glitches or jerkiness. A smooth experience is measured as delivering a consistent 60 frames per second (FPS) during animations or touch manipulation. Identify the Problem: The Frame Analysis DWM Frame Details summary table shows your FPS. If it is not consistently 60 FPS, identify why: Duplicate the DWM Frame Details table and switch to the DWM Frame E 2 E table view To achieve 60 FPS, all frames (rows) should have a Since. Last. Flip time of about 16 ms – the frames that don’t probably glitched You can expand each row to see what visuals/layers contributed to its cost Causes & solution explained on next page… 64
I-4. 2: Smoothness & Glitches (Fix) HTML/XAML Glitches can be caused by a lack of two system resources: CPU and/or GPU. The Frame Analysis - DWM Frame Details summary table (DWM Frame E 2 E view) helps identify which situation your app falls in to: High Cpu. End. Delta time = CPU Bound (example on the right) High Gpu. Duration time = GPU Bound You can also see what Visuals (or layers) make up your UI by expanding a given row. Solution If your scenario is CPU bound, reduce the complexity of your scene & the number of UI elements you use Too many layers will result in high CPU cost If your scenario is GPU bound, reduce the amount of overdraw (overlapping elements) Lots of overlap between layers will result in high GPU cost For more info, see Cenk Ergan’s Performance Centric Framework Overview (Main slide deck, slide #19) 65
HTML/XAML I-4. 3 Smoothness & Glitches (HTML apps) HTML apps can make use of special instrumentation to get more context into their DWM frames. The Frame Analysis - HTML Frame Details summary table shows information similar to the DWM Frame Details summary table, but adds the tag, class, and ID names of the DOM elements in each visual/layer. 66