Airport Design Introduction www faa gov Note verify

 provides service to")
,")

 500 Air 400 Bus 300")

 2000 Air Pipe 1500 Truck Water 1000")
 7000000 6000000 5000000 4000000 3000000 2000000 1000000 0")


")
")


- Slides: 22
Airport Design Introduction www. faa. gov Note: verify all procedures taught this semester with current FAA or ICAO standards!
Some Stats w Every day, FAA 's Air Traffic Organization (ATO) provides service to more than 44, 000 flights and 2. 7+ million airline passengers. w 2019: 7. 3 million flights to top 77 US airports (ATL is busiest at 550, 000 arrivals and 550, 000 departures) w 19, 600 airports in the US l l 10% Military 27% Publicly owned
Some Stats l l l Air travel: 750 billion miles, one billion passengers (USA), average trip length 750 miles Highway travel: 5. 5 trillion VMT, ~450 billion trips, average trip length ~12 miles Walking: 33 billion miles (0. 1 mile person per year!!!)
Highway-miles in the USA
Passenger-miles by Public Mode 800 700 Miles 600 (Billions) 500 Air 400 Bus 300 Rail 200 100 0 1950 1960 1970 1980 1990 2000 2018 Bus includes school buses and intercity buses
Trip Length by Mode
Ton-miles by Mode 3000 2500 Miles (Billions) 2000 Air Pipe 1500 Truck Water 1000 Rail 500 0 1960 1970 1980 1990 2000 2010
Ton Miles US Freight Movements (millions) 7000000 6000000 5000000 4000000 3000000 2000000 1000000 0 19801981198219831984198519861987198819891990199119921993199419951996199719981999200020012002200320042005200620072008200920102011 Air Truck Railroad Ocean River Pipeline
Length of Freight Haul by Mode 1400 2010 1200 1000 Air Miles 800 1150 Pipe Truck 600 Water 400 Rail 200 0 1960 1970 1980 1990 2000 2010 563 914
Airplane Safety w The safest transport mode l l Air Carrier: w Average 50 per year, many years zero or close to it w Highest in recent years, 531 in 2001 General Aviation (GA): Average 500 per year, slight decreasing trend w Highway l Fatalities: 35, 000/yr
Source: Wikipedia 2019 data Busiest. Airports (Passengers)
Source: Wikipedia 2017 data Busiest. Airports (Flights)
Kentucky Airports An enplanement is a passenger BOARDING an aircraft. Multiply by two to get passengers for comparison to previous slides. • P-s: Commercial service – primary are publicly owned airports that receive scheduled passenger service and have more than 10, 000 passenger boardings ( enplanements) each year. Each primary airport is sub-classified by the FAA as one of the following four "hub" types ( s): L: Large hub that accounts for at least 1% of total U. S. passenger enplanements. • M: Medium hub that accounts for between 0. 25% and 1% of total U. S. passenger enplanements. • S: Small hub that accounts for between 0. 05% and 0. 25% of total U. S. passenger enplanements. • N: Nonhub that accounts for less than 0. 05% of total U. S. passenger enplanements, but more than 10, 000 annual enplanements
Source: Wikipedia prelim. 2019 data Freight
Airport System Airspace Terminal Airspace Runway Taxiway AIRSIDE Apron/Gates Terminal Parking Ground Access LANDSIDE
Airport Planning Studies w Airport System Plan l l l National State Regional w Airport Master Plan w Airport Project Plan
Airport Master Plan w Physical facilities w Land use w Environmental impacts w Access needs w Airport feasibility w How to get there
Where to put an airport? w Land use w Atmospheric conditions w Ground transport w Expandability w Proximity to other facilities w Obstructions w Demand
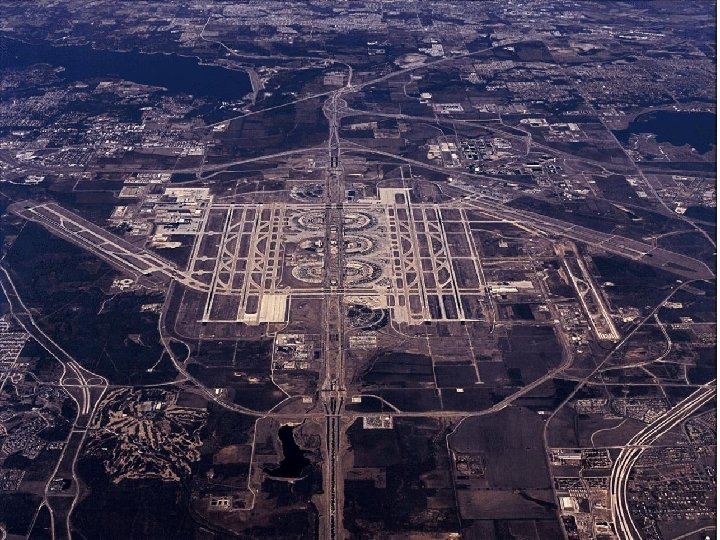
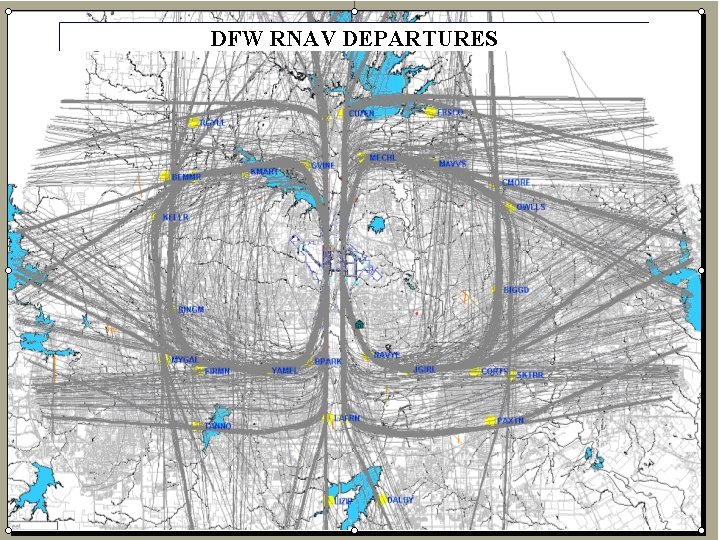
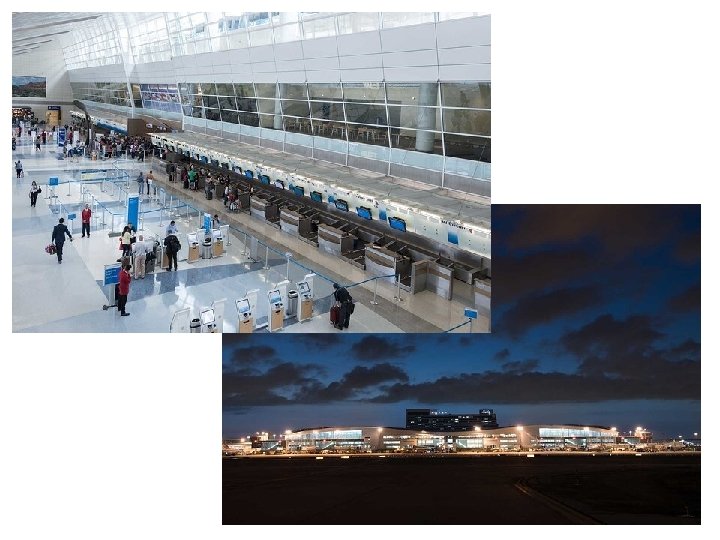
General Layout DFW