
Airline ticket pricing Consider United Airlines Flight 815




- Slides: 17
Airline ticket pricing Consider United Airlines Flight 815 from Chicago to LA on October 31, 19971 • There were 27 different one-way fares, ranging from $1, 248 for a first class ticket purchased the day of the flight to $87 for an advance purchase coach ticket. • Some travelers cashed in frequent flier miles. • Some qualified for senior citizen discounts. • Some passengers traveled on restricted tickets that required Saturday stayovers. 1”So, How much did you pay for your ticket, ” New York Times, April 12, 1998
Assumptions 1. You are a manager for a regional airline offering non-stop service between Houston, TX and Orlando, FL. 2. Your airline makes one departure from each city per day (2 flights total). 3. One rival airline offers non-stop service on this route. 4. We ignore first class service and focus on the demand for coach-class travel.
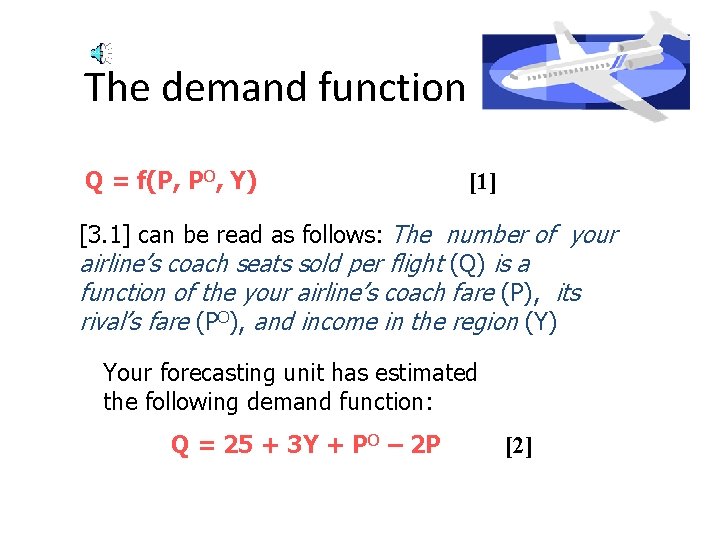
The demand function Q = f(P, PO, Y) [1] [3. 1] can be read as follows: The number of your airline’s coach seats sold per flight (Q) is a function of the your airline’s coach fare (P), its rival’s fare (PO), and income in the region (Y) Your forecasting unit has estimated the following demand function: Q = 25 + 3 Y + PO – 2 P [2]
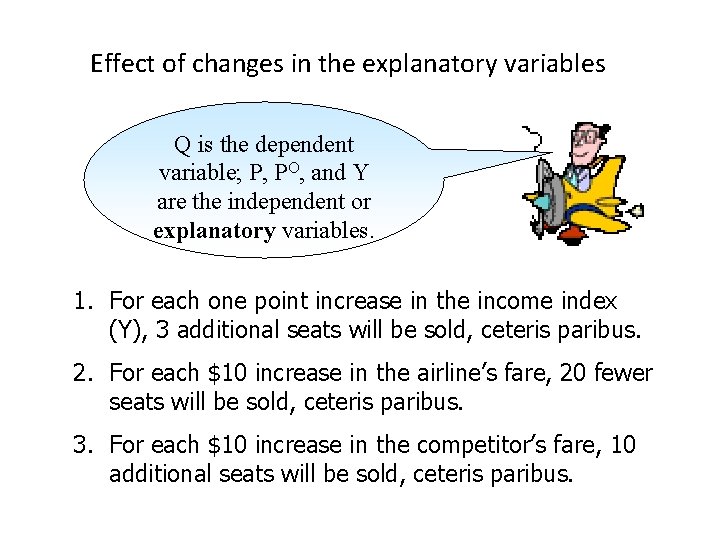
Effect of changes in the explanatory variables Q is the dependent variable; P, PO, and Y are the independent or explanatory variables. 1. For each one point increase in the income index (Y), 3 additional seats will be sold, ceteris paribus. 2. For each $10 increase in the airline’s fare, 20 fewer seats will be sold, ceteris paribus. 3. For each $10 increase in the competitor’s fare, 10 additional seats will be sold, ceteris paribus.
The multivariable regression model How did the Forecasting Unit estimate that equation? Multivariable regression is a technique that allows for more than one explanatory variable.
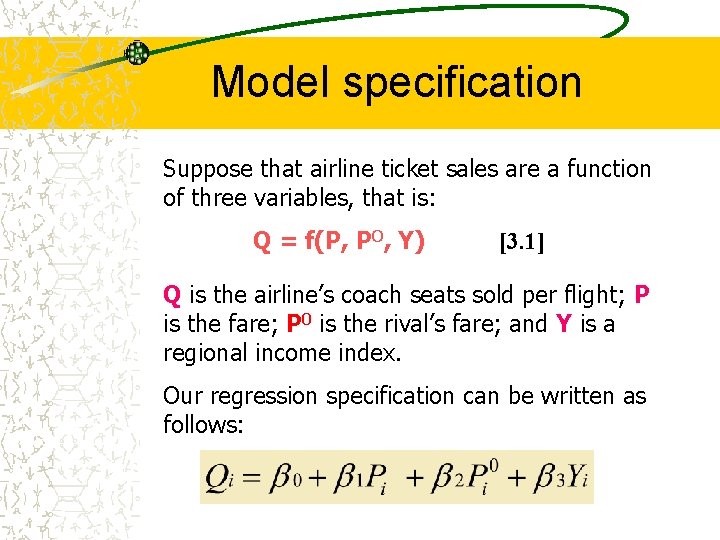
Model specification Suppose that airline ticket sales are a function of three variables, that is: Q = f(P, PO, Y) [3. 1] Q is the airline’s coach seats sold per flight; P is the fare; P 0 is the rival’s fare; and Y is a regional income index. Our regression specification can be written as follows:
The Data
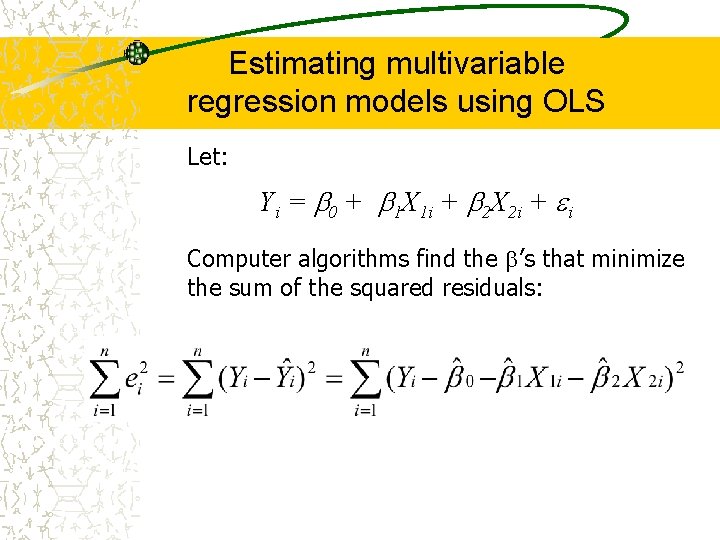
Estimating multivariable regression models using OLS Let: Yi = 0 + 1 X 1 i + 2 X 2 i + i Computer algorithms find the ’s that minimize the sum of the squared residuals:
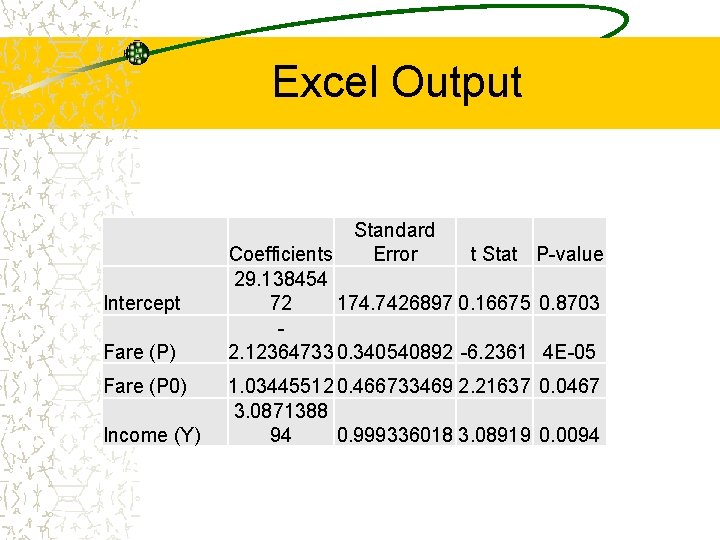
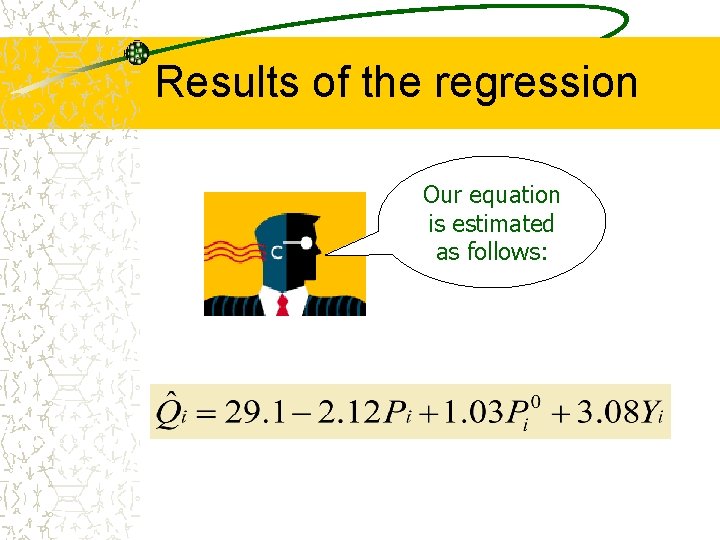
Excel Output Standard Error Intercept Fare (P) Fare (P 0) Income (Y) Coefficients t Stat P-value 29. 138454 72 174. 7426897 0. 16675 0. 8703 2. 12364733 0. 340540892 -6. 2361 4 E-05 1. 03445512 0. 466733469 2. 21637 0. 0467 3. 0871388 94 0. 999336018 3. 08919 0. 0094
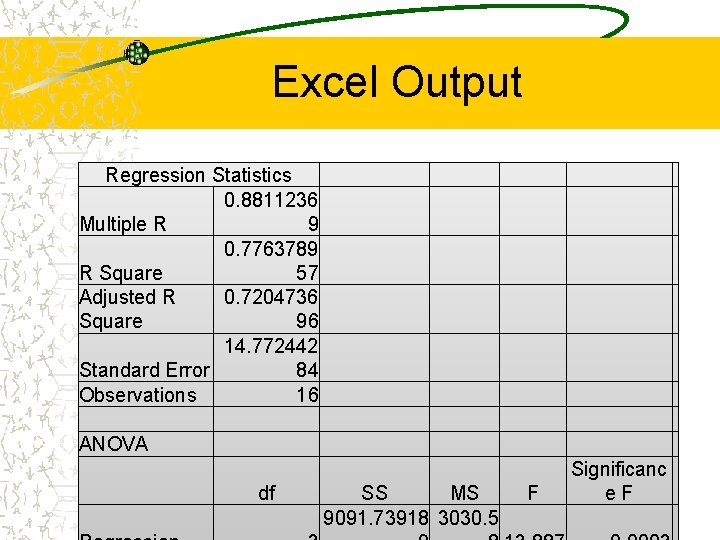
Excel Output Regression Statistics 0. 8811236 Multiple R 9 0. 7763789 R Square 57 Adjusted R 0. 7204736 Square 96 14. 772442 Standard Error 84 Observations 16 ANOVA df SS MS 9091. 73918 3030. 5 F Significanc e. F
Results of the regression Our equation is estimated as follows:
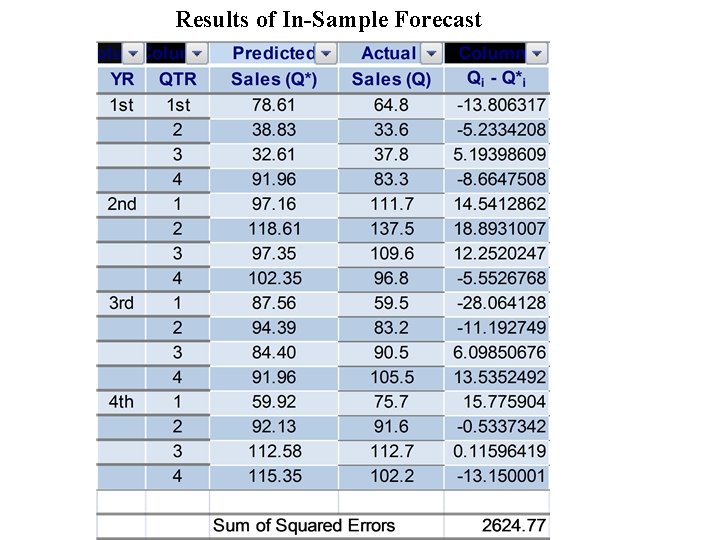
Results of In-Sample Forecast
In-sample forecast for the multivariable model
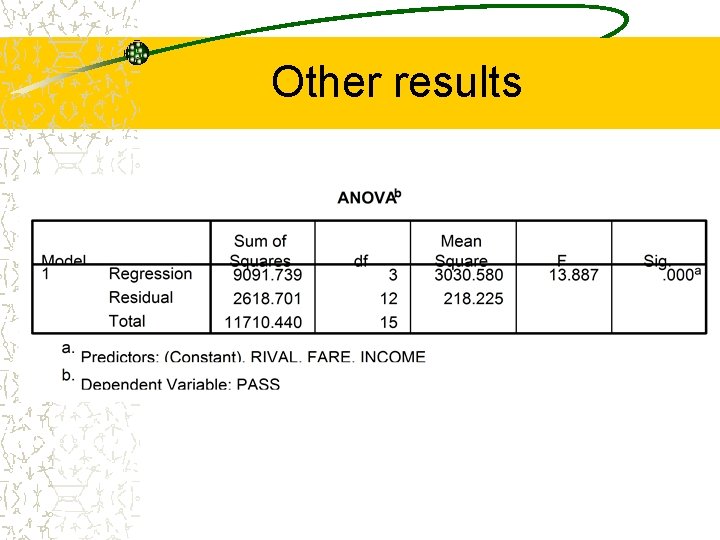
Other results
The F test provides another “goodness of fit” criterion for our regression equation. The F test is a test of joint significance of the estimated regression coefficients. The F statistic is computed as follows: Where K - 1 is degrees of freedom in the numerator and n – K is degrees of freedom in the denominator
We set up the following null hypothesis an alternative hypothesis: H 0 : 1 = 2 = 3 = 0 HA: H 0 is not true We adhere to the following decision rule: Reject H 0 if F > FC, where FC is the critical value of F at the level of significance selected by the forecaster. Suppose we select the 5 percent significance level. The critical value of F (3 degrees of freedom in the numerator and 12 degrees of freedom in the denominator) is 3. 49. Thus we can reject the null hypothesis since 13. 9 > 3. 49.
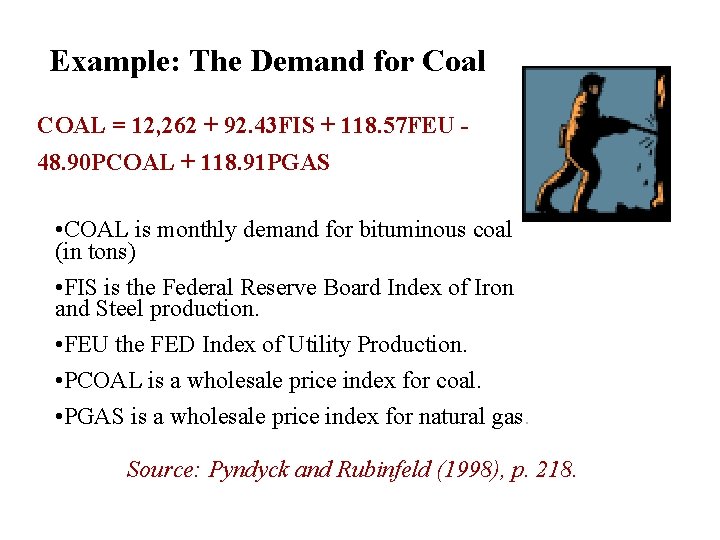
Example: The Demand for Coal COAL = 12, 262 + 92. 43 FIS + 118. 57 FEU 48. 90 PCOAL + 118. 91 PGAS • COAL is monthly demand for bituminous coal (in tons) • FIS is the Federal Reserve Board Index of Iron and Steel production. • FEU the FED Index of Utility Production. • PCOAL is a wholesale price index for coal. • PGAS is a wholesale price index for natural gas. Source: Pyndyck and Rubinfeld (1998), p. 218.