Aim How to plot or graph data What


 1,")
- Slides: 9
Aim: How to plot or graph data
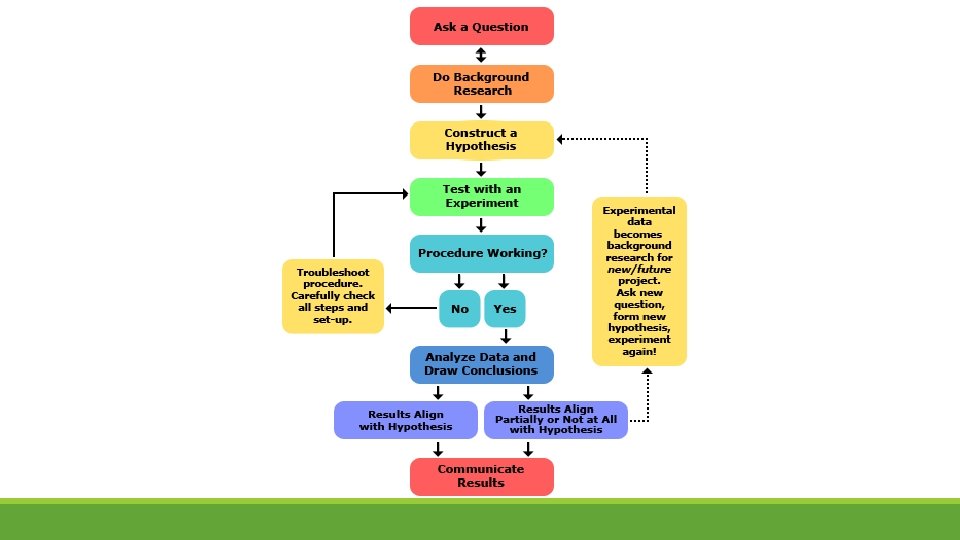
What is the Scientific Method? “The Road to Knowledge” • The Scientific Method is a method of procedure scientist use consisting in observation, measurement, and experiment, and the formulation, testing, and modification of hypotheses. • It is a way to ask and answer scientific questions by making observations and doing experiments • It is a dynamic process; meaning, there is no definite order to the steps in the scientific method. Scientist jump from one step to another when testing a hypothesis, even formulating a new one.
Steps to the Scientific Method • Making observations • Coming up with a hypothesis and testing it. A hypothesis involves developing an idea or set of ideas that might explain our observations • Collect and analyze data. • Check results in experiment against your hypothesis: “Do your results agree with your hypothesis? ” • Start over if you need to.
Graphing and Analyzing Data • Identify dependent and independent variables • Dependent variable – the variable that is being observed during an experiment. • Independent variable – the variable that is being changed during an experiment
Graphing and Analyzing Data Cont. • Labeling the graph • Title the graph • Label the y-axis (dependent variable) and x-axis (independent variable) • Direct relationship; “as one variable increases, the other variable increases” or “as one variable decreases, the other variable decreases” • Indirect or inverse relationship; “as one variable increases, the other variable decreases” or “as one variable decreases, the other variable increases”
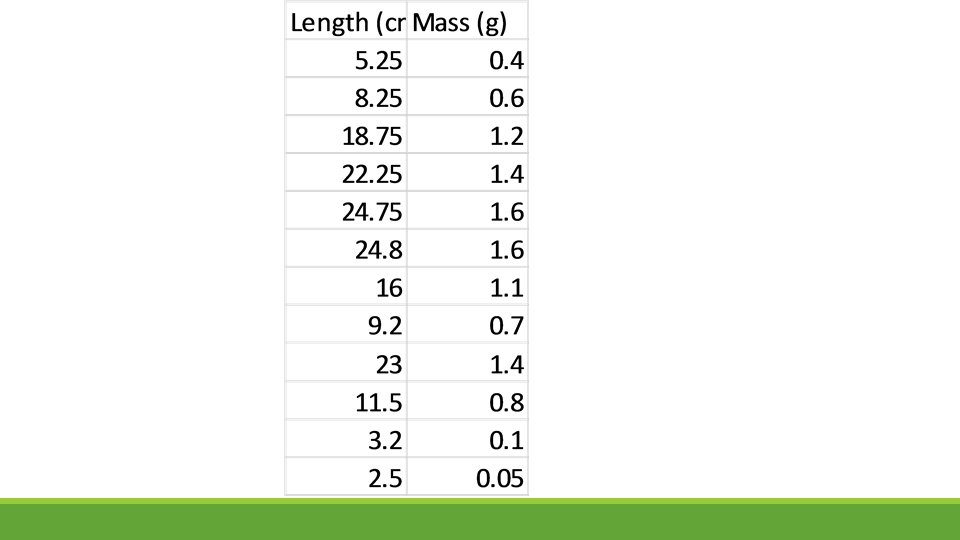
Determining slope of best-fit line 1. Prepare a scatter plot of the data. 2. Using a ruler, draw a straight line (best-fit line) so that the plotted points are as close to the line as possible. 3. Find two points that you think will be on the "best-fit" line. 4. We are choosing the points (1. 4, 100) and (3. 4, 300). You may choose different points. 5. Calculate the slope of the line through your two points. , x 1= 1. 4 and x 2= 3. 4 Y 1 = 100 and Y 2= 300
Mass versus Length of Spaghetti 1, 8 1, 6 1, 4 Mass (g) 1, 2 1 0, 8 0, 6 0, 4 0, 2 0 0 5 10 15 Length (cm) 20 25 30