
AHMED UMAIR VITAL AGRI NUTRIENTS PVT LTD VITAL

- Slides: 36
AHMED UMAIR VITAL AGRI NUTRIENTS (PVT) LTD VITAL GREEN (PVT) LTD VALUE ADDED FERTILIZERS FOR SUGARCANE IMPACT ON COST & SUGAR RECOVERY
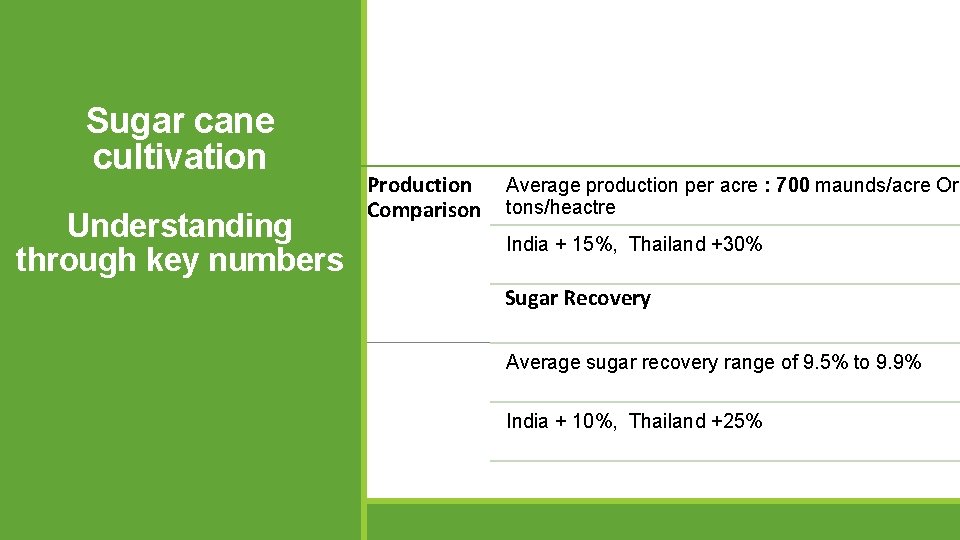
Sugar cane cultivation Understanding through key numbers Production Comparison Average production per acre : 700 maunds/acre Or tons/heactre India + 15%, Thailand +30% Sugar Recovery Average sugar recovery range of 9. 5% to 9. 9% India + 10%, Thailand +25%
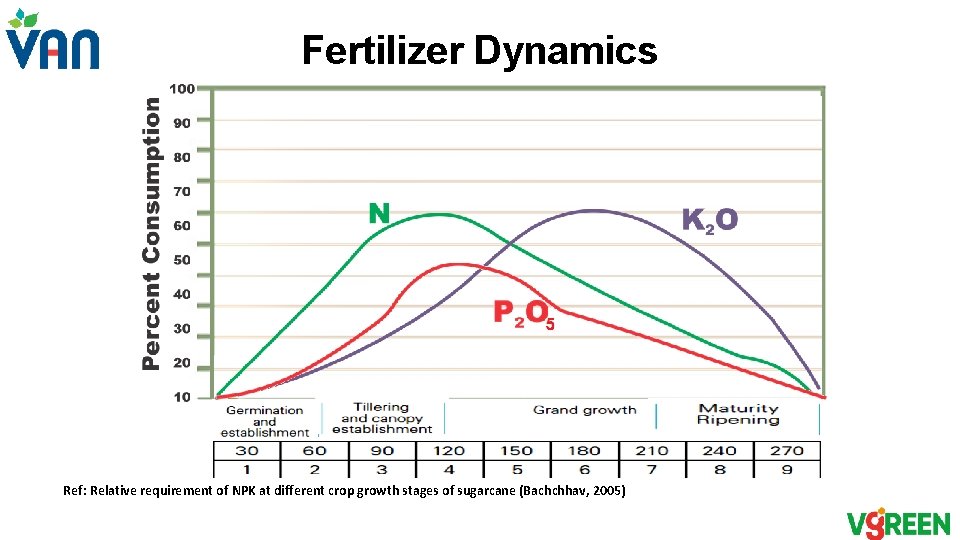
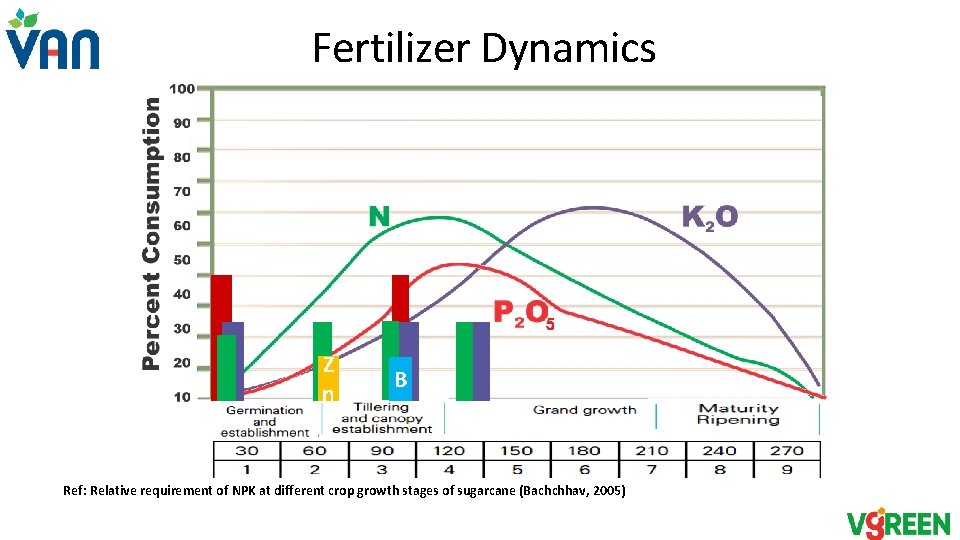
Fertilizer Dynamics Ref: Relative requirement of NPK at different crop growth stages of sugarcane (Bachchhav, 2005)
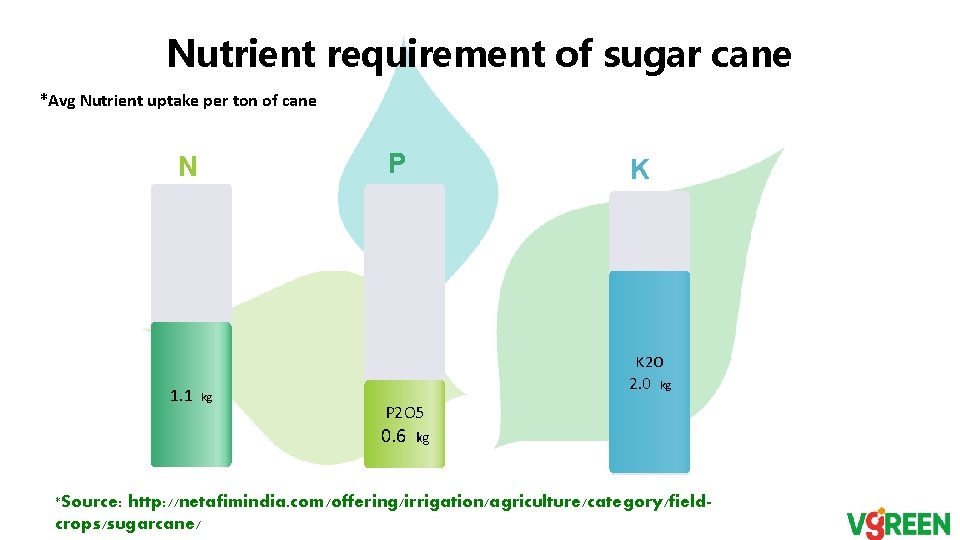
Nutrient requirement of sugar cane *Avg Nutrient uptake per ton of cane P N K K 2 O 1. 1 kg 2. 0 kg P 2 O 5 0. 6 kg *Source: http: //netafimindia. com/offering/irrigation/agriculture/category/fieldcrops/sugarcane/
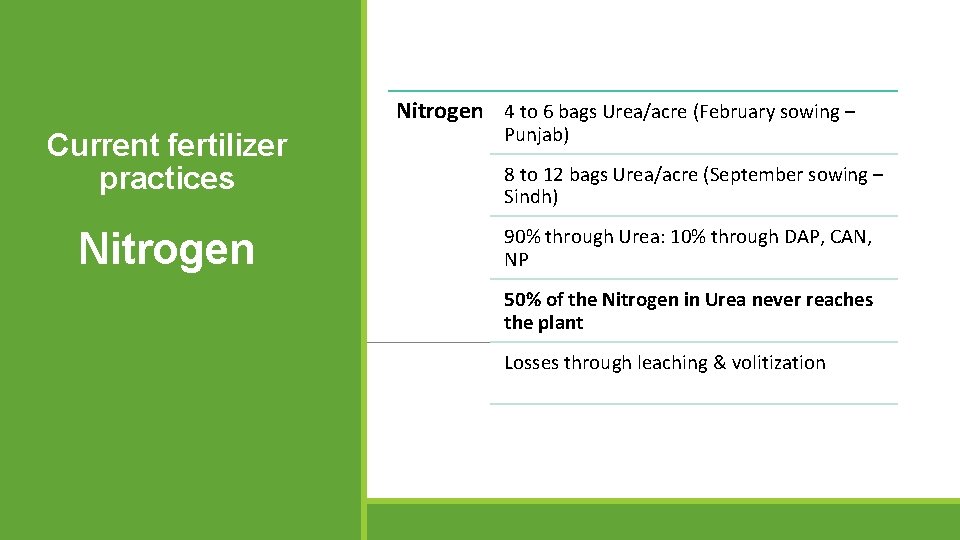
Nitrogen 4 to 6 bags Urea/acre (February sowing – Current fertilizer practices Nitrogen Punjab) 8 to 12 bags Urea/acre (September sowing – Sindh) 90% through Urea: 10% through DAP, CAN, NP 50% of the Nitrogen in Urea never reaches the plant Losses through leaching & volitization
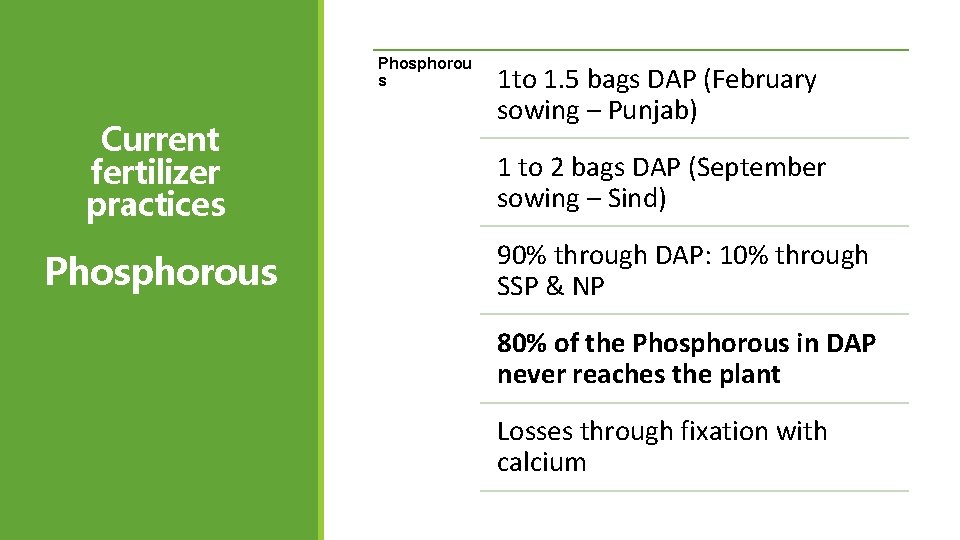
Phosphorou s Current fertilizer practices Phosphorous 1 to 1. 5 bags DAP (February sowing – Punjab) 1 to 2 bags DAP (September sowing – Sind) 90% through DAP: 10% through SSP & NP 80% of the Phosphorous in DAP never reaches the plant Losses through fixation with calcium
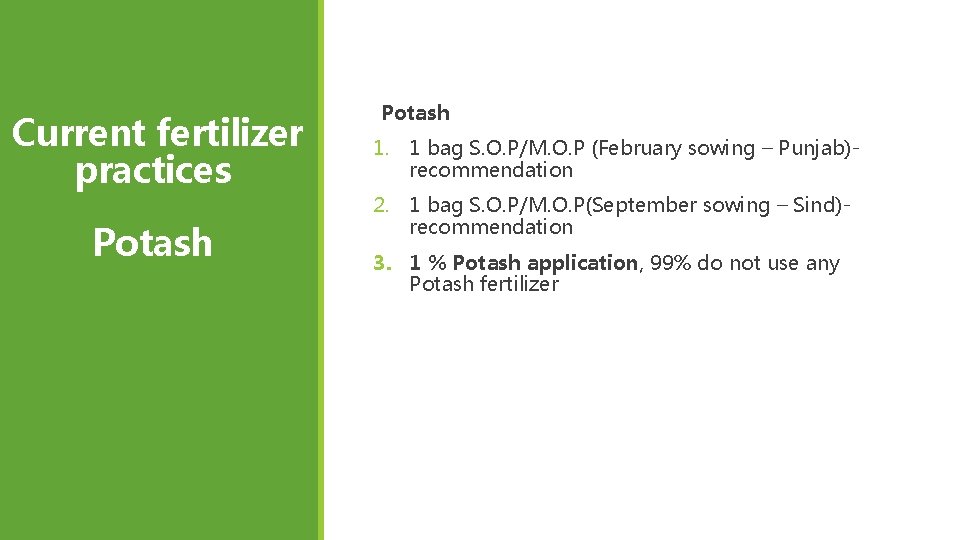
Current fertilizer practices Potash 1. 1 bag S. O. P/M. O. P (February sowing – Punjab)recommendation 2. 1 bag S. O. P/M. O. P(September sowing – Sind)recommendation 3. 1 % Potash application, 99% do not use any Potash fertilizer
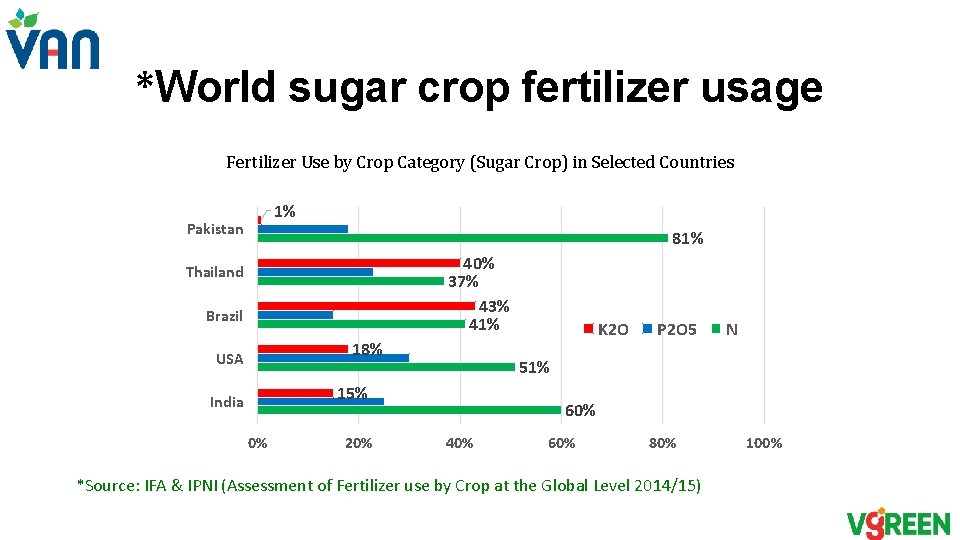
*World sugar crop fertilizer usage Fertilizer Use by Crop Category (Sugar Crop) in Selected Countries 1% Pakistan 81% 40% 37% 43% 41% Thailand Brazil 18% USA 0% 20% P 2 O 5 N 51% 15% India K 2 O 60% 40% 60% 80% *Source: IFA & IPNI (Assessment of Fertilizer use by Crop at the Global Level 2014/15) 100%
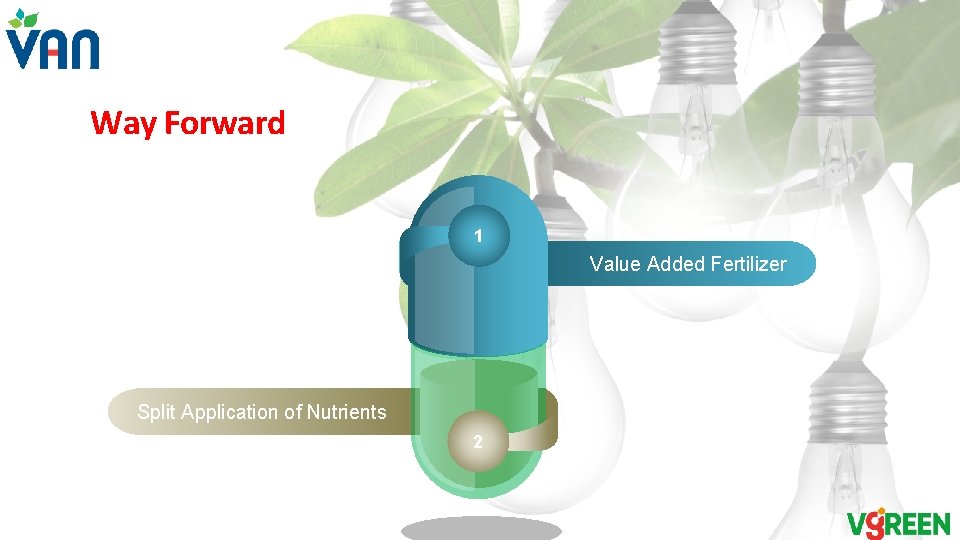
Way Forward 1 Value Added Fertilizer Split Application of Nutrients 2
Value Added Fertilizers “Value added fertilizers, through their formulation or mode of action deliver significantly greater economic value when compared to conventional fertilizers”
Understanding Value added fertilizers (VAFs) Types of VAFs a) Increasing Nutrient use efficiency b) Additional Supply of Secondary & micro nutrients c) Increased solubility of fertilizers Examples of VAFs a) b) c) Sulfur coated Urea: Blend of Macro and Intermediate nutrients Boron coated Nitro Potash: Coating with micro nutrient 100% WS Ammonium Phosphate: Increased water solubility
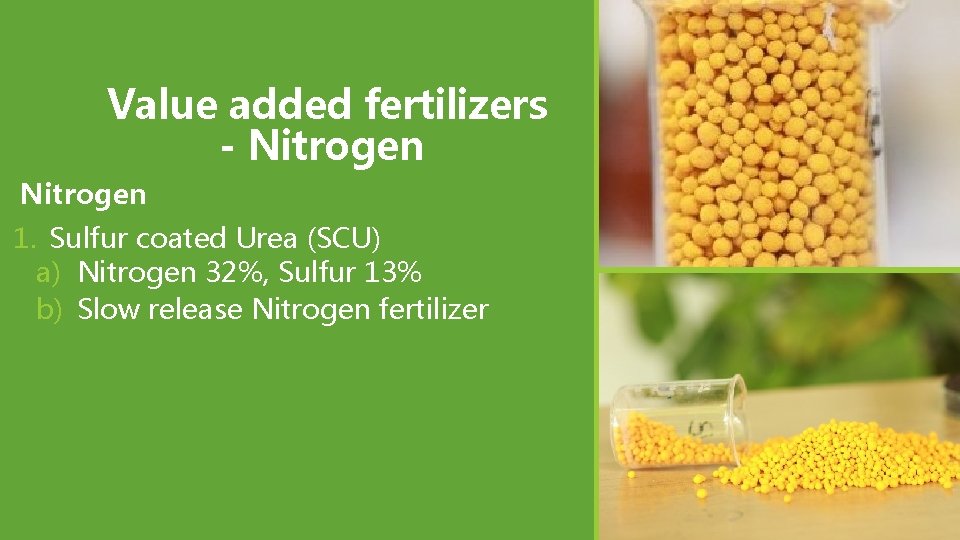
Value added fertilizers - Nitrogen 1. Sulfur coated Urea (SCU) a) Nitrogen 32%, Sulfur 13% b) Slow release Nitrogen fertilizer
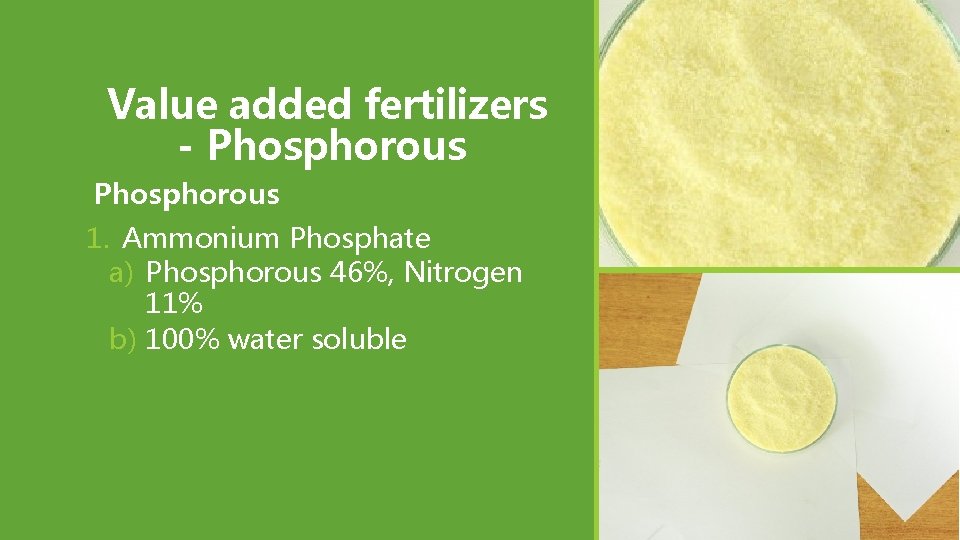
Value added fertilizers - Phosphorous 1. Ammonium Phosphate a) Phosphorous 46%, Nitrogen 11% b) 100% water soluble
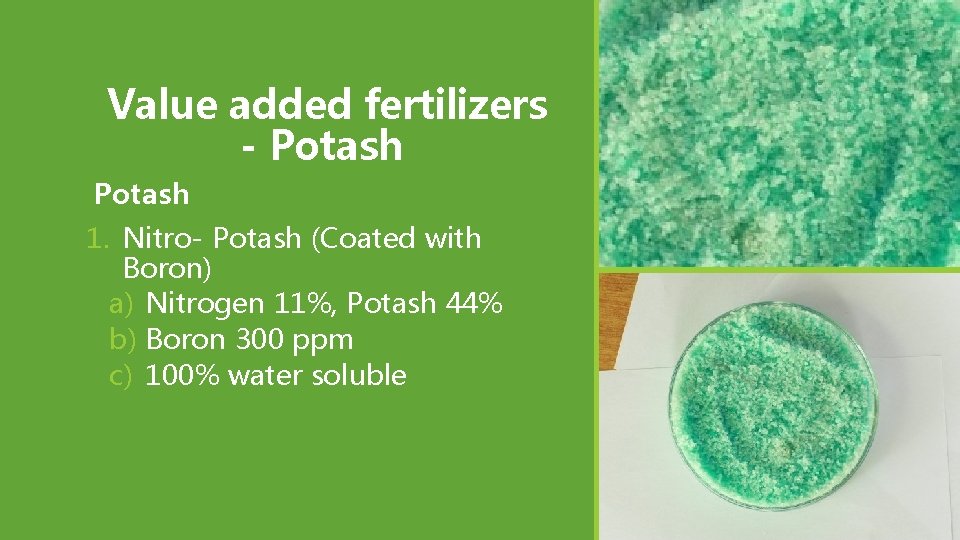
Value added fertilizers - Potash 1. Nitro- Potash (Coated with Boron) a) Nitrogen 11%, Potash 44% b) Boron 300 ppm c) 100% water soluble
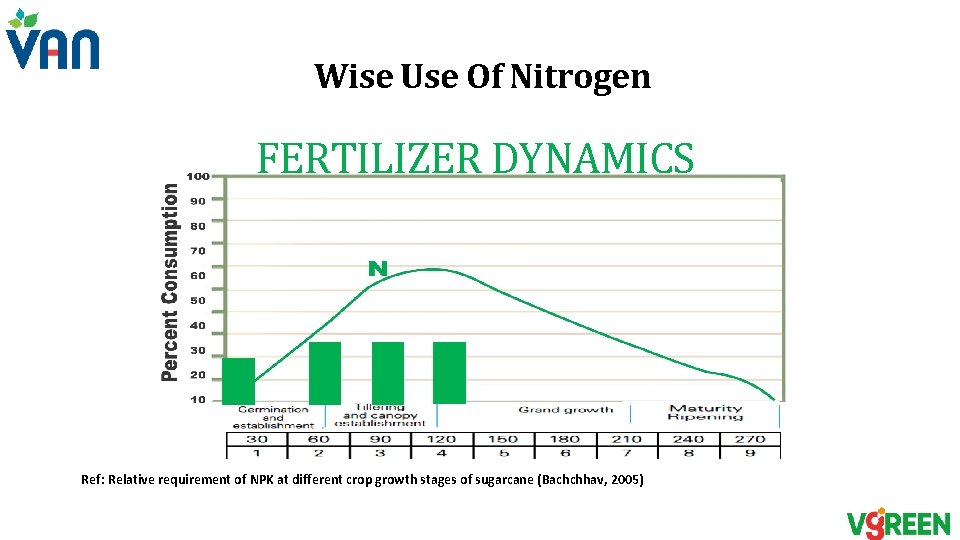
Wise Use Of Nitrogen FERTILIZER DYNAMICS Ref: Relative requirement of NPK at different crop growth stages of sugarcane (Bachchhav, 2005)
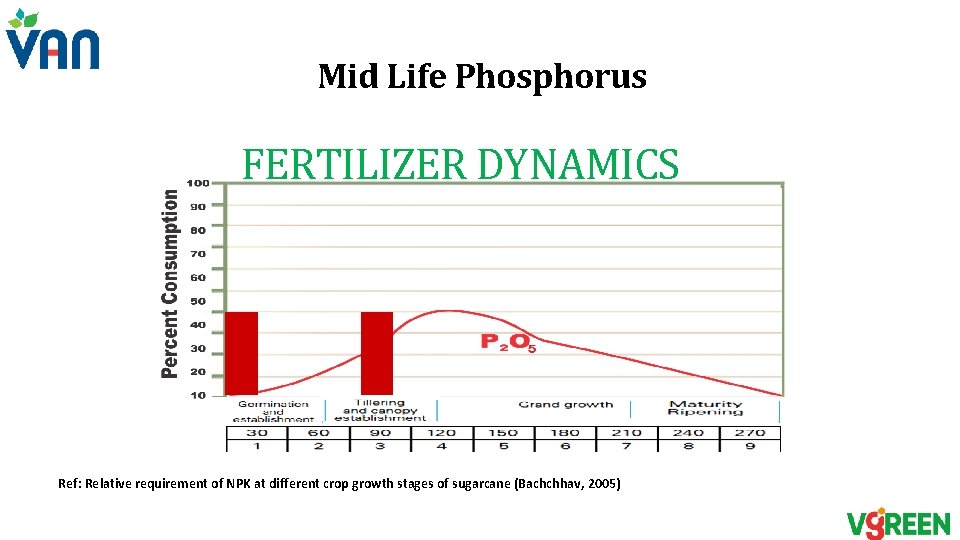
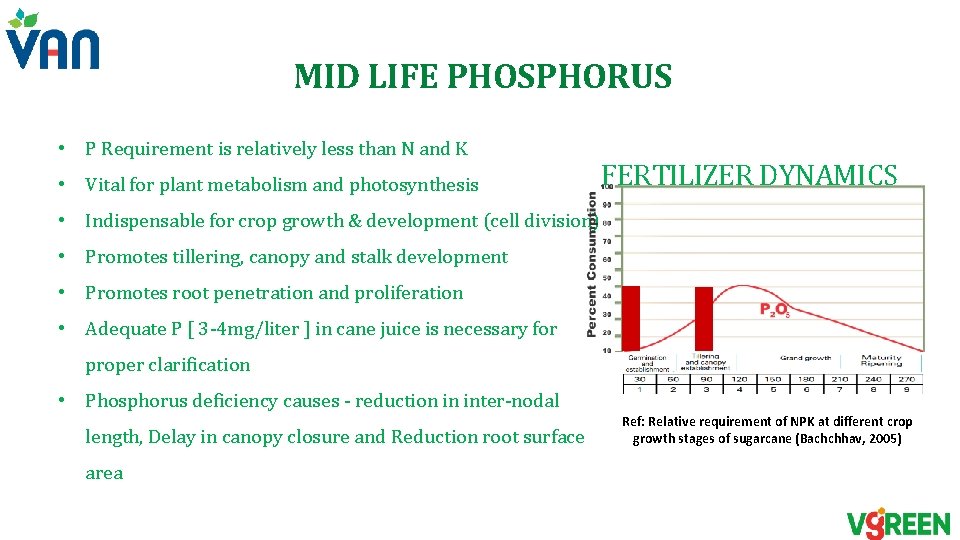
Mid Life Phosphorus FERTILIZER DYNAMICS Ref: Relative requirement of NPK at different crop growth stages of sugarcane (Bachchhav, 2005)
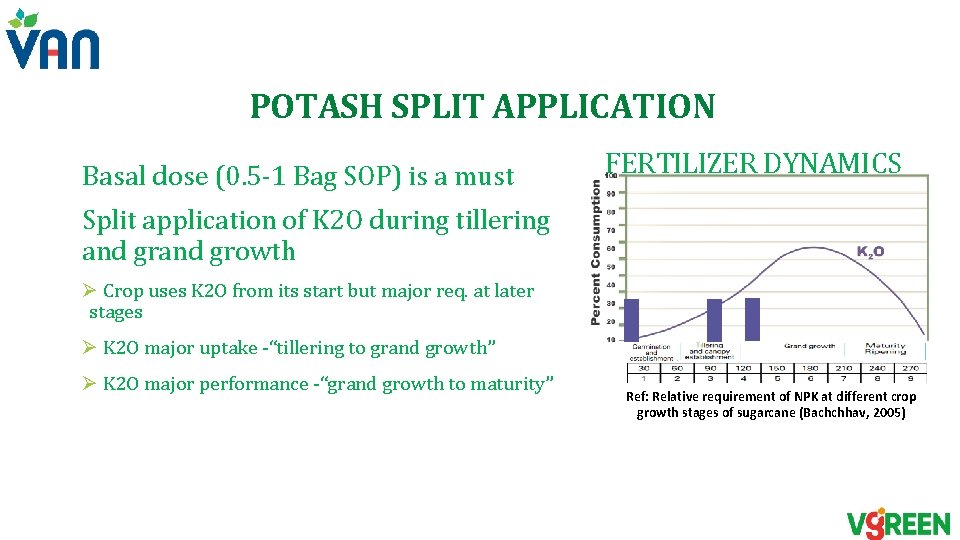
Potash Split Application FERTILIZER DYNAMICS Ref: Relative requirement of NPK at different crop growth stages of sugarcane (Bachchhav, 2005)
Fertilizer Dynamics Z n B Ref: Relative requirement of NPK at different crop growth stages of sugarcane (Bachchhav, 2005)
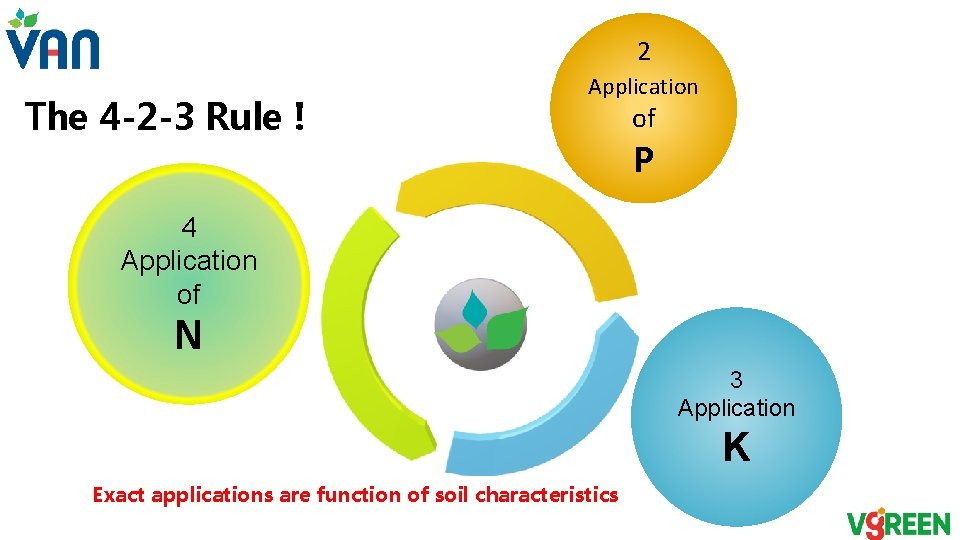
2 The 4 -2 -3 Rule ! Application of P 4 Application of N 3 Application K Exact applications are function of soil characteristics
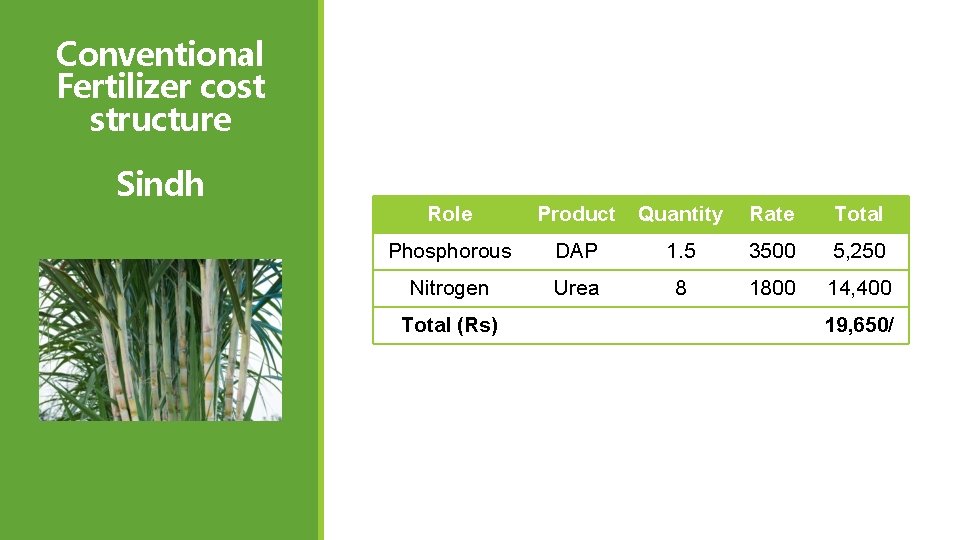
Conventional Fertilizer cost structure Sindh Role Product Quantity Rate Total Phosphorous DAP 1. 5 3500 5, 250 Nitrogen Urea 8 1800 14, 400 Total (Rs) 19, 650/
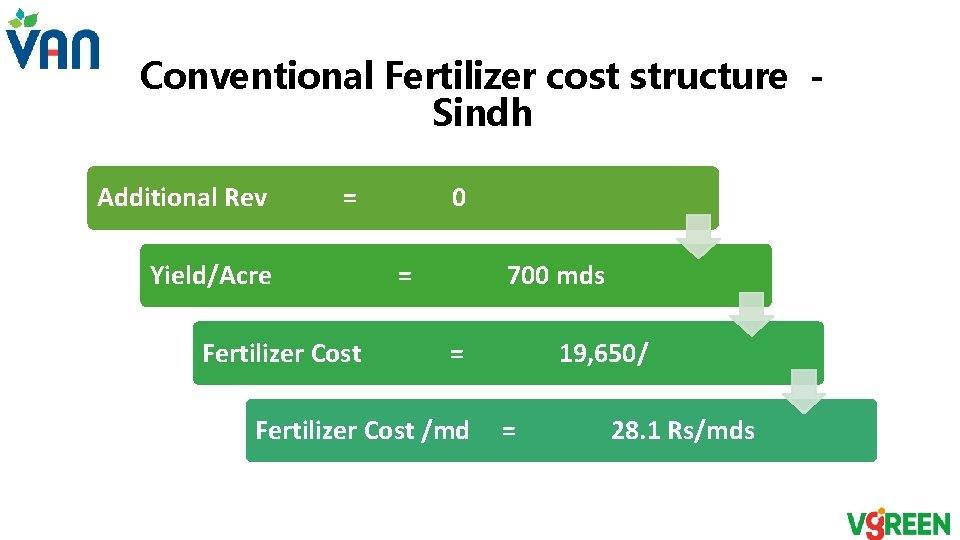
Conventional Fertilizer cost structure Sindh Additional Rev = 0 Yield/Acre = 700 mds Fertilizer Cost = 19, 650/ Fertilizer Cost /md = 28. 1 Rs/mds
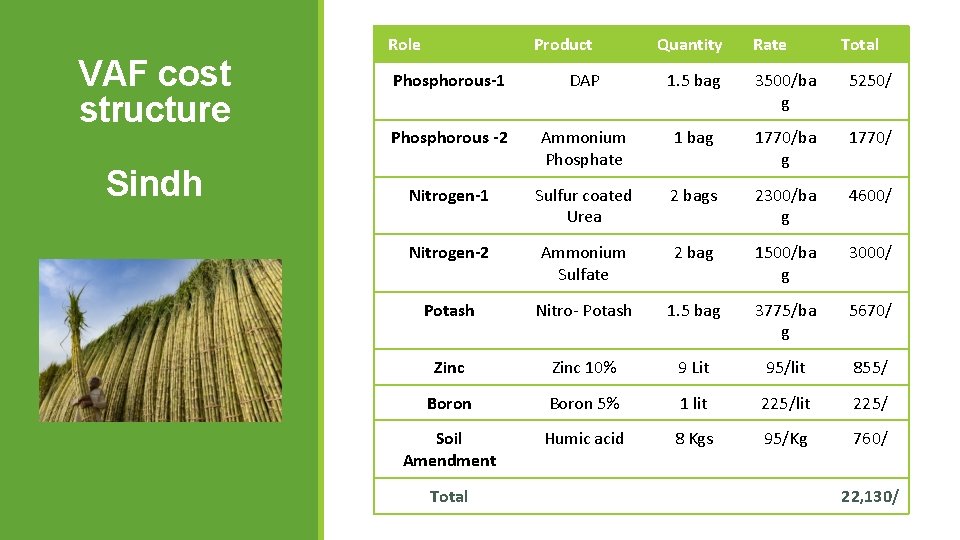
VAF cost structure Sindh Role Product Quantity Rate Total Phosphorous-1 DAP 1. 5 bag 3500/ba g 5250/ Phosphorous -2 Ammonium Phosphate 1 bag 1770/ba g 1770/ Nitrogen-1 Sulfur coated Urea 2 bags 2300/ba g 4600/ Nitrogen-2 Ammonium Sulfate 2 bag 1500/ba g 3000/ Potash Nitro- Potash 1. 5 bag 3775/ba g 5670/ Zinc 10% 9 Lit 95/lit 855/ Boron 5% 1 lit 225/ Soil Amendment Humic acid 8 Kgs 95/Kg 760/ Total 22, 130/
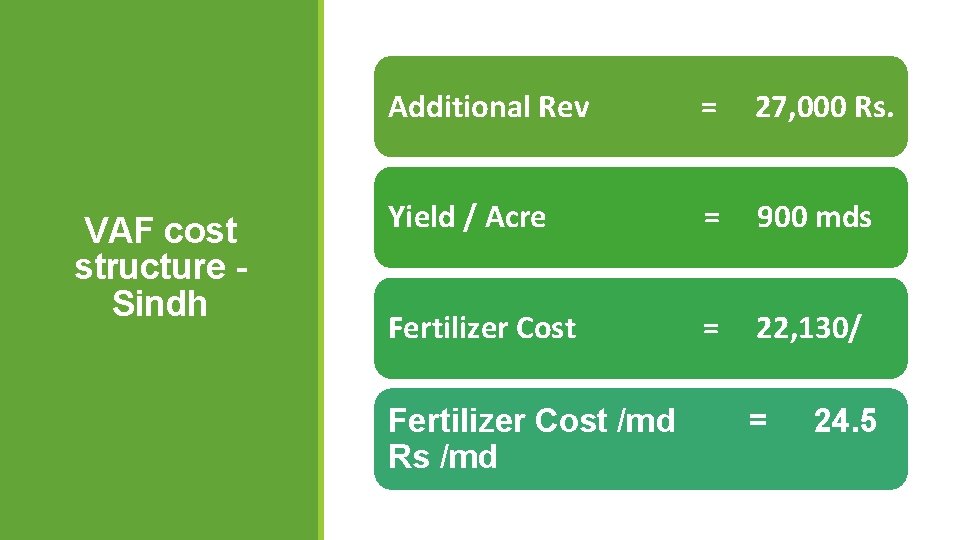
Additional Rev = 27, 000 Rs. VAF cost structure Sindh Yield / Acre = 900 mds Fertilizer Cost = 22, 130/ Fertilizer Cost /md Rs /md = 24. 5
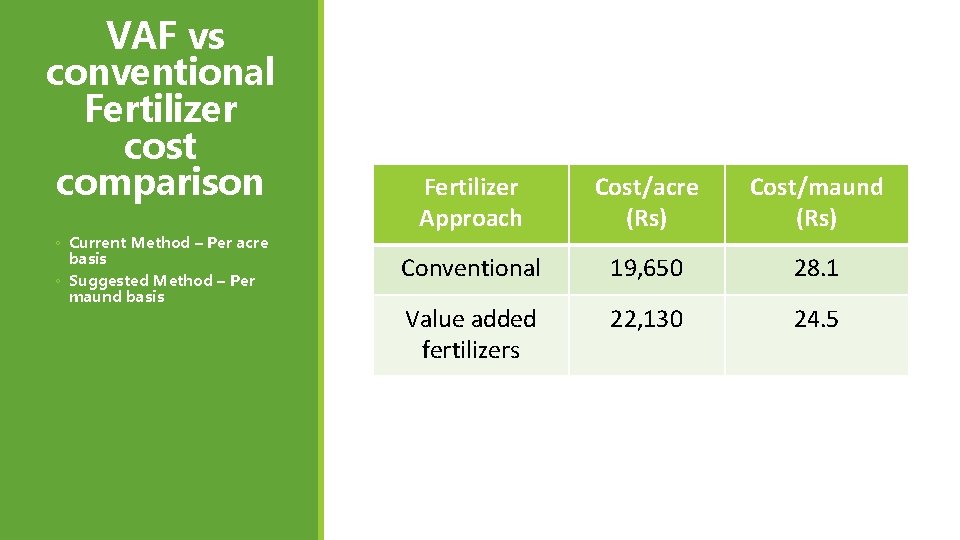
VAF vs conventional Fertilizer cost comparison ◦ Current Method – Per acre basis ◦ Suggested Method – Per maund basis Fertilizer Approach Cost/acre (Rs) Cost/maund (Rs) Conventional 19, 650 28. 1 Value added fertilizers 22, 130 24. 5
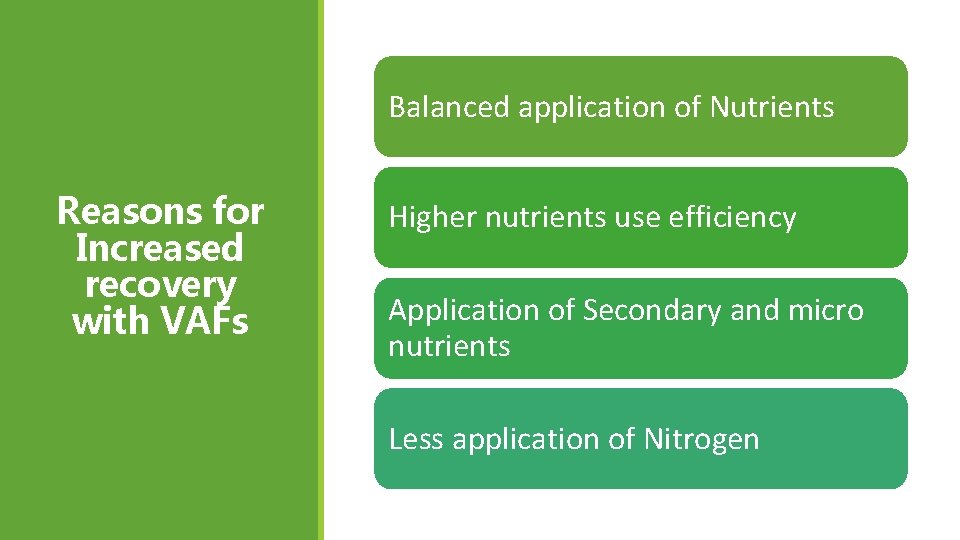
Balanced application of Nutrients Reasons for Increased recovery with VAFs Higher nutrients use efficiency Application of Secondary and micro nutrients Less application of Nitrogen
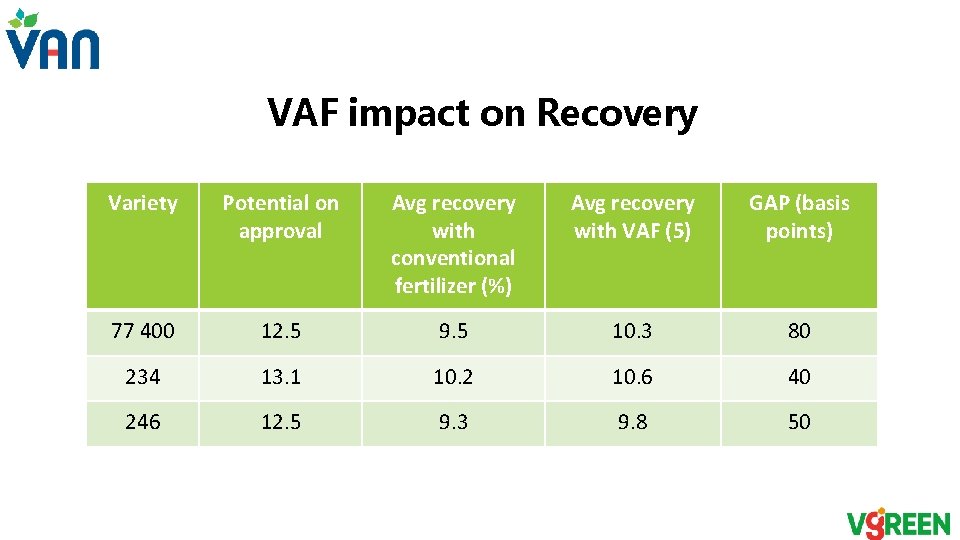
VAF impact on Recovery Variety Potential on approval Avg recovery with conventional fertilizer (%) Avg recovery with VAF (5) GAP (basis points) 77 400 12. 5 9. 5 10. 3 80 234 13. 1 10. 2 10. 6 40 246 12. 5 9. 3 9. 8 50
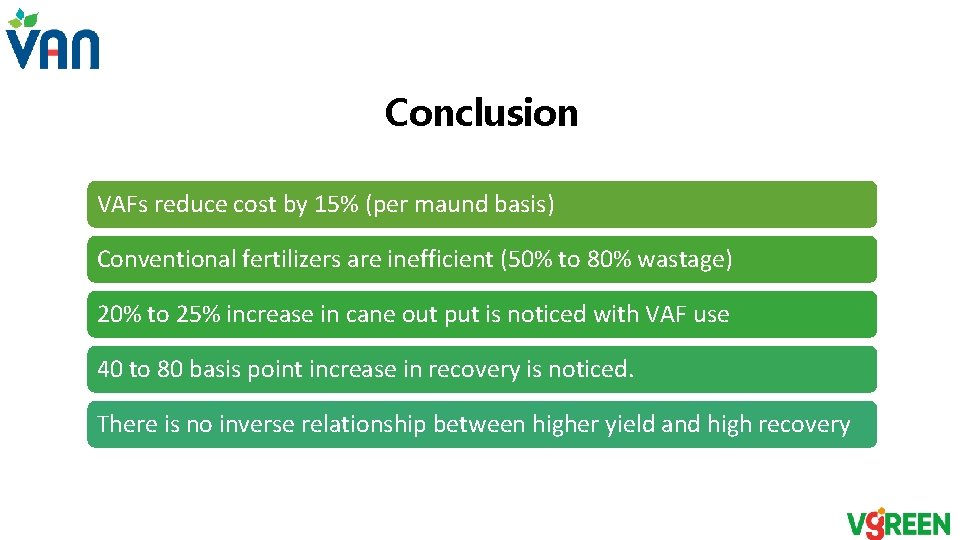
Conclusion VAFs reduce cost by 15% (per maund basis) Conventional fertilizers are inefficient (50% to 80% wastage) 20% to 25% increase in cane out put is noticed with VAF use 40 to 80 basis point increase in recovery is noticed. There is no inverse relationship between higher yield and high recovery
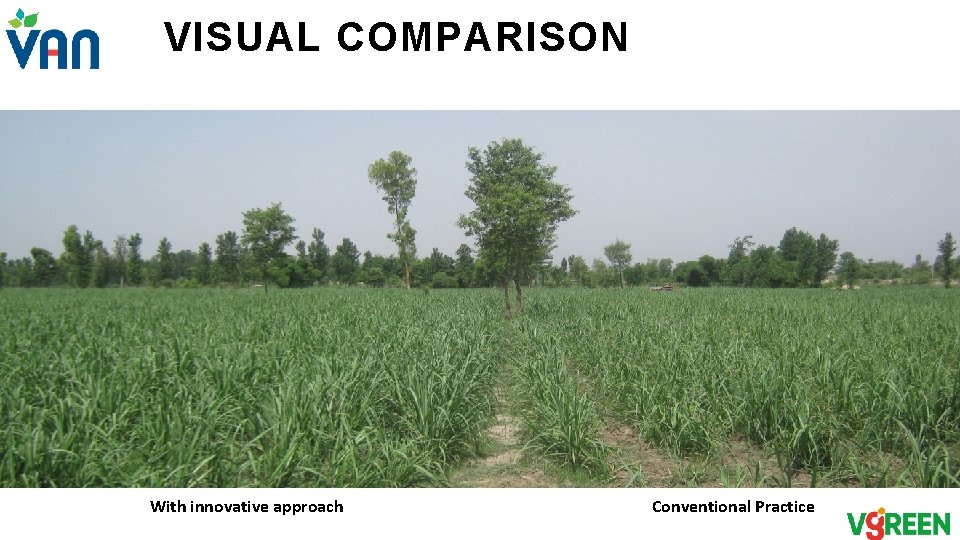
VISUAL COMPARISON With innovative approach Conventional Practice
Ahmed Umair
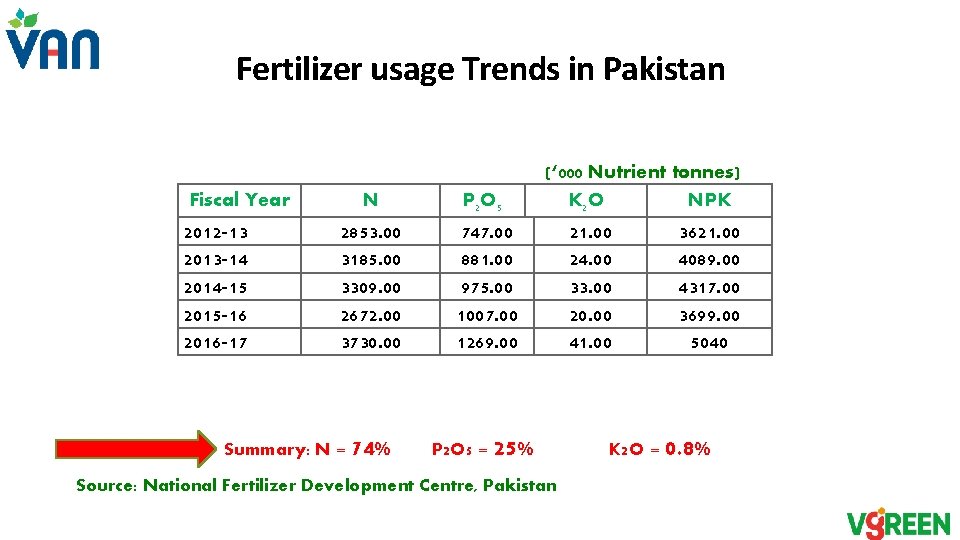
Fertilizer usage Trends in Pakistan Fiscal Year 2012 -13 2013 -14 2014 -15 2015 -16 2016 -17 N P 2 O 5 2853. 00 3185. 00 3309. 00 2672. 00 3730. 00 747. 00 881. 00 975. 00 1007. 00 1269. 00 Summary: N = 74% (‘ 000 Nutrient tonnes) K 2 O NPK P 2 O 5 = 25% Source: National Fertilizer Development Centre, Pakistan 21. 00 24. 00 33. 00 20. 00 41. 00 3621. 00 4089. 00 4317. 00 3699. 00 5040 K 2 O = 0. 8%
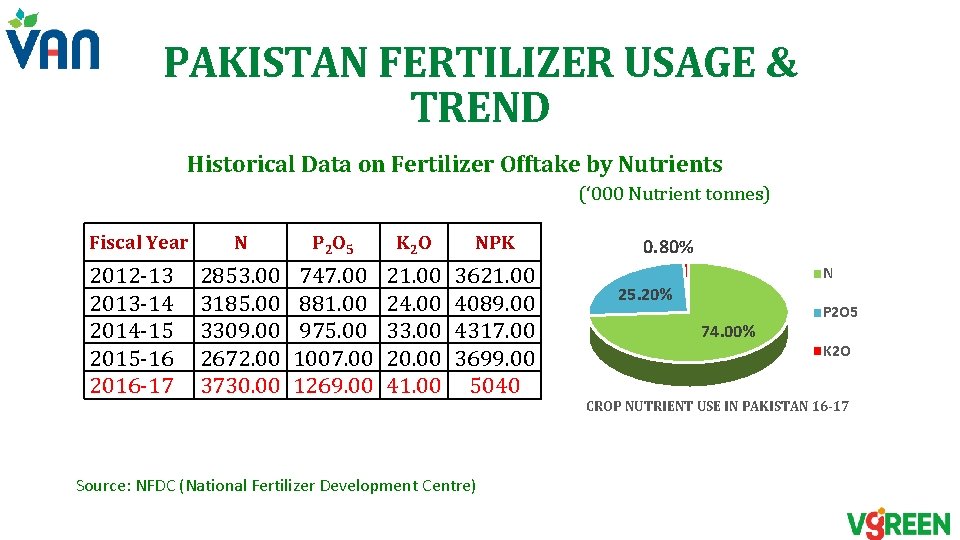
PAKISTAN FERTILIZER USAGE & TREND Historical Data on Fertilizer Offtake by Nutrients (‘ 000 Nutrient tonnes) Fiscal Year 2012 -13 2013 -14 2014 -15 2015 -16 2016 -17 N P 2 O 5 K 2 O NPK 2853. 00 3185. 00 3309. 00 2672. 00 3730. 00 747. 00 881. 00 975. 00 1007. 00 1269. 00 21. 00 24. 00 33. 00 20. 00 41. 00 3621. 00 4089. 00 4317. 00 3699. 00 5040 Source: NFDC (National Fertilizer Development Centre) 0. 80% N 25. 20% 74. 00% P 2 O 5 K 2 O CROP NUTRIENT USE IN PAKISTAN 16 -17
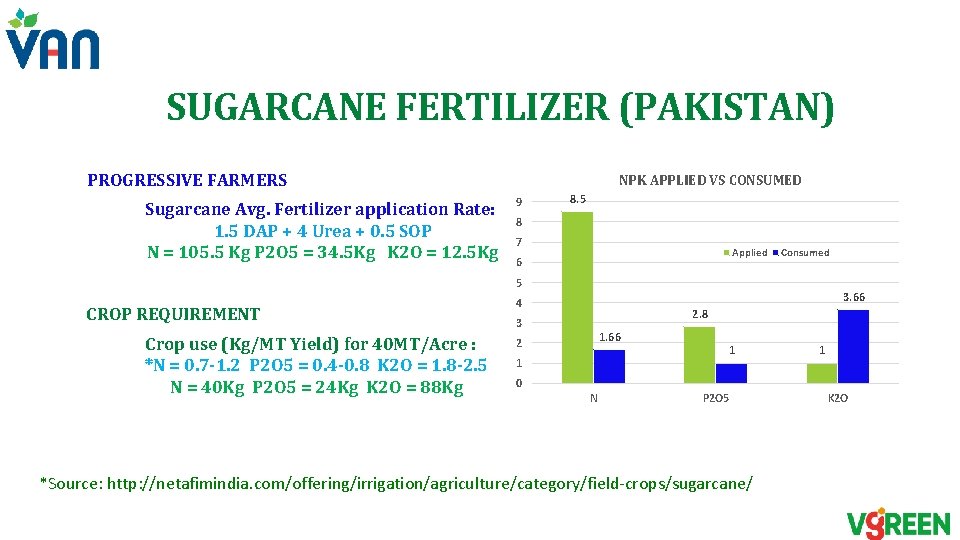
SUGARCANE FERTILIZER (PAKISTAN) PROGRESSIVE FARMERS Sugarcane Avg. Fertilizer application Rate: 1. 5 DAP + 4 Urea + 0. 5 SOP N = 105. 5 Kg P 2 O 5 = 34. 5 Kg K 2 O = 12. 5 Kg NPK APPLIED VS CONSUMED 9 8. 5 8 7 Applied 6 Consumed 5 CROP REQUIREMENT Crop use (Kg/MT Yield) for 40 MT/Acre : *N = 0. 7 -1. 2 P 2 O 5 = 0. 4 -0. 8 K 2 O = 1. 8 -2. 5 N = 40 Kg P 2 O 5 = 24 Kg K 2 O = 88 Kg 3. 66 4 2. 8 3 1. 66 2 1 1 1 0 N P 2 O 5 *Source: http: //netafimindia. com/offering/irrigation/agriculture/category/field-crops/sugarcane/ K 2 O
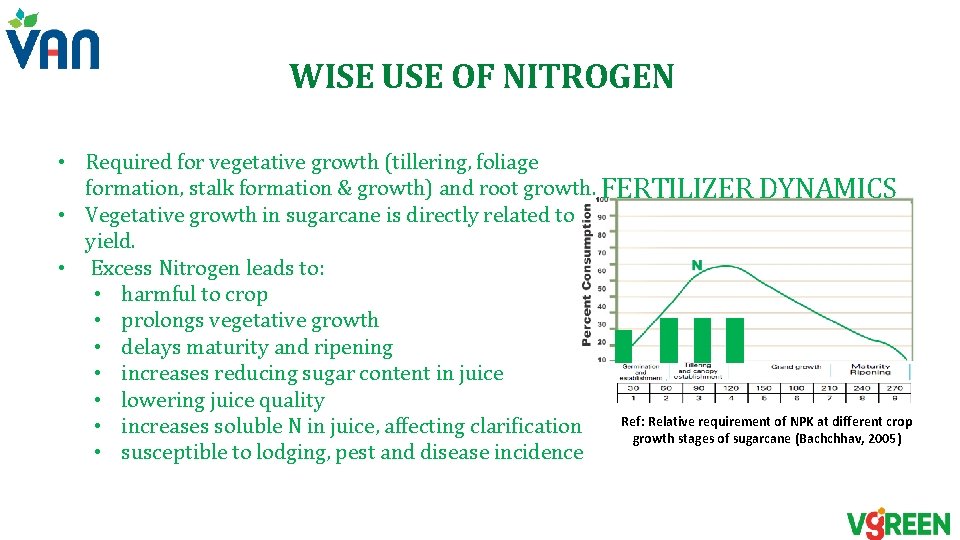
WISE USE OF NITROGEN • Required for vegetative growth (tillering, foliage formation, stalk formation & growth) and root growth. FERTILIZER DYNAMICS • Vegetative growth in sugarcane is directly related to yield. • Excess Nitrogen leads to: • harmful to crop • prolongs vegetative growth • delays maturity and ripening • increases reducing sugar content in juice • lowering juice quality Ref: Relative requirement of NPK at different crop • increases soluble N in juice, affecting clarification growth stages of sugarcane (Bachchhav, 2005) • susceptible to lodging, pest and disease incidence
MID LIFE PHOSPHORUS • P Requirement is relatively less than N and K • Vital for plant metabolism and photosynthesis FERTILIZER DYNAMICS • Indispensable for crop growth & development (cell division) • Promotes tillering, canopy and stalk development • Promotes root penetration and proliferation • Adequate P [ 3 -4 mg/liter ] in cane juice is necessary for proper clarification • Phosphorus deficiency causes - reduction in inter-nodal length, Delay in canopy closure and Reduction root surface area Ref: Relative requirement of NPK at different crop growth stages of sugarcane (Bachchhav, 2005)
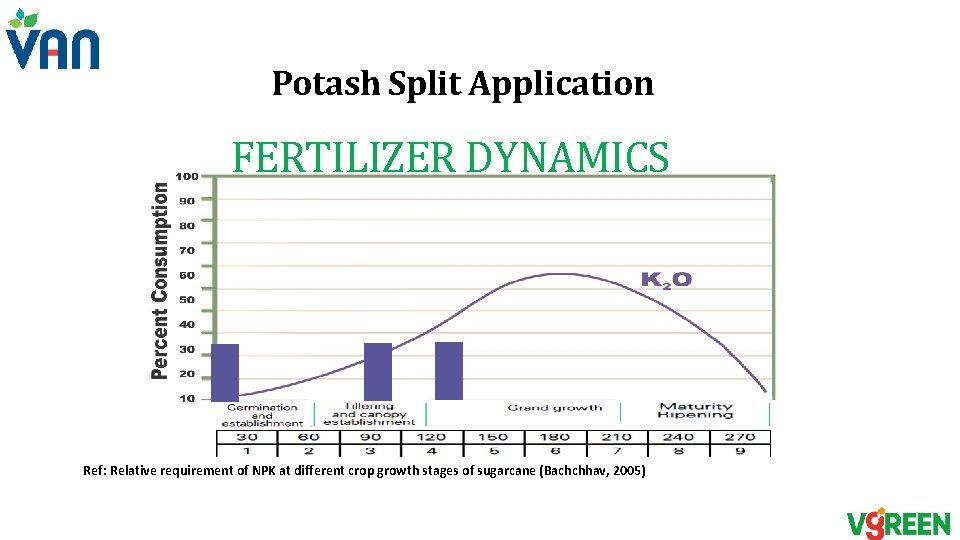
POTASH SPLIT APPLICATION Basal dose (0. 5 -1 Bag SOP) is a must FERTILIZER DYNAMICS Split application of K 2 O during tillering and growth Ø Crop uses K 2 O from its start but major req. at later stages Ø K 2 O major uptake -“tillering to grand growth” Ø K 2 O major performance -“grand growth to maturity” Ref: Relative requirement of NPK at different crop growth stages of sugarcane (Bachchhav, 2005)
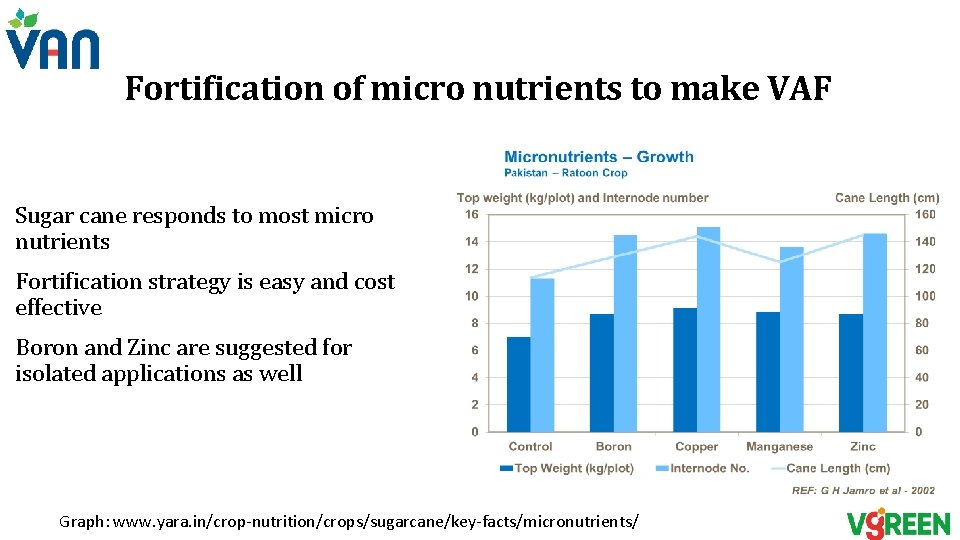
Fortification of micro nutrients to make VAF Sugar cane responds to most micro nutrients Fortification strategy is easy and cost effective Boron and Zinc are suggested for isolated applications as well Graph: www. yara. in/crop-nutrition/crops/sugarcane/key-facts/micronutrients/