Agronomic Spatial Variability and Resolution Spatial Variability Sampling

Agronomic Spatial Variability and Resolution Spatial Variability Sampling Strategies

Sampling Strategies • Random Sampling - Sample the entire field randomly and composite the sample. • Stratified Random Sampling - Divide the field into zones or areas based on agronomic reasons. Randomly sample and composite samples with the zone. • Grid Sampling - Sample at a fixed interval or grid. Treat each the entire cell or field element based on the sample from that cell. OR Use some interpolation scheme to predict values between sample points.

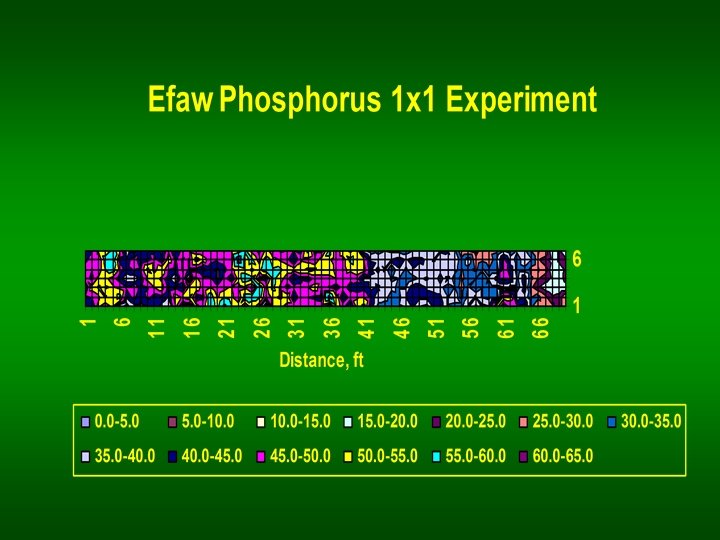
Field Element or Cell Size 6 x 66 6 x 6 3 x 3 2 x 2 7 x 70 Random Sampling Fixed Interval or Grid Sampling Stratified Random Sampling Zone Width

Location of Sampled Area for Three Sampling Strategies No. Samples/ Replication Row Sampled Random Sampling 1 st Sample Zone Fixed Interval or Stratified Random Interval Between Samples Fixed Interval Sampling 1 1 -70 70 2 1 -70 1 -35 35 5 1 -70 1 -14 14 7 1 -70 1 -10 10 10 1 -7 7 14 1 -70 1 -5 5

Total Soil N - Burneyville Sample Strategy Error – Sampling Strategy by Sample Size 1 % 2 5 7 10 14 ______________%______________ Random 15. 9 --- --- --- Fixed Interval 16. 4 --- --- --- Stratified Random 11. 7 --- --- --- LSD. 05 Mean LSD. 05 2. 1 _____________ N. S. ______________ 23. 5 20. 3 13. 3 11. 7 9. 8 9. 3 _____________ 2. 1______________

Phosphorus - Burneyville Sample Strategy Error – Sampling Strategy by Sample Size 1 % 2 5 7 10 14 ______________%______________ Random 16. 6 39. 6 28. 6 16. 0 12. 3 10. 2 9. 8 Fixed Interval 22. 7 35. 1 28. 8 21. 1 15. 6 19. 0 16. 3 Stratified Random 19. 4 22. 5 24. 6 11. 8 15. 1 14. 9 10. 7 LSD. 05 Mean LSD. 05 3. 1 _____________ 7. 6______________ 32. 4 27. 4 16. 3 14. 7 12. 3 _____________ 4. 4______________

Potassium - Burneyville Sample Strategy Error – Sampling Strategy by Sample Size 1 % 2 5 7 10 14 ______________%______________ Random 11. 9 25. 5 17. 5 10. 7 9. 7 8. 5 6. 1 Fixed Interval 17. 5 29. 2 23. 1 20. 3 14. 3 13. 3 Stratified Random 13. 0 17. 5 9. 6 6. 3 6. 1 LSD. 05 Mean LSD. 05 2. 5 _____________ 6. 1______________ 21. 8 21. 4 14. 4 13. 2 9. 7 8. 5 _____________ 3. 5______________

Soil Organic Carbon - Burneyville Sample Strategy Error – Sampling Strategy by Sample Size 1 % 2 5 7 10 14 ______________%______________ Random 13. 3 24. 1 19. 6 11. 1 9. 2 6. 7 6. 4 Fixed Interval 18. 4 20. 1 28. 5 16. 1 16. 8 14. 7 15. 0 Stratified Random 12. 8 23. 4 24. 3 9. 0 7. 3 6. 3 LSD. 05 Mean LSD. 05 2. 4 _____________ 5. 8______________ 22. 6 24. 1 12. 2 11. 6 9. 3 _____________ 3. 3______________

Soil p. H - Burneyville Sample Strategy Error – Sampling Strategy by Sample Size 1 % 2 5 7 10 14 ______________%______________ Random 1. 6 --- --- --- Fixed Interval 2. 2 --- --- --- Stratified Random 1. 5 --- --- --- LSD. 05 0. 3 Mean LSD. 05 _____________ N. S. ______________ 3. 5 2. 2 1. 8 1. 5 1. 2 1. 0 _____________ 0. 5______________

Total Soil N - Efaw Sample Strategy Error – Sampling Strategy by Sample Size 1 % 2 5 7 10 14 ______________%______________ Random 6. 2 13. 3 8. 2 5. 2 3. 8 3. 7 3. 2 Fixed Interval 7. 2 9. 7 10. 0 7. 2 5. 7 5. 6 5. 1 Stratified Random 3. 9 6. 8 5. 1 3. 4 2. 2 LSD. 05 0. 9 Mean LSD. 05 _____________ 2. 2______________ 9. 9 7. 8 5. 3 4. 3 3. 9 3. 5 _____________ 2. 2______________

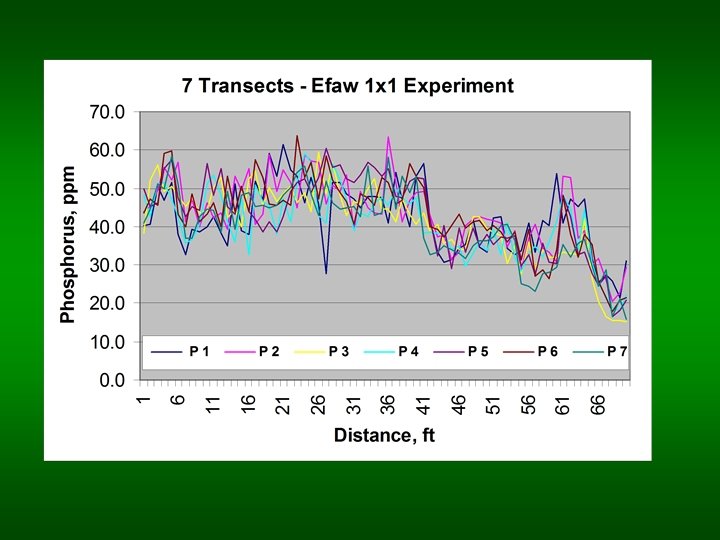
Phosphorus - Efaw Sample Strategy Error – Sampling Strategy by Sample Size 1 % 2 5 7 10 14 ______________%______________ Random 9. 0 16. 6 11. 0 9. 3 6. 3 5. 7 5. 0 Fixed Interval 12. 2 19. 9 15. 4 12. 9 9. 0 3. 0 Stratified Random 6. 5 17. 0 7. 5 5. 3 3. 4 3. 7 2. 2 LSD. 05 1. 3 _____________ 3. 3______________ Mean LSD. 05 17. 8 11. 3 9. 2 7. 6 6. 1 3. 4 _____________ 1. 9______________

Potassium - Efaw Sample Strategy Error – Sampling Strategy by Sample Size 1 % 2 5 7 10 14 ______________%______________ Random 11. 3 21. 7 16. 8 10. 6 8. 3 6. 3 4. 3 Fixed Interval 14. 7 24. 4 24. 2 11. 2 10. 3 9. 5 8. 8 Stratified Random 10. 4 18. 5 13. 3 8. 0 8. 8 7. 6 6. 2 LSD. 05 Mean LSD. 05 2. 3 _____________ 5. 6______________ 21. 5 18. 1 9. 9 9. 1 7. 8 6. 5 _____________ 3. 2______________

Soil Organic Carbon - Efaw Sample Strategy Error – Sampling Strategy by Sample Size 1 % 2 5 7 10 14 ______________%______________ Random 4. 2 --- --- --- Fixed Interval 9. 3 --- --- --- Stratified Random 5. 1 --- --- --- LSD. 05 1. 2 Mean LSD. 05 _____________ N. S. ______________ 10. 0 7. 4 5. 5 1. 7 4. 5 4. 1

Soil p. H - Efaw Sample Strategy Error – Sampling Strategy by Sample Size 1 % 2 5 7 10 14 ______________%______________ Random 1. 2 2. 0 1. 5 1. 3 0. 9 0. 8 0. 6 Fixed Interval 1. 7 2. 3 2. 0 1. 6 1. 7 1. 8 0. 9 Stratified Random 1. 0 2. 5 1. 2 0. 5 0. 7 0. 4 0. 5 LSD. 05 0. 2 Mean LSD. 05 _____________ 0. 5______________ 2. 3 1. 6 1. 1 1. 0 0. 7 _____________ 0. 3______________

Number of randomly selected samples required to reach 10, 5, and 2 % error from the true average value with a 90% probability Number of Samples Variable Location C. V. Total Soil N Burneyville 31. 2 11 41 81 Efaw 12. 3 --- 6 52. 1 29 92 270 Efaw 22. 9 5 22 105 Burneyville 28. 9 10 35 140 Efaw 29. 4 10 35 140 Burneyville 32. 2 17 54 165 Efaw 14. 1 2 8 43 Burneyville 4. 2 --- 4 Efaw 3. 2 --- 3 Phosphorus Burneyville Potassium Organic C p. H 10% Error 5% Error 2% Error

Conclusions • Random sampling and stratified random sampling strategies require a similar number of samples to precisely describe the mean value of the soil variables measured in the 7 ft by 70 ft area. • Fixed interval sampling required more samples to produce the same precision as random or stratified random sampling. • The OSU recommendation of collecting 15 to 20 soil samples and averaging them should give us an estimate within 5 to 10% of the true mean value.

Conclusions • Stratified random sampling may provide a more precise measure of the true mean, when it is known that in local regions the measured value is related and not randomly distributed.
- Slides: 20