Agroclimatologa y el Riego sustentable Eric Harmsen Ph

Agroclimatología y el Riego sustentable Eric Harmsen, Ph. D. Professor, Dept. of Agricultural and Biosystems Engineering UPR-RUM This presentation is available at the following web address: http: //academic. uprm. edu/hdc/http: //academic. uprm. edu/ hdc/documents/Eric_Harmsen_5 -17 -2003

What is the problem and why do I care? • There is antidotal evidence that many farmers throughout the world do not employ scientific methods for scheduling irrigation for their crops. • Instead, the water supply is turned on for an arbitrary amount of time without knowing whether the amount of water applied is too much or too little. • Over application of water can lead to the waste of water, energy, chemicals and money, and also may lead to the contamination of ground and surface waters. Over application of water can further lead to leaching of fertilizers past the root zone and water logging, which will result in lower crop yields. • Under-application of irrigation water can lead to water stress with reduced crop yields and a loss of revenue to the grower.

How much water and money are we talking about?

The Cost of Over-Applying Irrigation Water • Assume the following: n Small 10 -acre farm grows pumpkin n Estimated consumptive use (CU) for season = 500 mm n Actual potential CU for season = 400 mm n Overall cost of water = $30/acre-ft (considering only: cost of water and electricity) n Assume the normalized yield vs. CU curve in the next slide is applicable. n Value of a typical Calibaza crop (net income)* = $1, 243/acre. *Conjunto Tecnológico para la producción de Calabaza, UPR Experment Station, Publication 155, revised 2012
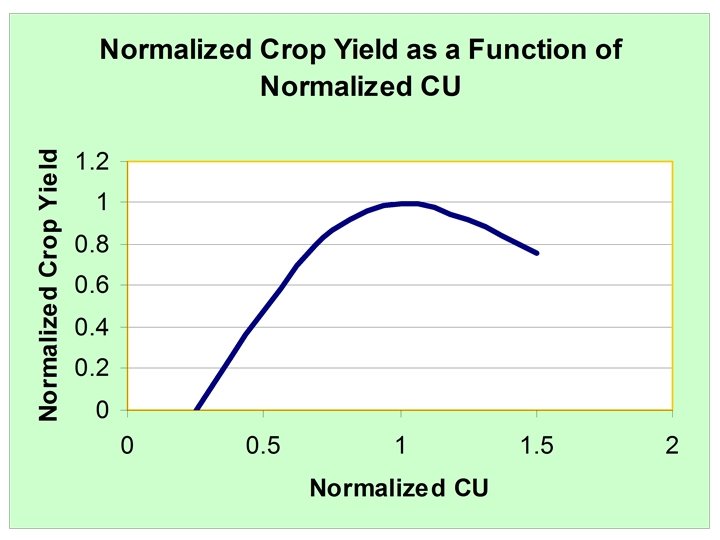

Example continued • Results: n Excess water applied = 100 mm = 1. 07 million gallons = 3 acre-ft (lost to groundwater) n Normalized CU = 1. 25, therefore normalized yield = 0. 9 (or 0. 1 loss) n Potential $ LOST = cost of water + lost yield = 3 ac-ft x $30/ac-ft + [0. 1*$1, 243/ac] x 10 ac = $1, 333 n Agr. Chemicals are leached to groundwater (cost was not included in calcluation). Groundwater was potentially contaminated

Cost of Under-Applying Irrigation Water • Assume the following: n Same pumpkin farm (10 -acres) n Estimated CU for season = 300 mm n Actual potential CU for season = 400 mm n Assume the normalized yield vs. CU curve is applicable. n Value of a typical Calibaza crop* = $1, 243/acre. *Conjunto Tecnológico para la producción de Calabaza, UPR Experment Station, Publication 155, revised 2012

Example continued • Results – Water deficit = 100 mm – With a normalized CU of 0. 75, the normalized yield = 0. 85 (or 0. 15 loss) – Potential $ LOST = lost yield = [0. 15*$1, 243/ac] x 10 ac = $1, 864 could pay your daughter’s university tuition or pay her rent for 6 months

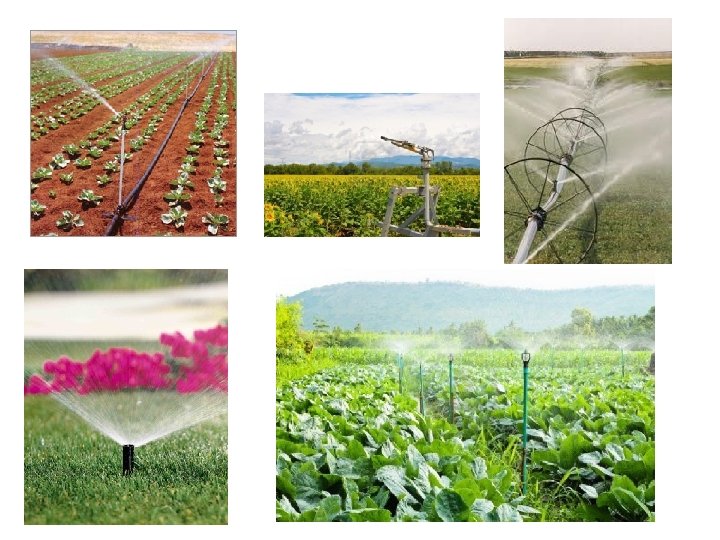
How can I apply water to my plants? • Different types of irrigation systems – Surface Irrigation – Sprinkler Irrigation – Drip Irrigation – Subsurface Irrigation – Condensation Method

Surface

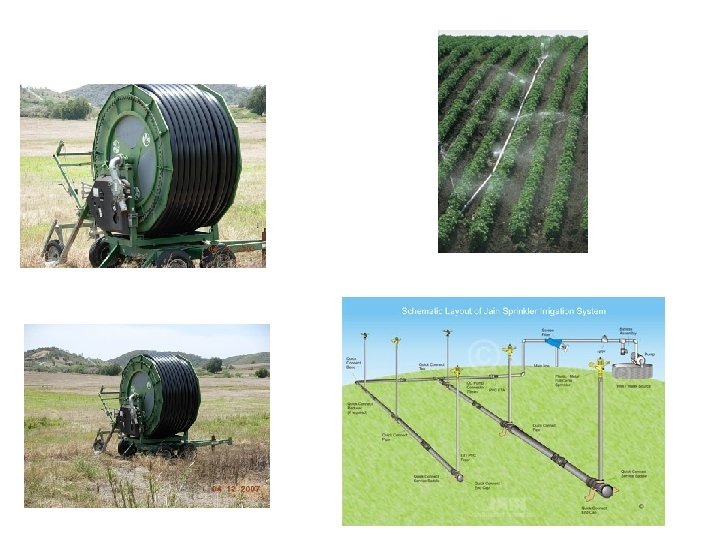
Sprinkler

Drip
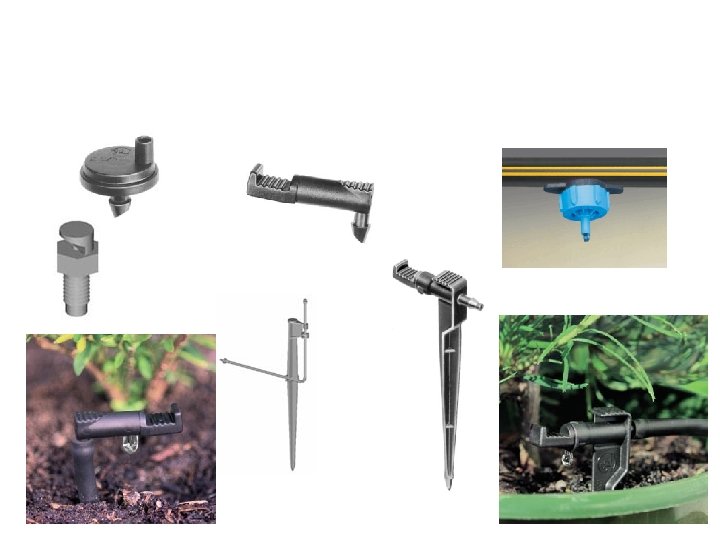

Irrigation system accessories

Fertigation

Drip Irrigation Laboratory at UPRM

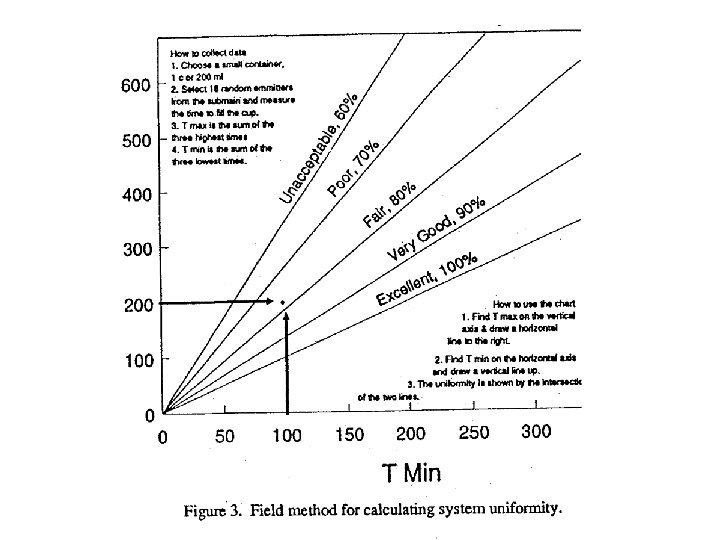
Drip Distribution Uniformity • Distribution Uniformity is critically important in Drip Irrigation • Why? • Sometimes a plant only has one emitter. If the emitter is plugged, then the plant may die. • If water is applied non-uniformly, then fertilizer will also be applied non-uniformly.

Subsurface

Condensation
 Ø To reduce the amount of irrigation water by")
Commercial dew condensation in (Israel) Ø To reduce the amount of irrigation water by as much as 50 to 90% Tal-Ya Water Technologies, Inc. info@tal-ya. com
 • Broasis waterboxx www. aquaproholland. com")
Commercially available dew condenser (Holland) • Broasis waterboxx www. aquaproholland. com

Fog collection projects www. foguest. org § Chile ( fanel 150 to 750 liters of water a day) with 100 fog collectors = 15, 000 L/ year • Peru ( 2271 liters of water a day )with 7 fog collectors.

Appropriate Technology


Water Supply

Groundwater Pumps

Irrigation Ponds

Other Technologies

How much water should I apply? • Evapotranspiration = evaporation from soil and wet surfaces + transpiration from leaves • Evapotranspiration = plant water requirement
 Over application of water Under-application of water • Waste")
Why Do I Care? (reminder) Over application of water Under-application of water • Waste of • Lead to Water energy chemicals money, may lead to the contamination of ground and surface waters. – leaching of fertilizers past the root zone – water logging – lower crop yields. – – – Crop water stress – reduced crop yields – loss of revenue to the grower “I wish I would have applied more irrigation. ”

Intro to Agroclimatology • Definition of climate, weather meteorology • Weather parameters – Temperature – Humidity – Wind speed and direction – Solar radiation – Optional parameters that can be measured by weather stations • Soil moisture, leaf wetness, net radiation, soil heat flux

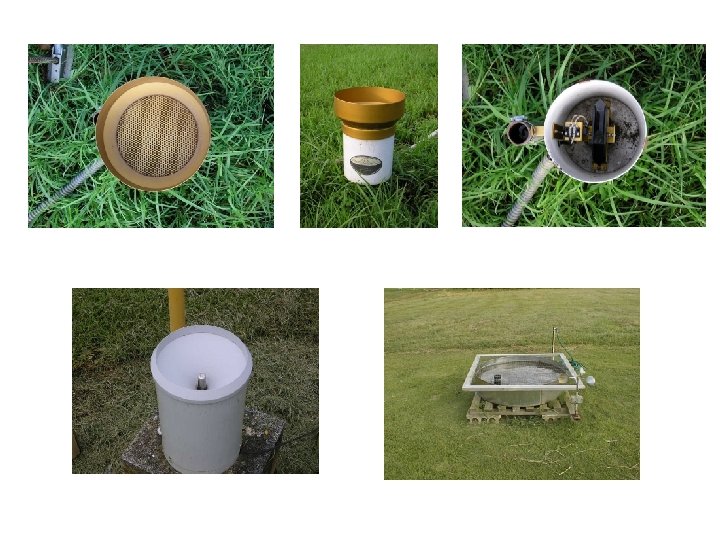
Weather Station Sensors

Many weather stations will calcuate the daily Evapotranspiration

Natural Resource Conservation Service SCAN Stations http: //www. wcc. nrcs. usda. gov/scan/Puerto_Rico/puerto_rico. html

National Weather Service – San Juan http: //www. srh. noaa. gov/sju/

Soils Clay Sand High Water Holding Capacity Low Water Holding Capacity

So how can I determine the crop water requirement and then apply the correct amount of irrigation? • Here is a web-based method that can be used anywhere within Puerto Rico • The method will be introduced by way of an example • Detailed Example : Determine the irrigation requirement for the 5 day period, February 15 -19, 2012, for a tomato crop in Juana Diaz, Puerto Rico. Table 1 summarizes the information used in the example problem. Table 2 provides the important web addresses necessary for obtaining data for use in the example problem. Table 3 shows the crop growth stage and crop coefficient (Kc) data for the example problem.

Table 1. Information used in example problem. Table 2. Internet URLs for example problem. Table 3. Crop growth stage and crop coefficient data for example problem.

Determine Crop Water Requirement ET = Kc ETo where ET = evapotranspiration = crop water requirement Kc = Crop Coefficient (unique for every crop) ETo = Reference Evapotranspiration

Rainfall A rain gauge is not available on or near the farm; therefore, it is necessary to obtain rainfall information from the NEXRAD radar. Inspection of the rainfall maps at the URL provided in Table 2 indicates that there was no rainfall during the five day period. Therefore, all of the crop water requirement will have to be satisfied with irrigation.
 • The next step is to determine the reference evapotranspiration (ETo)")
Reference Evapotranspiration (ETo) • The next step is to determine the reference evapotranspiration (ETo) for the five day period. The next slide shows the estimated reference evapotranspiration for Puerto Rico on February 15, 2012 obtained from the web address provided in Table 2. • The estimated ETo for the site location on 15 Feb. , 2012 is 2. 95 mm. • Using a similar procedure, the ETo values for Feb. 16, 17, 18 and 19 are 2. 8 mm, 3. 1 mm, 3. 5 mm and 3. 7 mm, respectively. Summing up the ETo values comes to a total reference evapotranspiration (for the five days) of 16. 1 mm.

Reference Evapotranspiration

Crop Coefficient • The Kc value of 0. 85 was obtained from the figure in the next slide. Crop coefficient curve for the example problem. The heavy dashed line applies to the example problem with day of season 46 -50 (i. e. , Feb 15 -19) corresponding to an approximate crop coefficient of 0. 85 (vertical axis).
 for")
Crop Water Requirement ET = Kc ETo • The crop water requirement (ET) for the time period can now be estimated as follows: ETc = Kc ETo = (0. 85)(16. 1 mm) = 13. 7 mm.

Crop Coefficient Curve for Tomato Crop coefficient curve for the example problem. The heavy dashed line applies to the example problem with day of season 46 -50 (i. e. , Feb 15 -19) corresponding to an approximate crop coefficient of 0. 85 (vertical axis).

Number of hours to run the pump to satisfy the crop water requirement • The final step is to determine the number of hours that the pump should be run to apply the 13. 7 mm of water. • A form of the well-known irrigation equation (Fangmeier et al. , 2005) can be used: T = 17. 817 x [D x A]/[Q x eff] • where T is time in hours, D is depth of irrigation water in mm, A is effective field area in acres, Q is flow rate in gallons per minute and eff is irrigation system efficiency. • Using D = 16. 1 mm, A = 10 acres, Q = 300 gallons per minute and eff = 0. 85, yields: T = 17. 817 x [16. 1 x 10] / [300 x 0. 85] = 11. 25 hours.

In Conclusion • Operating the pump for 11. 25 hours will satisfy the crop water requirement. • The approach presented here is relatively simple and the near-real time data is available to any farmer in Puerto Rico with internet access.
- Slides: 52