Agricultural Economics Lecture 1 What is Agricultural Economics


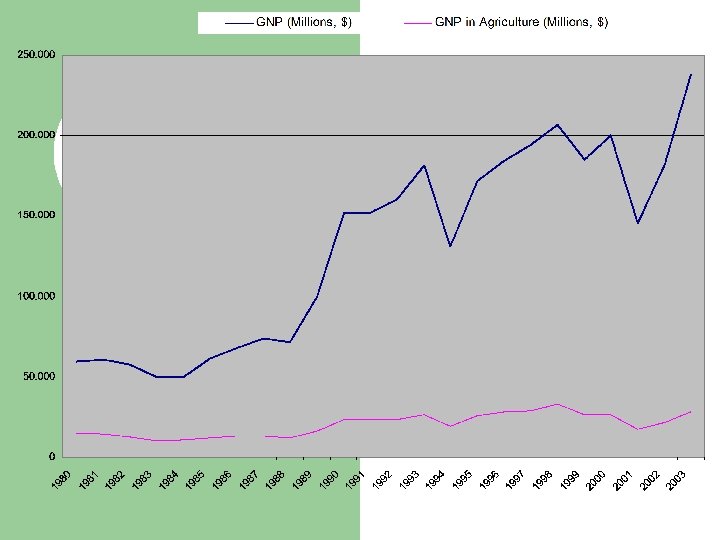
 Per Capita GDP ($) 1980 59. 418 15.")
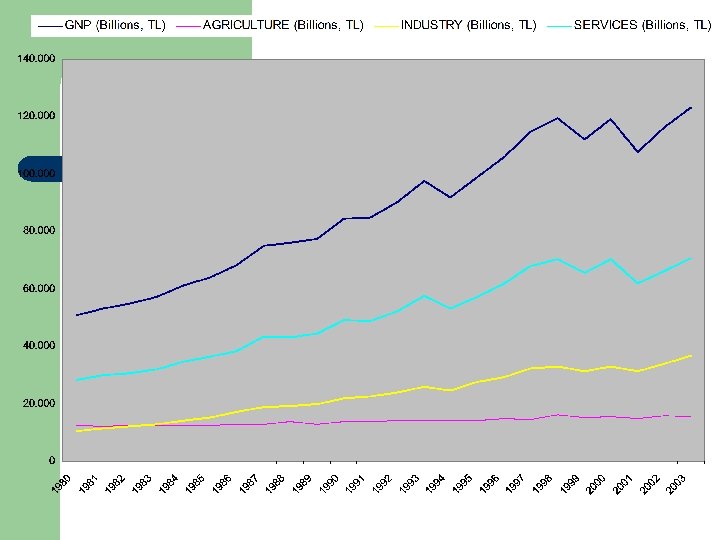
 AGRICULTURE (billions, TL) INDUSTRY (billions, TL) SERVICES (billions, TL) 1980")
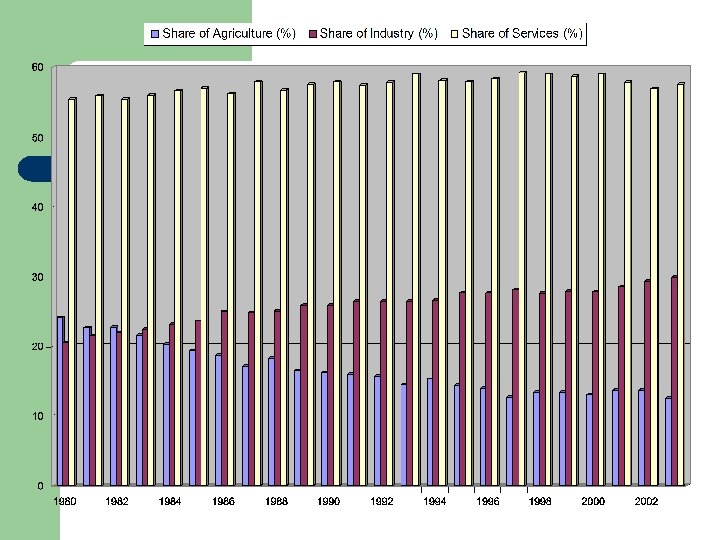
 SHARE OF INDUSTRY (%) SHARE OF SERVICES (%) 1980")
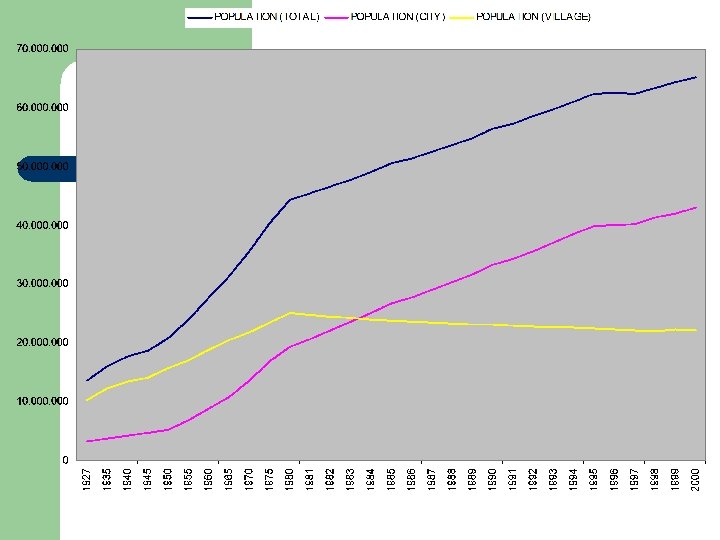
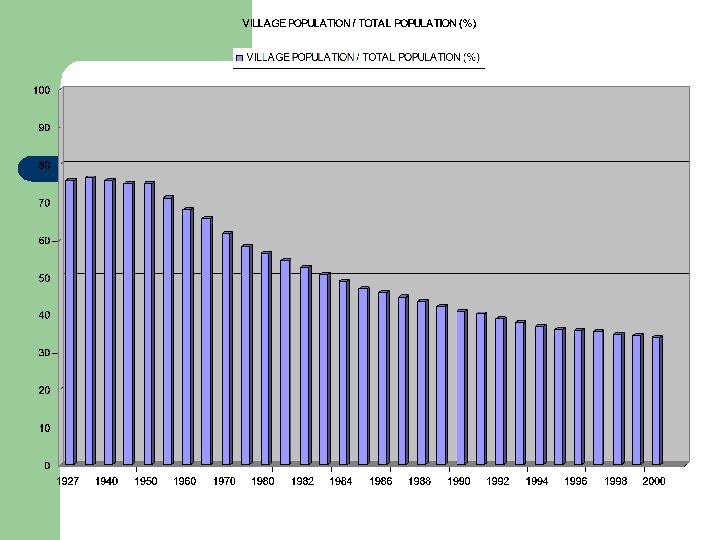
 POPULATION (CITY) POPULATION (VILLAGE) VILLAGE / TOTAL (%) 1980 44.")
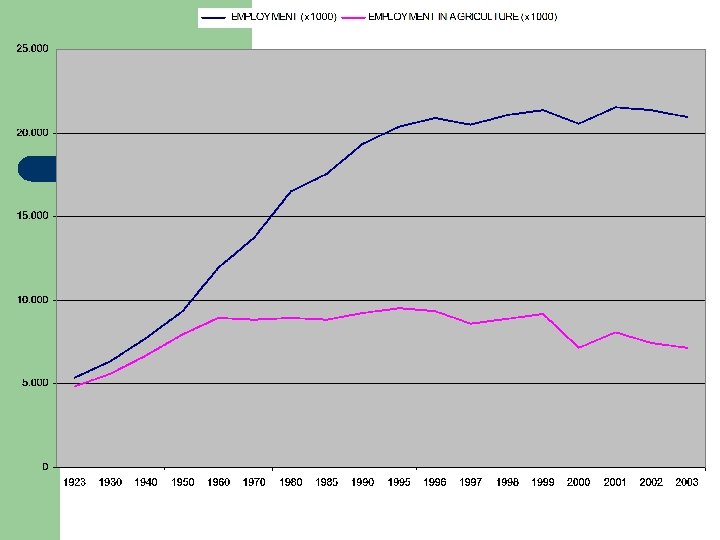
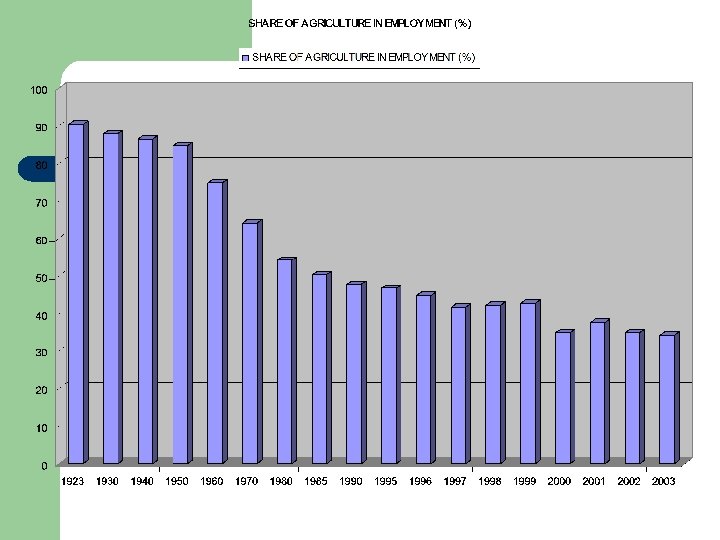
 EMPLOYMENT IN AGRICULTURE (x 1000) SHARE OF AGRICULTURE IN")


- Slides: 35
Agricultural Economics Lecture 1
What is Agricultural Economics? l“…an applied social science that deals with how producers, consumers and societies use scarce resources in the production, processing, marketing and consumption of food and fiber products”.
What is Agricultural Development? l Here development means what happens over time l change, evolution, growth l it may be an improvement… or not. l We’ll focus on what happens to the whole country l to the entire agricultural sector, l given overall economic development: – higher income, production and consumption – improved health and life expectancy – and many other changes…
l A key change over time is that people get richer, so when we talk of “more” or “less” developed, what we usually mean is “richer” or “poorer”. l We will usually be descriptive, asking: – what happens over time, l as countries get richer? – what differs across countries l between rich & poor? l And sometimes we will be prescriptive, asking – what should be done, l to help people get what they want?
l l Development involves accumulation, that economists call “capital”: – physical capital (houses, roads, machines) – human capital (education, health) – institutional capital (“rules of the game”) The accumulation of capital makes it more abundant and cheaper. But accumulation doesn’t happen automatically. To build up capital, people must save and invest from one year to the next.
l l Development also involves innovation, which economists call “technical change”: – new physical things (seeds, chemicals, etc. ) – new ideas (crop rotations, etc. ) – new institutions (futures markets, etc. ) Innovation makes it possible to produce more of what people want, from the resources they have. But innovation doesn’t happen automatically. To innovate, people must be able to change what they do.
Agriculture as a share of GDP vs. GNP per capita, 1989 Source: GW Norton and J Alwang, Introduction to Economics of Agricultural Development. New York: Mc. Graw Hill, 1993.
Agriculture as a share of employment vs. GNP per capita, 1985 Source: GW Norton and J Alwang, Introduction to Economics of Agricultural Development. New York: Mc. Graw Hill, 1993.
Percent of income spent on food vs. GNP per capita, 1980 s Source: GW Norton and J Alwang, Introduction to Economics of Agricultural Development. New York: Mc. Graw Hill, 1993.
Years Agricultural GDP (Millions, $) Per Capita GDP ($) 1980 59. 418 15. 323 1. 337 1981 60. 641 14. 430 1. 332 1982 57. 663 12. 685 1. 235 1983 49. 761 10. 387 1. 040 1984 50. 097 10. 539 1. 021 1985 61. 586 12. 039 1. 216 1986 67. 714 13. 186 1. 317 1987 73. 668 13. 074 1. 402 1988 71. 249 12. 302 1. 326 1989 99. 668 16. 312 1. 816 1990 152. 306 23. 303 2. 715 1991 152. 133 23. 276 2. 666 1992 160. 237 23. 234 2. 766 1993 181. 788 26. 359 3. 091 1994 130. 876 18. 977 2. 192 1995 171. 841 25. 776 2. 835 1996 184. 608 28. 060 3. 000 1997 194. 094 29. 114 3. 105 1998 206. 552 33. 116 3. 255 1999 185. 267 26. 328 2. 879 2000 200. 002 26. 441 2. 965 2001 145. 693 17. 540 2. 123 2002 181. 885 21. 360 2. 612 2003 238. 051 28. 087 3. 366
YEARS GNP (billions, TL) AGRICULTURE (billions, TL) INDUSTRY (billions, TL) SERVICES (billions, TL) 1980 50. 870 12. 288 10. 424 28. 158 1981 53. 317 12. 067 11. 454 29. 797 1982 54. 963 12. 463 12. 033 30. 467 1983 57. 279 12. 359 12. 837 32. 082 1984 61. 350 12. 438 14. 188 34. 724 1985 63. 989 12. 396 15. 116 36. 477 1986 68. 315 12. 837 17. 100 38. 378 1987 75. 019 12. 883 18. 680 43. 457 1988 76. 108 13. 911 19. 074 43. 123 1989 77. 347 12. 845 20. 008 44. 494 1990 84. 592 13. 788 21. 909 48. 979 1991 84. 887 13. 667 22. 495 48. 725 1992 90. 323 14. 271 23. 936 52. 207 1993 97. 677 14. 163 25. 884 57. 629 1994 91. 733 14. 035 24. 401 53. 297 1995 99. 028 14. 260 27. 431 57. 337 1996 106. 080 14. 851 29. 384 61. 845 1997 114. 874 14. 589 32. 280 68. 005 1998 119. 303 15. 987 32. 928 70. 389 1999 112. 044 15. 014 31. 260 65. 770 2000 119. 144 15. 608 33. 122 70. 295 2001 107. 783 14. 923 31. 207 61. 920 2002 116. 338 15. 948 34. 142 66. 248 2003 123. 165 15. 548 36. 793 70. 824
YEARS SHARE OF AGRICULTURE (%) SHARE OF INDUSTRY (%) SHARE OF SERVICES (%) 1980 24, 2 20, 5 55, 4 1981 22, 6 21, 5 55, 9 1982 22, 7 21, 9 55, 4 1983 21, 6 22, 4 56 1984 20, 3 23, 1 56, 6 1985 19, 4 23, 6 57 1986 18, 8 25 56, 2 1987 17, 2 24, 9 57, 9 1988 18, 3 25, 1 56, 7 1989 16, 6 25, 9 57, 5 1990 16, 3 25, 9 57, 9 1991 16, 1 26, 5 57, 4 1992 15, 8 26, 5 57, 8 1993 14, 5 26, 5 59 1994 15, 3 26, 6 58, 1 1995 14, 4 27, 7 57, 9 1996 14 27, 7 58, 3 1997 12, 7 28, 1 59, 2 1998 13, 4 27, 6 59 1999 13, 4 27, 9 58, 7 2000 13, 1 27, 8 59 2001 13, 7 28, 5 57, 8 2002 13, 7 29, 3 56, 9 2003 12, 6 29, 9 57, 5
YEARS POPULATION (TOTAL) POPULATION (CITY) POPULATION (VILLAGE) VILLAGE / TOTAL (%) 1980 44. 437. 000 19. 345. 050 25. 091. 950 56, 47 1981 45. 540. 000 20. 770. 000 24. 770. 000 54, 39 1982 46. 688. 000 22. 179. 000 24. 509. 000 52, 5 1983 47. 864. 000 23. 613. 000 24. 251. 000 50, 67 1984 49. 070. 000 25. 074. 000 23. 996. 000 48, 9 1985 50. 664. 000 26. 866. 000 23. 798. 000 46, 97 1986 51. 433. 000 27. 792. 000 23. 641. 000 45, 96 1987 52. 561. 000 29. 051. 000 23. 510. 000 44, 73 1988 53. 715. 000 30. 336. 000 23. 379. 000 43, 52 1989 54. 893. 000 31. 643. 000 23. 250. 000 42, 36 1990 56. 473. 000 33. 327. 000 23. 146. 000 40, 99 1991 57. 326. 000 34. 333. 000 22. 993. 000 40, 11 1992 58. 584. 000 35. 718. 000 22. 866. 000 39, 03 1993 59. 869. 000 37. 130. 000 22. 739. 000 37, 98 1994 61. 183. 000 38. 570. 000 22. 613. 000 36, 96 1995 62. 400. 000 39. 912. 000 22. 488. 000 36, 04 1996 62. 526. 000 40. 163. 000 22. 363. 000 35, 77 1997 62. 510. 000 40. 330. 324 22. 179. 676 35, 48 1998 63. 451. 000 41. 351. 000 22. 100. 000 34, 83 1999 64. 385. 000 42. 107. 790 22. 277. 210 34, 6 2000 65. 311. 000 43. 105. 260 22. 205. 740 34
YEARS EMPLOYMENT (x 1000) EMPLOYMENT IN AGRICULTURE (x 1000) SHARE OF AGRICULTURE IN EMPLOYMENT (%) 1923 5. 371 4. 850 90, 3 1930 6. 372 5. 605 87, 96 1940 7. 745 6. 699 86, 49 1950 9. 363 7. 939 84, 79 1960 11. 945 8. 940 74, 84 1970 13. 768 8. 835 64, 17 1980 16. 523 8. 960 54, 23 1985 17. 547 8. 837 50, 36 1990 19. 323 9. 233 47, 78 1995 20. 394 9. 538 46, 77 1996 20. 894 9. 379 44, 89 1997 20. 505 8. 584 41, 86 1998 21. 084 8. 918 42, 3 1999 21. 391 9. 152 42, 78 2000 20. 578 7. 187 34, 93 2001 21. 524 8. 089 37, 58 2002 21. 354 7. 458 34, 93 2003 20. 970 7. 185 34, 26
l l l 1. AGRICULTURE IS THE BASIC OCCUPATION OF HUMANKIND. 2. RURAL LIFE IS MORALLY SUPERIOR TO URBAN LIFE. 3. A NATION OF SMALL INDEPENDENT (FAMILY) FARMERS IS THE PROPER BASIS FOR A DEMOCRATIC SOCIETY.
The Functions of Agriculture Function 1: Provide food for humankind Malthus’ theory of the capacity of world to feed humankind: Geometric increase in human population vs. arithmetic increase in food poduction.
l l Function 2: Provide raw material for the industry Function 3: Provide opportunity for rural lanscape Function 4: Source for capital accumulation for development Function 5: Source of labor for the industry
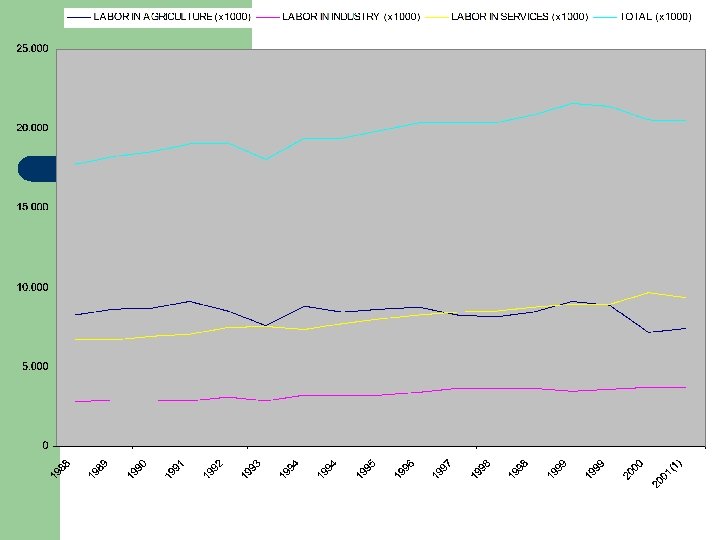
Fisher Clark's Theory of Structural Change Two economists, Fisher and Clark, put forward the idea that an economy would have three stages of production 1. Primary production is concerned with the extraction of raw materials through agriculture, mining, fishing, and forestry. Lowincome countries are assumed to be predominantly dominated by primary production. 2. Secondary production concerned with industrial production through manufacturing and construction. Middle income countries are often dominated by their secondary sector. 3. Tertiary production concerned with the provision of services such as education and tourism. In high-income countries the tertiary sector dominates. Indeed having a large tertiary sector is seen as a sign of economic maturity in the development process. l
l l l Countries are assumed to first pass through the primary production stage then the secondary stage and finally the tertiary stage. As economies develop and incomes rise then the demand for agricultural goods will increase but due to their low income elasticity of demand at a proportionally lower rate than income. However, the demand for manufactured goods will have a higher income elasticity of demand. So as incomes grow further the demand for these goods will grow at a proportionately higher rate. Hence the secondary industry will grow. As incomes continue to grow then people will start to consume more services as these have an even higher income elasticity of demand. Thus the tertiary sector will then grow and develop.
Why Does Agriculture’s Share Declines in Economic Development? 1. Income elasticity of demand for agricultural products Engel’s law l 2. Some of the raw materials are now being produced by the industry itself l 3. Diminishing returns to scale in agriculture l 4. Agricultural product prices are generally lower than instrial product prices l
l Almost always, agriculture declines – – – l l as a share of employment as a share of GDP or GNP (national income) as a share of consumer expenditure Do farmers get poorer? Are there fewer farmers?
Agricultural Policy l l l Policy is guiding principle leading to a course of action that is pursued by the government. Policies and programs Major forces for policy change: – – – – Instability Globalization Technology Food safety Environmeny Industrialization of agriculture Politics Unforseen events
What is Agricultural Policy? l A subset of public policy directed primarily but not exclusively at the farm and agribusiness sectors of society.
Agricultural policy applies to two markets: l l l l l 1. AGRICULTURAL INPUT MARKETS USE OF LAND OTHER NATURAL RESOURCES AGRICULTURAL CREDIT AND FINANCE LABOR INDUSTRIAL PRODUCTS 2. AGRICULTURAL OUTPUT MARKETS PRODUCTION CONSUMPTION MARKETING INTERNATIONAL TRADE
What Should Agricultural Policies Be? l Everyone involved in agriculture has his/her own idea of the answer to that question which is based on the interaction of FACTS, BELIEFS, and VALUES.
FACTS: l WHAT IS KNOWN WITH CERTAINTY. l DESCRIBE WHAT IS. l THERE CAN BE NO ARGUMENT. BELIEFS/MYTHS: l DESCRIBE WHAT PEOPLE THINKARE FACTS. VALUES: l CONCEPTS OF WHAT SHOULD BE.
l Facts, beliefs/myths, and values interact to provide motivation for the formulation and implementation of agricultural policy by the government. http: //agecon 2. tamu. edu/people/faculty/williams-gary/429/LEC 1. pdf