AGP ambulatory glucose profile Ambulatory Glucose Profile AGP
")
AGP (ambulatory glucose profile )
 O Single page, standardized report (similar to ECG) for interpreting")
Ambulatory Glucose Profile (AGP) O Single page, standardized report (similar to ECG) for interpreting a patient's daily glucose and insulin patterns. O O 1 -graphic O 2 -quantitative O * Developed by Drs. Roger Mazze and David Rodbard, with colleagues at the Albert Einstein College of Medicine n 1987 O AGP was initially used for representation of episodic selfmonito (SMBG). The first version included a glucose median and inter-quartile ranges graphed as a 24 hour day. Dr. Mazze brought the original AGP to the International Diabetes Center (IDC) in the late 1980's and since that time, IDC has built the AGP into the internationally recognized standard for glucose pattern reporting

O What does AGP reveal? ? ? O What the clinical/actionable decisions that could be taken by HCP; after reviewing AGP ? O AGP is one parameter –among many-indicated glucose variability – swinging-(GV) and stability which was not captured through normal SMBG…. .
 : the swings in the blood glucose between")
Glucose variability : Glycemic variability (GV) : the swings in the blood glucose between the maximum (peak) and minimum (nadir). GV : 1 -can contribute to the development of reactive oxygen species (ROS). 2 -when human umbilical endothelial cells are subjected to fluctuations of blood glucose, there is an increased activity of protein kinase C. Thus, there could be an independent role of GV in the pathogenesis of vascular complications of diabetes.
 ± standard deviation 2 - J")
O Glycemic variability indices : 1 -Mean (average) ± standard deviation 2 - J index 3 -Coefficient of variance (CV) 4 - Mean amplitude of glucose excursion (MAGE) 5 - 1, 5 -Anhydroglucitol 6 - Glycated albumin/glycosylated hemoglobin ratio
: A monosaccharide found in nearly all foods. Blood")
O 5 -Anhydroglucitol(1, 5 -AG, ): A monosaccharide found in nearly all foods. Blood concentrations of 1, 5 -AG decrease during times hyperglycemia above 180 mg/d. L, and return to normal levels after approximately 2 weeks in the absence of hyperglycemia. As a result, it can be used for people with either type-1 or type-2 diabetes mellitus to identify glycemic variability esp. if Hb. A 1 c is normal
 1 - albumin is glycosylated more rapidly than")
Glycated albumin/glycosylated hemoglobin ratio (GA: Hgs) 1 - albumin is glycosylated more rapidly than hemoglobin 2 -sensetive factor of glucose excursion 3 -Mostly in. TD 2 4 -related to carotid media thickness increase which is likely to be a predictor of micro vascular diseases

2 - J index: O index is a measure of quality of glycemic control based on the combination of information from the mean and SD calculated as 0. 001 × (mean + SD)
 : index provides an estimation of intraday glycemic")
The mean of daily differences (MODD) : index provides an estimation of intraday glycemic variability. This parameter is calculated as the mean of absolute differences between glucose values at corresponding time points of consecutive days.
: is similar to SD but assesses glucose variability")
Continuous overall net glycemic action (CONGA): is similar to SD but assesses glucose variability within a predetermined time window. Calculation of this parameter is based on the assessment of the differences between glucose values measured at regular time intervals, then on the SD of these differences.
 : experimental method that describes glucose variability of high frequency and")
Fractal dimension (FD) : experimental method that describes glucose variability of high frequency and small amplitude. The calculation is based on the changes of glucose values between subsequent measurements using the Higuchi algorithm

O Glycemic excursion: * classical estimation of glucose variability, prone to error and needs to be automated the amount that the blood glucose changes/increases in the target time. It's a very important thing in preventing diabetic complications. Measured by MAGE(mean amplitude of glycemic excursion) : O Small 22 -60 mg/100 ml(normal) O Medium 67 -82 mg/100 ml(stable diabetes) O Large 83 -116 mg/100 ml (unstable diabetes)

Glyculator “application designed to evaluate glycemic variability based on data collected by means of a CGM device. Like : 1 -MAGE 2 -J index 3 -SD (in different types) 4 -MODD 5 -COGNA 6 -FD 7 -%CV 8 -M value 9 -Mean 10 -Median

O Captur AGP and glucose variability………

O Captūr. AGP: system for producing research AGPs. The research AGP includes a second row of statistics: q Glucose Variability, q Glucose Exposure q Episodes close ups. The Captūr AGP system is able to produce SMBG, CGM and Insulin Pump + CGM reports. Captūr. AGPcan produce batched reports for different time periods, demographic sub populations and intervention arms. IDC provides AGP interpretation as well as research analytic reporting.
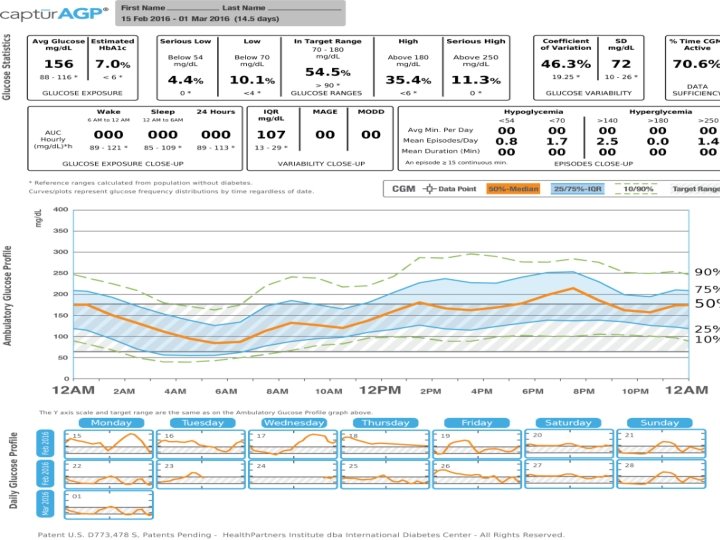

Extended Statistics -: Normally used in research, several of these will be blank if the data is from SMBG AUC Hourly: Measure of the space/ “area” beneath the median orange line; lower is better. Glucose exposures by period Wake: between 6 am and midnight Sleep: between midnight and 6 am 24 Hours: from midnight to midnight IQR (interquartile range): The range between the 75% and the 25% blue lines. The blue shaded area on the profile graph represents 50% of all the glucose measures. Ideally this shaded area is narrow, which shows less variation.
: Measures the distance from a glucose high point")
MAGE (Mean Amplitude of Glycemic Excursion): Measures the distance from a glucose high point to the low point or vice versa. This is the average of all excursions including the MAGE+ (going from low to high) and the MAGE– (going high to low); normally several per day. Lower is better. MODD (Mean of Daily Differences): Compares the glucose level between two different days to help you understand the glucose patterns day to day. A patient with a higher MODD, has glucose patterns that fluctuate more widely. Lower is better.
: Index (0 – 100) of how many and how")
LGBI (Low Blood Glucose Index): Index (0 – 100) of how many and how low glucose readings were in the measurement period. A high score means that there might be lots of mild low readings or a few very low readings or some of both. A low index is best. HBGI (High Blood Glucose Index): Index (0 – 100) of how many and how high glucose readings were in the measurement period. A high score means that there might be lots of mild high readings or a few very highs or some of both. A low index is best.

Episodes close up: Episodes start when readings are within one of these ranges for at least 15 minutes; episodes end when there is a reading that is in target (70 -180). Fewer episodes are best for all these measures. Avg. Min. per Day: How long in minutes the episodes of hypo- or hyperglycemia are per day on average Mean Episodes/Day: How many episodes occur per day on average Mean Duration (Min. ): How long the episodes last on average

AGP… …. . agai n
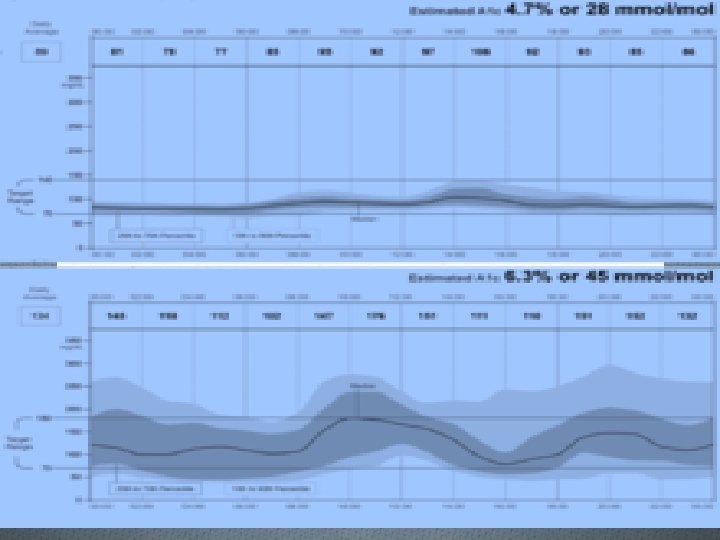

O CGM of FGM data are plotted by time ignoring date and subjected to smoothing using five frequency percentile curves: 10 th, 25 th, 50 th (median), 75 th and 90 th. The top panel is a person with normal glucose metabolism. The center (50 th percentile curve) dark line represents overall glucose exposure (mean 89 mg/d. L). The bottom panel is a person with type 1 diabetes (mean 134 mg/d. L). The AGP shows significant variability indicated by the darkened area on either side of the median (25 th-75 th percentile curves-known as inter-quartile range or IQR) is very wide when compared with the normal pattern in the top panel. The IQR represents the area in which 50% of the glucose values will fall. The lighter area on either side of the IQR represents the inter-decile range within which 80% of all values will fall (the area between 10 th to 90 th percentile curves). The target range, set between 70 -180 mg/d. L, in the bottom panel shows that overnight and mid-afternoon there is a risk of hypoglycemia, while mid-day there is a risk of hyperglycemia. Additionally, while the median curve in the top panel is almost flat, in the bottom panel it oscillates, indicating unstable glucose levels.

Two persons of different AGP : First one in mmo/L , three average readings : 7 10 4 Average e 1 c = 7 Second person in mmol/L, three average readings : 7 7 7 Average e 1 c = 7

O Exact HBa 1 c for different patients, however they experienced different glucose patterns. O Glucose fluctuation α long term diabetic complication (PERSISTENT HYPERS OR HYPO ACCELERATES INCIDENCE OF DIABETIC COMPLICATIONS ) and AGP HELPS TO ELEMINATE THOSE OR AT LEAST DELAY THEIR OCCURRENCE ) O AGP allows you to see more , consequently, Not to over treat hypos which may lead to hyper , on the other hand , discover hypos on advance which enable to take prompt /reasonable corrective action before it may occur

Diabetic complications acute chroni c
 b) c) O O O O O Acute: Hypoglycemia Hyperglycemic Hyperosmolar State")
O a) b) c) O O O O O Acute: Hypoglycemia Hyperglycemic Hyperosmolar State (HHS) Diabetic Ketoacidosis (DKA) Chronic: Vision loss or blindness Kidney damage or failure Nerve pain and damage Heart and blood vessel disease High blood pressure Dental problems Hand problems Foot problems

O Hyperglycemea and arthroscerosis O Atherosclerosis accounts for virtually 80% of all deaths among diabetic patients. Prolonged exposure to hyperglycemia is now recognized as a major factor in the pathogenesis of diabetic complications, including atherosclerosis. . Bec: O (1) Nonenzymatic glycosylation of proteins and lipids which can interfere with their normal function by disrupting molecular conformation, alter enzymatic activity, reduce degradative capacity, and interfere with receptor recognition. . The interaction of glycosylated proteins with their receptor results in the induction of oxidative stress and proinflammatory responses. O (2) Protein kinase C (PKC) activation with subsequent alteration in growth factor expression. O (3) O-linked glycosylation of various enzymes with perturbations in normal enzyme function. O (4) Hyperglycemia increases oxidative stress through several pathways : A major mechanism appears to be the overproduction of the superoxide anion (O-2 ) by the mitochondrial electron transport chain. (5) Hyperglycemia promotes inflammation through the induction of cytokine secretion by several cell types including monocytes and adipocytes.

O PERSISTENT HYPOGLYCEMEA O Insufficient blood sugar levels can cause a rapid heartbeat and heart palpitations. However, even if you have diabetes, you may not always have obvious symptoms of low blood sugar. It’s a condition called “hypoglycemia unawareness. ” This happens when you experience low blood sugar so often that it changes your body’s response to it. Normally, low blood sugar causes your body to release stress hormones, such as epinephrine. Epinephrine is responsible for those early warning signs, like hunger and shakiness. When low blood sugar happens too frequently, your body may stop releasing stress hormones (hypoglycemia-associated autonomic failure, or HAAF). That’s why it’s so important to check your blood sugar levels often.

In cells

SOMOGY I SYNDROM DOWN PHONOMENON Elevated glucose in the morning Nocturnal hypoglycemia Eu/hyper glycemia in the night Inappropriate basal insulin dose is a causative agent hormones surge in the morning caused glu. Level increase Could be prevented by snack intake before going to sleep/readjusting insulin doses eating regular meals can minimize it occurrence Both can be captured after reviewing AGP

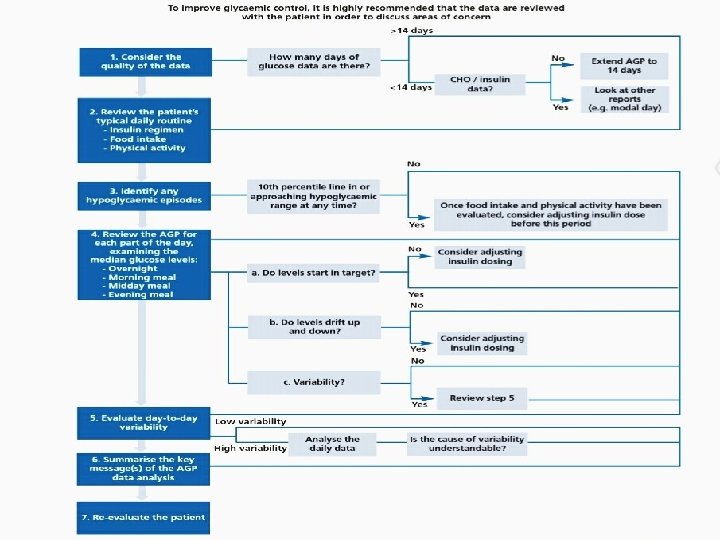
Initial assessment of AGP Q, C, A

There are key questions to ask in evaluating AGP: 1 -The glucose readings within the target range? 2 -The shape of the median curve ? 3 -Patterns of hypoglycemia? 4 -The width of the interquartile range (IQR)?

Q O i-if readings are within targets or not ? ? indicates hyper. Episodes O ii-what is the hypoglycemia pattern? Might indicate inadequate insulin doses O iii-Shape of median curve ? flatness α glucose stability O iv-IQR width? IQR α glucose variability?

O AGP tells you, exactly, when : O You are within target or O Hyper or O Hypo O Accordingly; various considerations/actions may be discussed/taken:
insulin might be")
O*if most of readings are above the target area , back (basal)insulin might be necessary to be readjusted O*if median is not flat; over /under treating glucose fluctuation is likely to present

Hint…………. If Hba 1 c is normal, and there are lot of high readings; that means there are hypo episode which compensate for these hypers and result in this normal Hba 1 c value

O *if IQR is so close to the lower glucose target that means there is could be a pattern of hypoglycemia O * IQR width comparison , when its wider? O * meal time insulin /CHO taken need to be reviewed esp. if the is hyper or hypo follows specific meal O *basal insulin maybe increased if there is hyperglycemia trend start in the night and last for the early morning, next day. . (Somogyi effect )

O *Delayed hypoglycemia may result because of : O 1 -overtreating hyper(improper /plenty of corrective insulin doses –insulin stacking- trend arrow provide approx. expectation of glucose reading in the next few minutes ) O 2 -exstensive exercise( exercises need to be logged since same exercise has different effects) O *if median line is not flat at time of breakfast , composition of it needs to be known , certain food types makes it uneasy to control glucose when taken

O *food composition, amount insulin need to be logged in order to assess insulin-CHO ratio esp. in case of day time fluctuation

OIn general AGP analysis O 1 - Modal day; individual daily profiles O 2 -Breaking the glucose traces into overnight, fasting/pre-meal and post-meal phases O 3 -Looking at the impact of other factors such as exercise, alcohol and work patterns.

OAGP hint O * Glycemic patterns/trend are difficult to be concluded from individual readings ; so, AGP aims to collapse /condense various data to be represented in single curve which will be easy to understand from it specific variations and trends
 contributes to systematic approach to interpreting")
Key messages * The ambulatory glucose profile (AGP) contributes to systematic approach to interpreting dense glucose data from glucose monitoring systems O * Consensus recommendations are available to guide the use of the AGP O * The guidance places emphasis on examination of the AGP for periods of hypoglycemic risk, i. e. when the 10 th centile line for glucose approaches or enters the hypoglycemic range

*These analyses are supported by the glucose pattern insights analysis available from the Freestyle Libre flash glucose monitoring system, which flags up the likelihood of low glucose, the proximity of the median glucose to target, and the degree of variability below the median at various times of day

In conclusion, AGP …… : Segmentation….

O O O O Refrences: 1. Hammond P. Continuous glucose monitoring: the clinical picture. How to interpret and use the data. Practical Diabetes 2012; 29: 364 -8. http: //dx. doi. org/10. 1002/pdi. 1723 2. Matthaei S, Dealaiz RA, Bose E, et al. Consensus recommendations for the use of Ambulatory Glucose Profile in clinical practice. Br J Diabetes Vasc Dis 2014; 14: 153 -7. http: //dx. doi. org/10. 15277/bjdvd. 2014. 046

. DCCT Research Group. The effect of intensive treatment of diabetes on the development and progression of longterm complications in insulin dependent diabetes mellitus. N Engl J Med 1993; 329: 977 -86. 2. UKPDS Group. Effect of intensive blood-glucose control with metformin on complications in overweight patients with type 2 diabetes (UKPDS 34). Lancet 1998; 352: 854 -65. 3. DCCT Research Group. The relationship of glycemic exposure (Hb. A 1 c) to the risk of developme nt and progression of retinopathy in the Diabetes Control and Complications Trial. Diabetes 1995; 44: 968 -83. 4. Hirsch IB, Brownlee M. Should minimal blood glucose variability become the gold standard of glycemic control? J Diabetes Complications 2005; 19: 178 -81. 5. Glycemic Variability: How Do We Measure It and Why Is It Important? Diabetes Metab J 2015; 39: 273 -282 6. Brownlee, M. Biochemistry and molecular cell biology of diabetic complications. Nature 2001; 414: 813820. 7. Quagliaro L, Piconi L, Assalone R, Martinelli L, Motz E, Ceriello A. Intermittent high glucose enhances apoptosis related to oxidative stress in human umbilical vein endothelial cells. The role of Protein Kinase C and NAD(P) H- Oxidase activation. Diabetes 2003; 52: 2795 -2804.

. Du X, Matsumura T, Edelstein D, Rossetti L, Zsengellér Z, Szabó C, Brownlee M. Inhibition of GAPDH activity by poly (ADP-ribose) polymerase activates three major pathways of hyperglycemic damage in endothelial cells. J Clin Invest. 2003; 112: 1049 -57. 9. Classification and Diagnosis of Diabetes. , American Diabetes Association Diabetes Care. 2016; 39: S 13 -S 22. 10. Dungan KM. 1, 5 -anhydroglucitol (Glyco. Mark) as a marker of short-term glycemic control and glycemic excursions. Expert Rev Mol Diagn 2008; 8: 9 -19 11. Takahashi S, Uchino H, Shimizu T, Kanazawa A, Tamura Y, Sakai K, Watada H, Hirose T, Kawamori R, Tanaka Y. Comparison of glycated albumin (GA) and glycated hemoglobin (Hb. A 1 c) in type 2 diabetic patients: usefulness of GA for evaluation of short-term changes in glycemic control. Endocr J 2007; 54: 139 -144 12. Glycemic variability: A strong independent predictor of mortality in critically ill patients. Krinsley JS. Crit Care Med 2008; 36: 3008 -3013. Rodbard D. New and improved methods to characterize glycemic variability using continuous glucose monitoring. Diabetes Technol Ther 2009; 11: 551 -65. 14. Service FJ. Glucose variability. Diabetes 2013; 62: 1398 -404. 15. De. Vries JH. Glucose variability: where it is important and how to measure it. Diabetes 2013; 62: 1405 -8.

6. Rodbard D. Clinical interpretation of indices of quality of glycemic control and glycemic variability. Postgrad Med 2011; 123: 107 -18. 17. Mazze R, Lucido D, Langer O, et al. Ambulatory Glucose Profile: representation of verified self-monitored blood glucose data. Diabetes Care 1987; 10: 111 -17. 18. Hoss U, Budiman E, Liu H Christiansen H. Continuous Glucose Monitoring in the Subcutaneous Tissue over a 14 - Day Sensor Wear Period Diabetes. Sci Technol 2013; 7: 1210 - 1219. American Association of Clinical Endocrinologists (AACE) American College of Endocrinology (ACE) 2016 Outpatient Glucose Monitoring Consensus Statement. Endocrine Practice 2016; 21: 231 -261. 20. DCCT/EDIC Research Group. Modern-day clinical course of type 1 diabetes mellitus after 30 years’ duration: the Diabetes Control Intervention and Complications and Pittsburgh Epidemiology of Diabetes Complications experience (1983– 2005). Arch Intern Med 2009; 169: 1307 -16.
- Slides: 50