Aging and the Family Forces affecting family structure


 with 1 or More Living Grandparents: 1900 -2000 Year")
 with One or Both Parents Living: 1900 -2000 Year")


 Rates T Declines")

 Rates T Childlessness")

 Rates T Delayed childbearing")


![Migration ] Emptying the nest – cluttering the nest ] ] ] Amenity migration](https://slidetodoc.com/presentation_image_h2/77c27cd9f98522f57da53d25b790092c/image-21.jpg "Migration ] Emptying the nest – cluttering the nest ] ] ] Amenity migration")
 Get to Your Home? 1994, 70 + Time Less than")
? 1994, 70+ Frequency Less than once/ month")
? 1994, 70+ Frequency")
? 1994, 70+ Frequency Percentage Less")


 l l l 26 million caregivers Avg. hrs/wk")


- Slides: 64
Aging and the Family
Forces affecting family structure Implications for aging and intergenerational relations
Mortality and life expectancy
Percent of Persons (Various Ages) with 1 or More Living Grandparents: 1900 -2000 Year 0 1900 1920 1940 1960 1980 2000 99. 2 99. 6 99. 9 100. 0 10 yrs 20 yrs 30 yrs 40 yrs 94. 2 96. 4 98. 1 99. 4 99. 7 99. 9 69. 6 75. 5 82. 5 92. 0 95. 8 97. 4 20. 6 24. 6 32. 5 51. 3 68. 3 75. 8 1. 0 1. 6 2. 3 6. 5 15. 4 21. 0
Percent of Persons (Various Ages) with One or Both Parents Living: 1900 -2000 Year 1900 1920 1940 1960 1980 2000 40 yrs 72. 4 76. 7 83. 5 91. 7 93. 5 95. 4 50 yrs 39. 0 44. 2 51. 8 66. 5 75. 5 80. 2 60 yrs 7. 5 9. 3 13. 0 23. 6 36. 7 43. 8 70 yrs 0. 2 0. 3 0. 5 1. 8 5. 0 7. 1
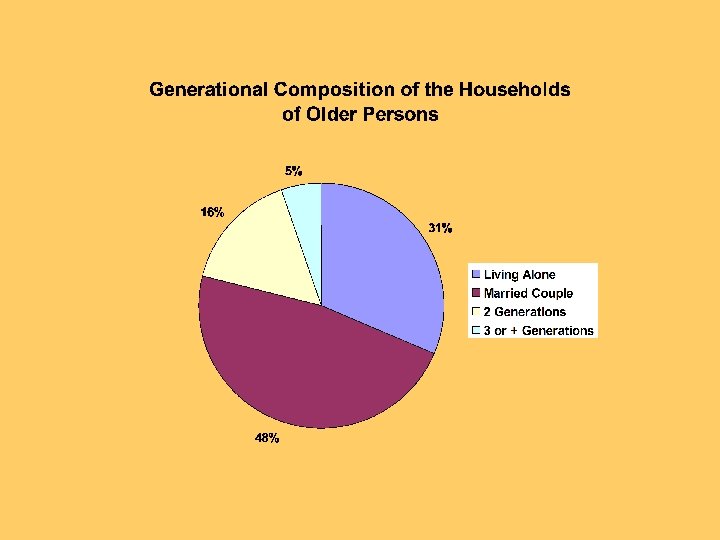
Prevalence of multigenerational living arrangements
Generational Composition of the Households of Older Persons Age Living Alone Married Couple 65 -69 70 -74 75 -79 80 -84 85 -89 90 + 21. 7 28. 4 36. 0 40. 9 41. 4 33. 5 52. 6 48. 5 39. 7 29. 8 21. 8 13. 0 2 Gene 3 or More rations Generations 15. 6 12. 1 12. 5 16. 1 22. 8 37. 1 4. 3 4. 5 5. 0 6. 1 7. 2 9. 5
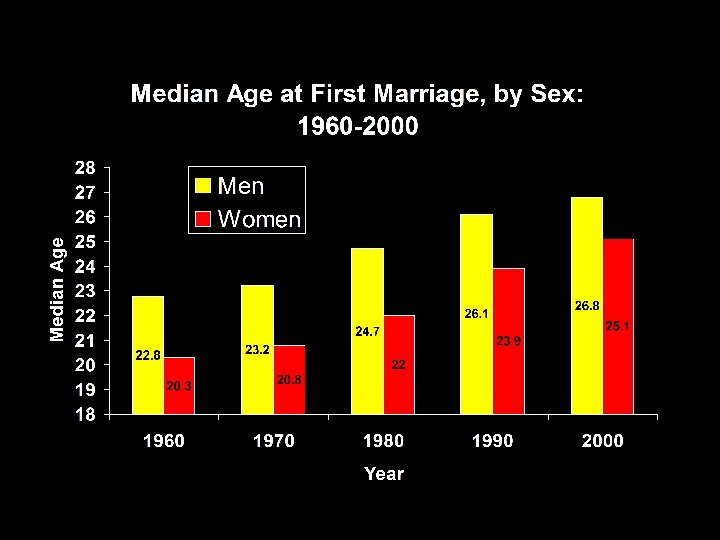
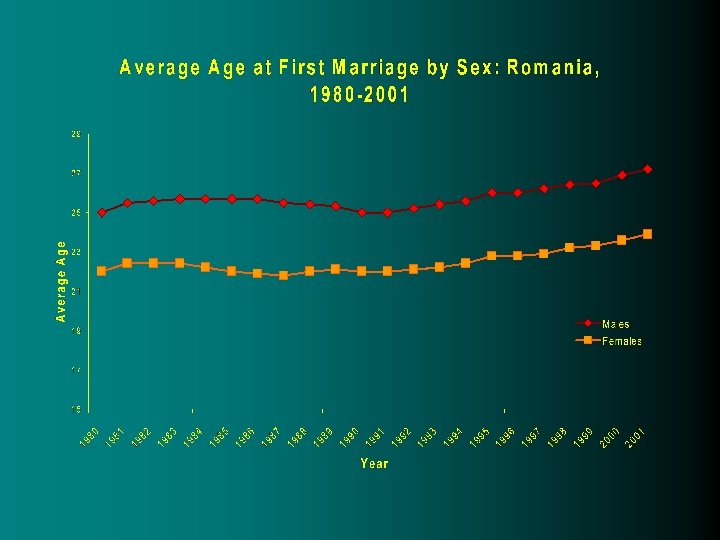
Age at Marriage T Increases
Fertility / birth rates
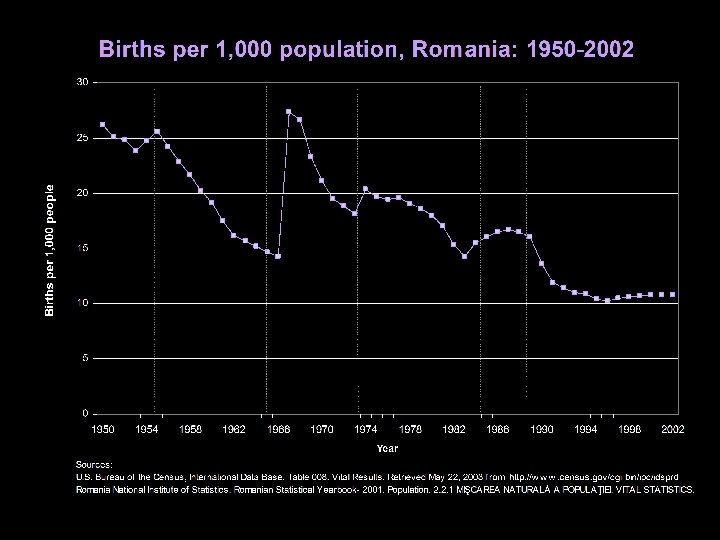
Birth (Fertility) Rates T Declines
U. S. Birth Rates: 1950 -2000
Birth (Fertility) Rates T Childlessness
Childlessness Among Ever Married Women 40 to 44 Years Old: 1980 to 1998
Birth (Fertility) Rates T Delayed childbearing
Fertility Rates by Age of Mother, U. S. : 1980 -2000
Fertility Rates by Age of Mother, U. S. : 1980 -2000
Fertility Rates by Age of Mother, U. S. : 1980 -2000
Trends in Family Generational Structure l From the “pyramid” l To the “beanpole” l To the “inverted” pyramid!
Migration ] Emptying the nest – cluttering the nest ] ] ] Amenity migration Return migration Intergenerational Contact
How Quickly Can Child(ren) Get to Your Home? 1994, 70 + Time Less than 1 hour Percentage 70 1 hour 8 2 hours 6 3+ hours 16 Note: Excludes those without children and those living with children.
How Often Do You See Your Child(ren)? 1994, 70+ Frequency Less than once/ month Percentage 17 1 -3 times/ month 15 4 times/ month (weekly) 22 5 -29 times/month (weekly+) 24 30+ times/month (daily) 22 Note: Excludes those without children and those living with children.
How Often Do You Talk on the Phone With Your Child(ren)? 1994, 70+ Frequency Less than once/ month 1 -3 times/ month Percentage 5 9 4 times/ month (weekly) 22 5 -29 times/month (weekly+) 25 30+ times/month (daily) 39 Note: Excludes those without children and those living with children.
How Often Do You Get Mail from Your Child(ren)? 1994, 70+ Frequency Percentage Less than once/ month 80 1 -3 times/ month 14 4 times/ month (weekly) 6 Note: Excludes those without children and those living with children.
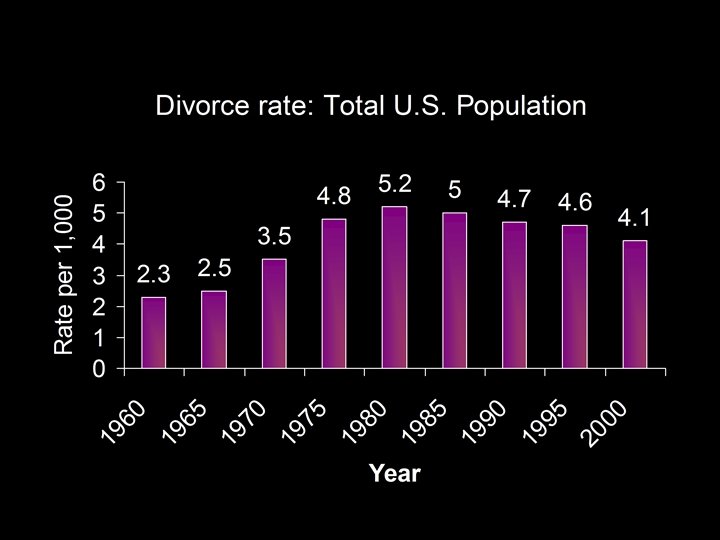
Divorce
Divorce Û Consequences – Number of grandparents in blended families – Visitation rights of non-custodial grandparents – Stepchildren and long-term care obligations
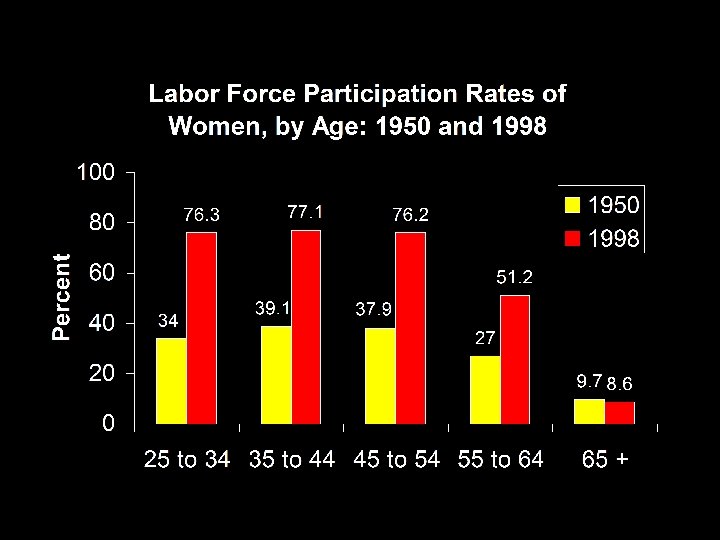
Employment of Women
Employment of Women Consequences – Availability – Competing demands – Burden, strain, and stress
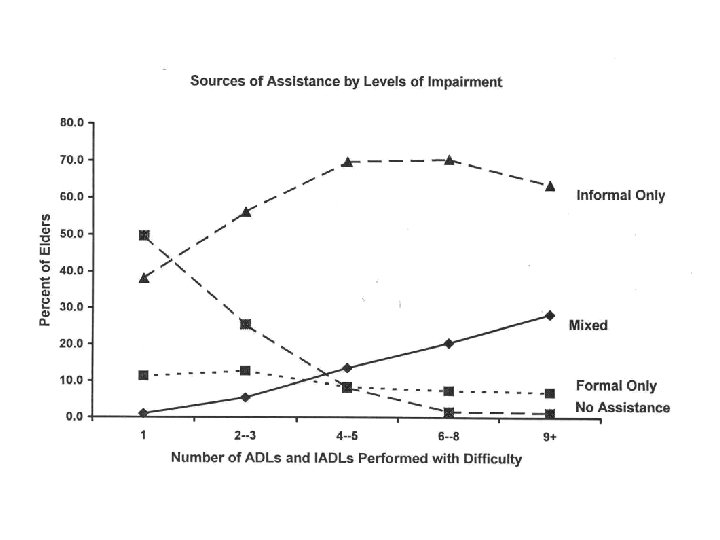
Caregiving • • Measures of impairment Age and impairment Informal vs. formal sources Sources of informal support Multiple roles, women in the middle, and the sandwich generation Caregiver stress and burden Support for family caregivers
Measures of Impairment § Activities of daily living – walking – bathing – transfer from bed or chair – dressing – toileting – feeding
Measures of Impairment § Instrumental activities of daily living – use of phone – handling money – shopping – getting around the community – preparing meals – doing housework
Prevalence of Limitations
Percent of Individuals in Each Age Group Limited in Activities Because of Chronic Conditions
To Whom Do Frail Elders Turn to for Support and Assistance? § Formal sources – e. g. , VNA, meals on wheels, paid helpers § Informal sources – e. g. , family, friends, neighbors
Distribution of People Age 50+ Receiving Help with 2+ ADLs, by Type of Assistance Received, 1994 Both Paid & Unpaid Paid only Unpaid only
Economic Value of Informal Caregiving (1997) l l l 26 million caregivers Avg. hrs/wk of inf. caregiving: 17. 9 Approx. 24 billion hours At $8. 15/hour: $196 billion Home care: $32 billion Nursing home care: $83 billion
Who Provides Informal Care?
Distribution of Informal Caregivers Who Help People Age 65+ with ADLs, by Relationship of Caregiver to Recipient, 1994
Preference Patterns Spouse l Children l – Daughter-in-law – Son-in-law l Other relatives l Friends, neighbors
Preference Patterns l If multiple daughters – Proximity – Unmarried – If married, no children at home – Unemployed l If daughters and sons (or in-laws) – Gendered division of labor
Caregiving Career l Parents l More then spouse time spent caring for dependent elders than for dependent children
Multiple Roles l Older, frail l Working – Continue LFP, possible role overload – go part time – quit and forego income – 30% adjusted schedules to meet caregiving demands
Multiple Roles l Children – in home – in college – in nest building stage l If married l If divorced
Multiple Roles l “Women in the middle” l “Sandwich generation”
l Caregiver Stress and Burden Physical – Higher % reporting fair or poor health – Sleep and eating disorders and fatigue – More MD visits – Impaired immune system functioning – More respiratory tract infections – Higher risk for coronary heart disease – Higher mortality
Caregiver Stress and Burden l Psychological – Emotional distress – Anger – Depression – Higher use of psychotropic drugs – Decreased psychological well-being – Persistence after 3 years
Caregiver Stress and Burden l Social – Decreased social interaction l Economic – Direct, out of pocket costs – Opportunity costs l Abuse
Caregiver Stress and Burden l Some examples
Concluding Images Not abandoned ² Not dumped ² Nursing homes as a last resort ² Doing too much ² Not letting go ²
What Would Help? ¶Employment policies – flex-time – job sharing – EAPs recognizing stress, providing resources and support groups – adult day care on premises (combined with day care for kids)
What Would Help? Family leave legislation ¶ Respite services ¶ – In-home (Vermont Home. Share) – Out of home (VNA) – Temporary in nursing homes or in hospitals
What Would Help? ¶ Government policy that recognizes – contributions of families – that informal, home-based care is a major component of the health care system – that hospital-based, medical model of delivering health care services is inappropriate for LTC
What Would Help? ¶Government policy that recognizes – that governmental assistance will supplement what the family is doing, not substitute for it
Fertility Rates by Age of Mother, U. S. : 1980 -2000
Generational Composition of the Households of Older Persons Age Living Alone Married Couple 2 Gene 3 or More rations Generations All 65+ 29. 5% 44. 4% 14. 9%