
Aggregate Supply Aggregate Demand Unemployment Week 4 Professor



- Slides: 9
Aggregate Supply, Aggregate Demand Unemployment Week 4 Professor Dermot Mc. Aleese
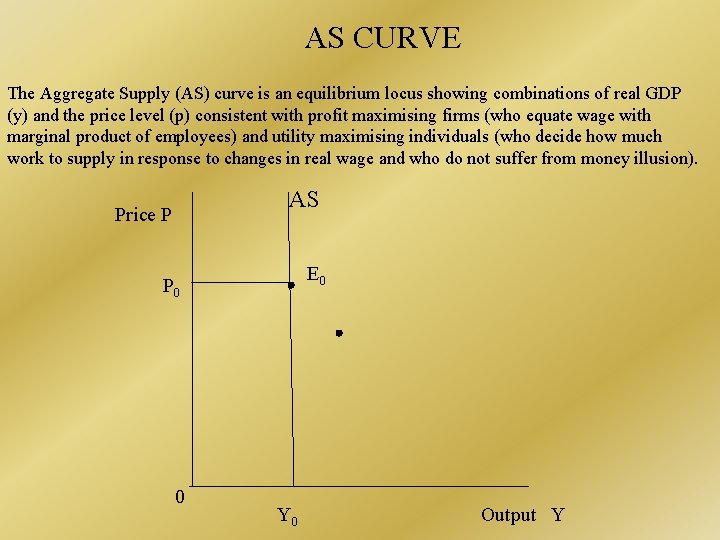
AS CURVE The Aggregate Supply (AS) curve is an equilibrium locus showing combinations of real GDP (y) and the price level (p) consistent with profit maximising firms (who equate wage with marginal product of employees) and utility maximising individuals (who decide how much work to supply in response to changes in real wage and who do not suffer from money illusion). AS Price P E 0 P 0 0 Y 0 Output Y
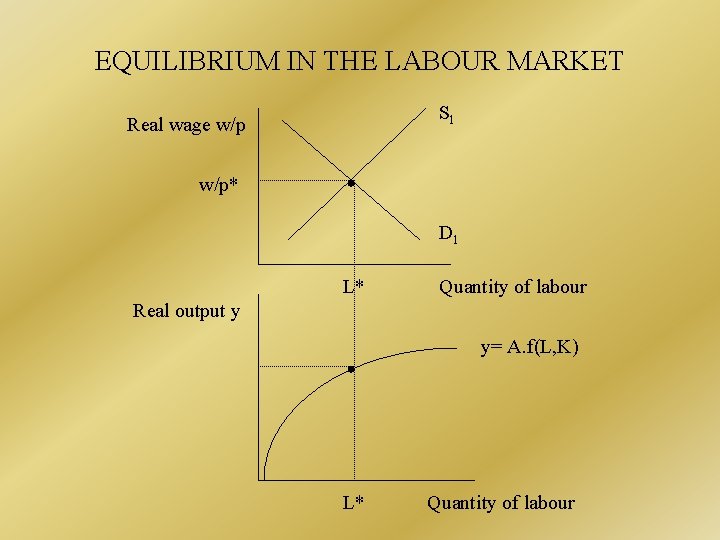
EQUILIBRIUM IN THE LABOUR MARKET Sl Real wage w/p* Dl L* Quantity of labour Real output y y= A. f(L, K) L* Quantity of labour
AS curve is vertical in the long run … but it can be positive-sloped in the short run because of money illusion, wage rigidities, employment contracts and price rigidities
SHIFTS IN THE AS CURVE – an increase in investment – an increase in labour supply because of immigration, higher labour participation rate – advances in technology – better economic policy: lower unemployment rate, more entrepreneurial business environment, lower taxes
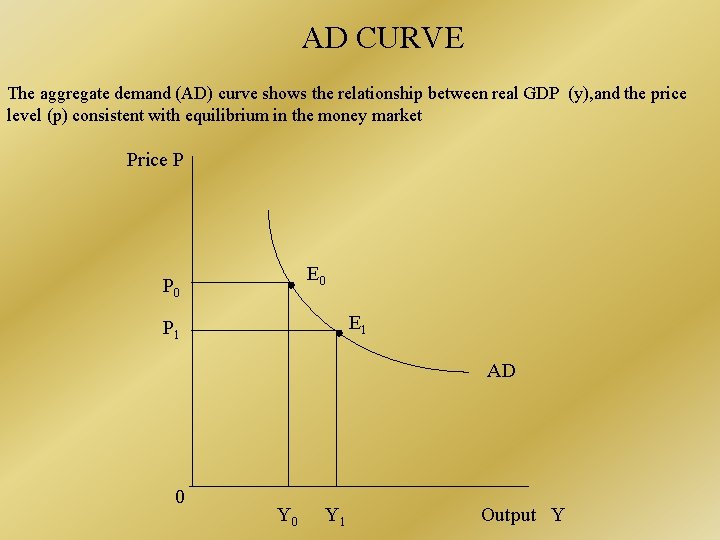
AD CURVE The aggregate demand (AD) curve shows the relationship between real GDP (y), and the price level (p) consistent with equilibrium in the money market Price P E 0 P 0 E 1 P 1 AD 0 Y 1 Output Y
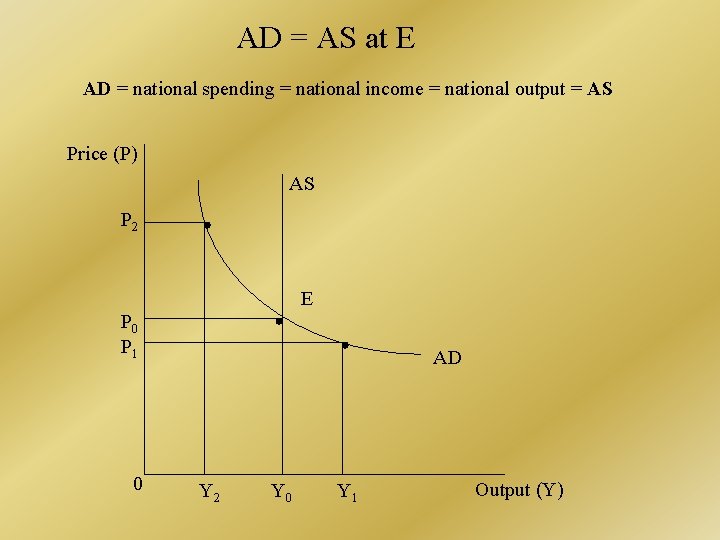
AD = AS at E AD = national spending = national income = national output = AS Price (P) AS P 2 E P 0 P 1 0 AD Y 2 Y 0 Y 1 Output (Y)
SHIFTS IN THE AD CURVE – an upsurge in business expectations leads to higher investment – consumers decide to increase their spending – people’s preferences for holding money change – the monetary authorities increase the money supply
CAUSES OF UNEMPLOYMENT – A PRELIMINARY VIEW READ ON TO CHAPTER 14 – ALSO PICKING UP A LITTLE OF CHAPTER 10