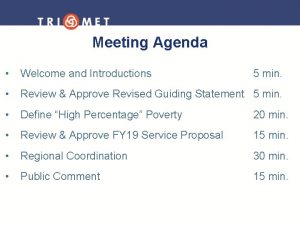
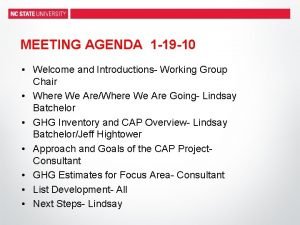
Agenda 25 5 09 Welcome Introductions Plan for


- Slides: 26

Agenda 25 -5 -09 • • • Welcome Introductions Plan for the week Overview of project Where we are now with the EU Project Operation – – – – Project Management Team Programme Advisory Committee Matched funding Annual Project Meeting – COP-15, Copenhagen? Logo Website Communication issues within the project? Risk management • Workplans

Key questions • What scales should we focus on? • Linkage to the negotiation process? • What do we mean by anthropogenic emissions – e. g. natural peatlands? • Who are the relevant actors that we need to identify? • What policy information is useful for modelling? • How do we take into account leakage, permanence, additionality within the project? • How do disseminate results wider than just the case study countries?

WP 1

WP 2 • C stock estimation – uncertainty • Mitigation costs – marginal abatement cost curves • Good knowledge from Indonesia, need to find out more about other study countries • Vietnam – GHG, forestry inventory, allometric equations, monitoring forest change – RS data

WP 3 • • Quantifying GHG emissions from forest cover change Most focus so far on AGB – will improve CO 2 emissions estimations from soil, particularly sub-soil (>30 cm depth) – all field sites Improve methodologies for non-CO 2 gases – N 2 O emissions depends on intensity of subsequent land use (fertiliser use) – focus on Jambi Literature review Relatively simple models Need: detailed land use maps, soils maps if possible – site selection; Jambi - land use history (burning, etc. ) Forest fire – major CO 2 loss Deep peat soils (>16 m) – subsidence, relative importance of CH 4/CO 2/N 2 O

WP 4 • REDD hasn’t come out of the blue • Forest policy architecture – how do REDD policies relate to others? • What policy options have worked in the past? • Provide policy options/scenarios for modelling work • Local level impacts? • Integrate global/local levels? • Identification of relevant actors, and their networks • Peter Minang will be ICRAF representative in this WP.

WP 6 • • • Fairness vs. efficiency Relationship to COP 15? Hotspots Discussion tools – needs to be a combination of fairness and efficiency Forest use rights for local community Improvements in governance in landscape may be more important than REDD benefits REDD issues may need presenting in other contexts – different ‘languages’ Value chains REDD ‘projects’ not feasible – need to be higher scales (additionality, etc. ) – what about international leakage? Certainty at different scales varies How are national level agreements translated into sub-national agreements?

REDD-ALERT: Reducing Emissions from Deforestation & Degradation through Alternative Land Uses in the Rainforests of the Tropics Robin Matthews Climate Change Theme Leader Macaulay Institute Aberdeen AB 15 8 QH United Kingdom REDD-ALERT Kick-off workshop, May 25, 2009

REDD-ALERT EU-FP 7 Project REDD-ALERT Reducing Emissions from Deforestation and Degradation through Alternative Landuses in Rainforests of the Tropics • • • Macaulay Land Use Research Institute, United Kingdom Université Catholique de Louvain, Belgium Vrije Universiteit Amsterdam, Netherlands Georg August University of Göttingen, Germany World Agroforestry Centre, Kenya Centre for International Forestry Research, Indonesia • • • International Institute of Tropical Agriculture, Nigeria Centro Internacional de Agricultura Tropical, Columbia Indonesian Soils Research Institute, Indonesia Research Centre for Forest Ecology and Environment, Vietnam Institut de Recherche Agricole pour le Développement, Cameroon Instituto Nacional de Investigacion y Extension Agraria, Peru

Linking global agreements to local action Overall goal: To contribute to the development and evaluation of mechanisms and the institutions needed at multiple levels for influencing stakeholder behaviour to slow tropical deforestation rates and hence reduce GHG emissions

Project objectives • • • Documenting the diversity in social, cultural, economic and ecological drivers of forest transition and conservation, and the consequences, in the contexts of selected case study areas in Indonesia, Vietnam, Cameroon, and Peru as representative of different stages of forest transition in Southeast Asia, Africa and South America. Quantifying rates of forest conversion and change in forest carbon stocks using improved methods. Improving accounting (methods, default values) of the consequences of land use change for GHG emissions in tropical forest margins including peatlands. Identifying and assessing viable policy options addressing the drivers of deforestation and their consistency with policy approaches on avoided deforestation currently being discussed in UNFCCC and other relevant international processes. Analysing scenarios in selected case study areas of the local impacts of potential international climate change policies on GHG emission reductions, land use and livelihoods. Developing new negotiation support tools and using these with stakeholders at international, national and local scales to explore a basket of options for incorporating REDD into post-2012 climate agreements.

Project components

Site locations Ucayali, Peru Southern Cameroon Indonesia Vietnam

WP 1: Drivers of deforestation • Humid tropics: combination of: – – commercial wood extraction conversion to cropland livestock development extension of overland transport infrastructure • Southeast Asia – timber concessions, plantations (paper, palm oil) – slash-and-burn agriculture • Latin America – road building followed by migrant settlers practising S&B – pasture creation for cattle • Africa (Congo Basin) – smallholder agriculture – commercial logging – fuelwood (Geist & Lambin, 2002)

WP 1: Forest transitions Forest cover (%) Cameroon Benchmark sites ? Indonesia, Peru ? Vietnam ? Undisturbed forests Forest frontiers Forest, agricultural mosaics time Forest, agricultural mosaics, plantations

WP 2: Measuring and monitoring D&D • C stocks = f(forest area, C density) • What is a forest? – Continuum forced into binary classification – ‘Forest without trees’, ‘trees outside forest’ • Institutional definition of a forest – e. g. intent to replant • Agroforestry, e. g. rubber agroforests – Hierarchical legends: ‘forest’, ‘tree-based systems’, ‘openfield agriculture’, but possibly more to minimise uncertainty

WP 2: Carbon densities • C densities – degradation more serious than deforestation? – Degradation: 300 to 50 t C ha-1 250 t C ha-1 lost – Deforestation: 50 to 0 t C ha-1 50 t C ha-1 lost – C density data for hierarchical categories update databases • Need to incorporate soil changes: time-averaged C stock • Limiting factor is time series data rather than spatial resolution (from F. Achard, JRC)

WP 3: GHG emissions from D&D • • • Tier 1 focus on changes in C stocks in above-ground biomass – plan to quantify root biomass also (to 3 m) Soil C – most studies only in top 30 cm – plan to quantify to 3 m Significant CO 2 and N 2 O released from soil following conversion of forest – • Measurement and modelling of GHG emissions from ‘hotspot’ land use change – oil palm plantations, deforested peatlands Methodologies to extrapolate to larger spatial and temporal scales – – – Controlling variables: N availability, soil aeration status Can proxy variables be used? e. g. C/N ratio of litter, δ 15 N signatures of litter & soil Large soil variability: infra-red spectral analyses of the soils as covariates in the model

WP 4: Policy and governance issues • Previous attempts have not always been positive due to: – ‘Politics of scale’, i. e. decisions/concerns at global level don’t translate to those at a local scale – Lack of synergy at all levels between forestry and other policies • Looking for win-win policies – beneficial for GHG emissions reduction as well as local communities • Aim to synergise the interests of different actors at different levels into a coherent multi-level policy framework • Analyse trade-offs between CC policies (e. g. biofuels, C sequestration) and the larger goal of sustainable forestry • Develop a menu of viable policy options to tackle REDD under the international climate regime

WP 4: Policy framework

WP 5: People and Landscapes Model • Household agents – decision-making – inter-household interactions • imitation of successful strategies • buying/selling commodities • Patches on a landscape – CENTURY soil organic matter model – Ritchie water balance model – DSSAT crop models – Trees model • Livestock model Papers • Matthews, R. B. , 2002. Chapter 15 in Crop-Soil Simulation Models: Applications in Developing Countries (R. B. Matthews & W. Stephens, Editors), CAB International, Wallingford, UK, pp. 209 -230. • Matthews, R. B. & Pilbeam, C. J. , 2005. Paper presented at MODSIM 05 conference, Dec 9 -12, 2005, Melbourne, Australia. • Matthews, R. B. & Pilbeam, C. J. , 2005. Agriculture, Ecosystems & Environment 111(1 -4): 119 -139. • Matthews, R. B. et al. , 2005. Paper presented at MODSIM 05 conference, Dec 9 -12, 2005, Melbourne, Australia. • Matthews, R. B. , 2006. Ecol. Modelling 194(4): 329 -343.

WP 5: Policy instruments • PALM model: Combining agentbased and biophysical modelling • All instruments can encourage land managers to choose low emission options • But – taxes reduce farmer returns – incentives require external money • Combination of taxes and incentives may be cost-neutral • Feasibility of carbon trading in the land use sector

WP 6: Changing peoples’ behaviour • Challenge is how national level targets will be translated to changes in the behaviour of the people who will be expected to reduce deforestation activities • Salience (relevance) • Legitimacy – findings by foreign research groups not necessarily accepted – reconfirmation by local scientists – e. g. CO 2 emissions from Indonesia’s peatlands • Credibility • Synthesise peoples’ perceptions, fears, ambitions & expectations – Q-methodology and Analytical Hierarchy Process techniques • Role-playing games to explore benefit-sharing mechanisms • Negotiation Support System (NSS) approach rather than Decision Support System (DSS)

WP 6: Participatory scenario analysis SAMBA-GIS (Vietnam) • narrative conceptual model • agent-based spatial computational model (ABM) • role-playing game • multiscale GIS • Stakeholders exposed to other viewpoints of same problem • ‘Buy-in’ and trust in models by participants more important than numerical accuracy - Van den Belt (2004) (Castella et al. , 2005)

Pert diagram

Management structure
 Meeting agenda welcome and introductions
 Agenda welcome and introductions
 Agenda welcome and introductions
 Agenda welcome and introductions
 Agenda welcome and introductions
 Agenda welcome and introductions
 Meeting agenda welcome and introductions
 Agenda welcome and introductions
 Agenda welcome and introductions
 Agenda for parent orientation
 Agenda welcome and introductions
 Agenda welcome and introductions
 Greetings and introductions
 Agenda sistemica y agenda institucional
 Uhhshare
 Welcome session agenda
 Brva beach volleyball
 Wise men three clever are we
 Attention getters for argumentative essays
 Business english introductions
 Persuasive text about scotland
 German family vocabulary
 Survey introductions
 Catchy introductions
 Business greeting conversation
 Creative introduction examples
 Inverted-triangle introduction
