AGECFNR 406 LECTURE 38 Rice Paddy World Food


 2. Reduction in")


- Slides: 20
AGEC/FNR 406 LECTURE 38 Rice Paddy
World Food Production Major links between food production and the environment: 1. Food production relies on good quality land adequate supplies of water; 2. Historically, most land clearing has been for agriculture; 3. Wide range of agricultural impacts on the environment.
Why are people in the developed world well fed… . . . while those in developing countries are less well fed? One major factor: developed world has 45%
Arable Land: Where is it?
Food vs. population. . . Aggregate food production has grown dramatically in past 100 years Two main sources of increases in food production: 1. Area expansion 2. Technical progress Indicator of growth in food production: long-term trend in food prices has been downward, but concerns about a slowdown in food production have been raised.
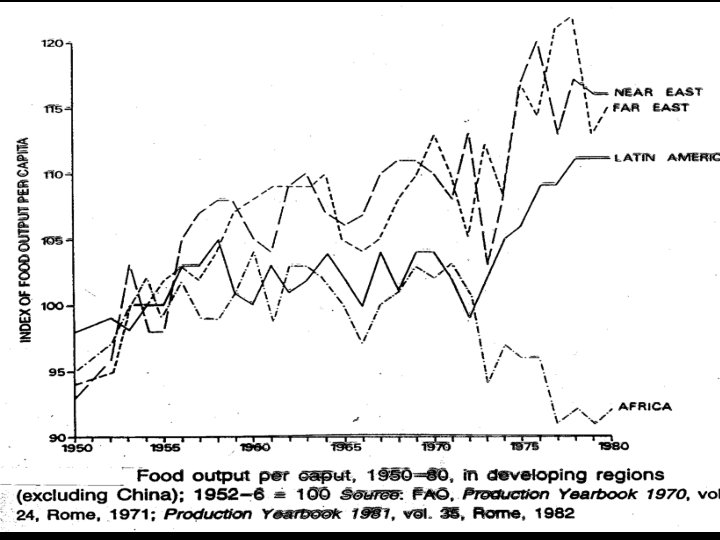
Per capita food production Calculated as: total production/population Growing, but not as rapidly as total production Annual growth rates: 1950 s: 1960 s: 1970 s: 1980 s: 1. 4% 0. 8% 0. 4% … and holding steady
Cropland person Calculated as: area in production/population world average = 0. 75 acres/person N. America average = 2. 17 acres/person Declining everywhere! Some examples (% change 1961 -86): N. Africa: down 47% China: down 44% SSA: down 39% S. Asia: down 39% (0. 77 acres) (0. 22 acres) (0. 82 acres) (0. 49 acres)
Figure: World Agricultural Output, 1961 -90 Key point: aggregate production continues to climb, but per capita production is leveling off.
Food person World average area person = 0. 30 hectares “Typical” grain yield = 3000 kg/ha This translates into 2. 5 kg/person/day Average calorie content = approx. 2500 KCal/kg This translates into 6250 Kcal/person/day More than enough! So what’s the problem?
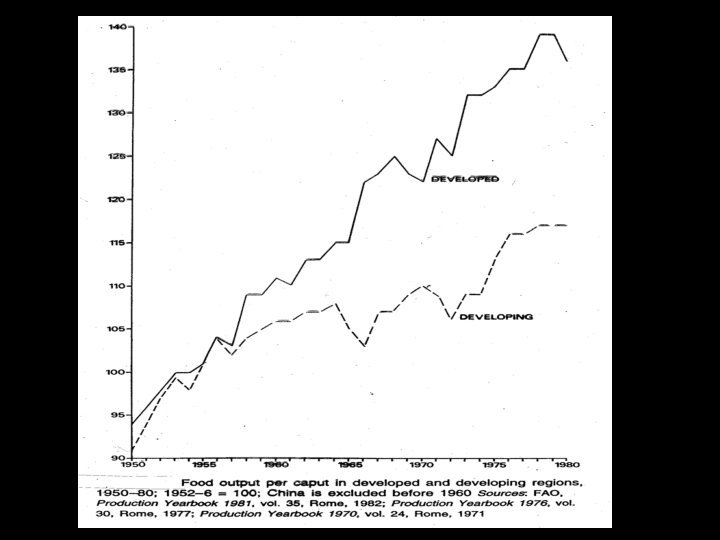
Food production person Increasing everywhere except sub-Saharan Africa Fastest growth: developed countries Why? 1. Slow population growth 2. Crop improvements
Sources of increases in food production 1. New land (forests, deserts) 2. Reduction in fallow (currently 1/3 of arable) 3. Multiple cropping (rainfall limiting factor) 4. Intensification (new varieties, irrigation)
Green Revolution Development of new varieties (originally of wheat in Mexico and rice in the Philippines) during the 1950 s and 60 s. High yielding varieties (HYVs) (also known as modern varieties (MVs)) were more responsive to inorganic fertilizer and irrigation, and faster maturing. Bred with pest and disease resistance.
Rice – two improvements Semidwarfs to reduce lodging Higher flag leaf
Impacts on agriculture 1. MVs profitable, replaced TVs 2. Irrigation expanded 3. Use of chemicals increased 4. Diversity of genetic material reduced b/c MVs related via common ancestors (see Table from Fowler and Mooney)
Impacts on food production 1. In areas with MVs, food production doubled or tripled in 20 -30 years, far surpassing increases in population. 2. Less yield variability 3. Lower food prices
Impacts on poverty and nutrition 1. More food: unambiguous impact 2. Lower food prices 3. Large farms bias? 4. More food necessary but not sufficient to eradicate poverty and malnutrition
Impacts on environment 1. Irrigation leads to salinization 2. Fertilizer use increases nutrient loads 3. Pesticides may impair ecosystem health 4. Biotech may have uncertain impact
Critiques of Green Revolution 1. “Social” critique a. the green revolution didn’t fix problems associated with access by the poor b. technology destroys social fabric 2. “Scientific” critique a. the green revolution escalated uses of technology, especially environmentally damaging technologies b. GR reduced genetic diversity