AGE STRUCTURE POPULATION PYRAMIDS HISTOGRAMS AGE STRUCTURE AExpandinggrowing


- Slides: 14
AGE STRUCTURE POPULATION PYRAMIDS & HISTOGRAMS
AGE STRUCTURE A-Expanding/growing population- pyramid shape, has more children than any other age group. - Nigeria B- Stable populations- Number of children is roughly the same as the number of reproductive adults- US C- Declining population- Prereproductive group is smaller. Germany
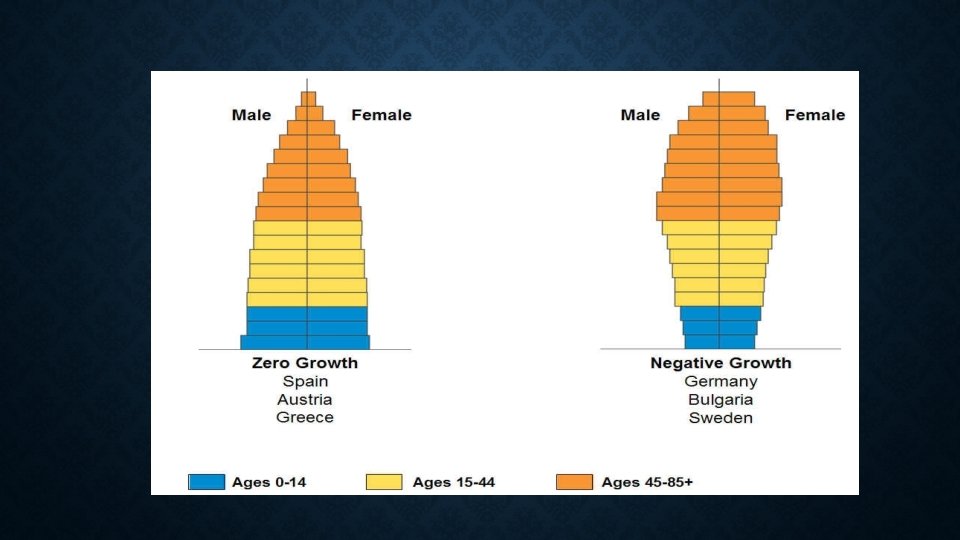
TAKE A CLOSER LOOK. . . • Age structure graphs group the population into age groups of 5 year increments • The “bars” are the percent of each age group that is male (left) or female (right)
WHAT ARE AGE STRUCTURE DIAGRAMS? • Even if the replacement-level fertility rate of 2. 1 were magically achieved globally tomorrow, the world population would keep growing for at least another 50 years. • • The reason for this is a population's age structure: the proportion of the population (or of each sex) at each age level. • • Population Geographers typically construct a population age structure diagram (also called histograms) by plotting the percentages of numbers of males and females in the total population in each of three age categories: • prereproductive (ages 0 -14) • reproductive (ages 15 -44) • postreproductive (ages 45 and up)
HOW DOES AGE STRUCTURE AFFECT POPULATION GROWTH? • Any country with many people below 15 years old (represented by a wide based population structure diagram) has a powerful built-in momentum to increase its population size unless death rates rise sharply. • • The number of births rises even if women have only one or two children because of the large number of girls who will be soon moving into their reproductive years. • • In 2012, 30% of the world's people were under 15 years old. • • These 2. 2 billion people are poised to move into their reproductive years
HOW CAN THIS GROWTH BE SLOWED? • an effective program to reduce birth rates • a sharp rise in death rates •
DESCRIBE THE GROWTH OF THIS COUNTRY • Population is EXPANDING • High percent of population is in prereproductive/reproductive years. . . so there will be a high birth rate over next several years • Low percent of population is in older years • This is a developing country • Will experience resource depletion & decreased quality of life
DESCRIBE THE GROWTH OF THIS COUNTRY • Population growth is SLOW • % of each age group is relatively even • TFR is below replacement level • Column with bulges/pentagon shape • This is a developed country • Will need to be able to support a rapidly aging population
THIS IS CURRENT US POPULATION PYRAMID What might the US government need to be concerned about in the future? Rapidly increasing aging population. . . retired. . . will need support Baby Boomers are in their 50 s and 60 s
THE BABY BOOMERS!
CALCULATE % POPULATION UNDER 15 • For KENYA ~45% • For the US ~ 20% • For Italy ~15%
WHICH OF THE FOLLOWING IS THE BEST DESCRIPTION OF A POPULATION WITH A STABLE AGE DISTRIBUTION? A. Large population growing at a constant rate B. Growing population in which the proportions of individuals in different age classes remain constant C. A small population that has not yet achieved exponential growth D. A large population with a negative growth rate E. A population in the early stages of logistic growth
WHICH OF THE FOLLOWING IS THE BEST DESCRIPTION OF A POPULATION WITH A STABLE AGE DISTRIBUTION? A. Large population growing at a constant rate B. Growing population in which the proportions of individuals in different age classes remain constant C. A small population that has not yet achieved exponential growth D. A large population with a negative growth rate E. A population in the early stages of logistic growth