Age Structure Diagrams Show the proportion of the


")


- Slides: 11
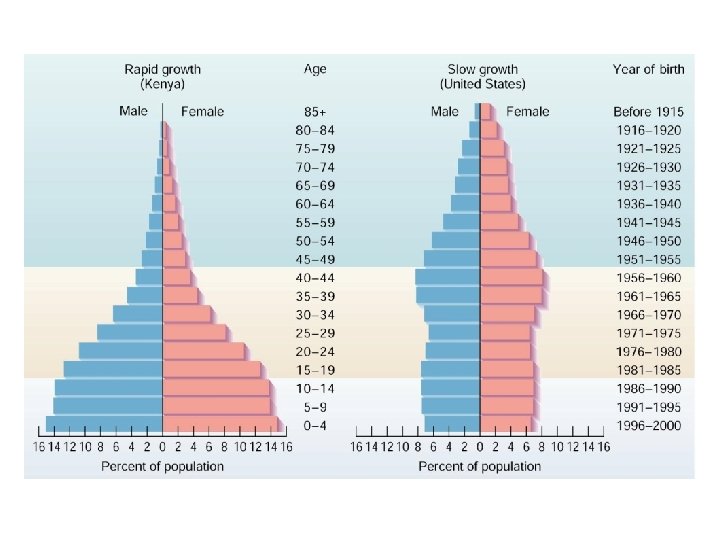
Age Structure Diagrams Show the proportion of the population at each age level Three main age categories: Prereproductive (ages 0 -14) Reproductive (15 -44) Postreproductive (45+)
Age Structure Diagrams
How can Age Structure Diagrams be used to make population and economic projections? Baby-Boom Generations Creates social and economic changes that ripple through a society for decades Competition for jobs; political clout; retirement benefits and needs
What are the effects of population decline? Rapid pop. decline can lead to severe economic and social problems A sharp rise in proportion of elderly will lead to a large share of medical care, social security and other costly social services Labor shortages
Human Population Dynamics World Population (7 min)
Human Population History
Estimated Human Population Growth
Limits to Growth How do we estimate carrying capacity for a species? Examine requirements of given species Examine resources available to given species For Humans…. How deep is the barrel?
Limits to Growth Why is this difficult to estimate for humans? 1. Range of resources used is too great (MEDC vs LEDC) Resource requirements vary according to lifestyles Resource requirements differ from time to time and population to population 2. When a resource becomes limiting, we show great ingenuity in substituting one resource for another Technological developments give rise to continual changes in the resources required and available for consumption
Limits to Growth So what factors are used to determine human carrying capacity? Rate of energy and material consumption Level of pollution Extent of human interference in global life-support systems Affect reuse and recycling have on reducing these impacts/increasing carrying capacity