After 77 Genomic Implementation at AGI NBCEC Brown

After 7/7 Genomic Implementation at AGI NBCEC, Brown Bagger, October 4 th 2017 Stephen Miller, AGI Genetic Research Director Dan Moser, AGI President and AAA Director of Performance Programs Kelli Retallick, AGI Genetic Services Director

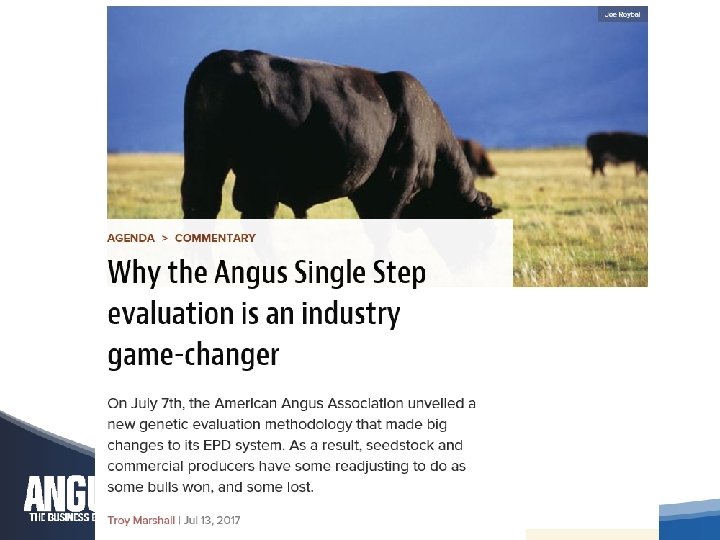
New and Improved Angus Genetic Evaluation Released 7/7/17 "Different isn’t always better, but better is always different. " - Author Unknown JULY 2017

Enhancements to Angus Evaluation on 7/7/17 • Single Step genomics • Improved models for carcass traits • Additional genotypes and data • Updated heritability and genetic correlation estimates • Annual update of economic assumptions for $Values

Dan Moser, Ph. D AGI President Lou Ann Adams Director of Information Systems Stephen Miller, Ph. D AGI Genetic Research Director Jason Kenyon Assistant Director of Information Systems Kelli Retallick, M. S. AGI Genetic Service Director Janice Blair Programmer Gayle Billups Programmer Lizhen Wang, Ph. D AGI Research Geneticist Marg Dressman Software Engineer

Ignacy Misztal, Ph. D Romdhane Rekaya, Ph. D Daniela Lourenco, Ph. D J. Keith Bertrand, Ph. D Yutaka Masuda, Ph. D Shogo Tsruuta, Ph. D

Impact of SNP selection on genomic prediction for different reference population sizes Daniela Lourenco I. Menezes, B. O. Fragomeni, H. L. Bradford, S. Tsuruta, I. Misztal ADSA - June, 2017

Data + DNA = Selection Tools that Work • • • 7. 9 M birth weights 8. 6 M weaning weights 4. 3 M post-weaning gain records 1. 5 M heifer calving ease scores 116 K carcass records 1. 9 M ultrasound records 21 K individual intake records 257 K docility scores 62 K heifer pregnancy observations 205 K mature cow weights 380 K Genotypes

Genotypes in Angus Genetic Evaluation Date Genotypes Oct. 2012 11, 000 Oct. 2013 42, 000 Oct. 2014 89, 000 Oct. 2015 159, 000 Oct. 2016 262, 000 Current 380, 000

SS Genetic Trends more stable • SS and Classic trends very similar Marb 0, 7 0, 5 0, 3 0, 1 -0, 3 1972 1976 1980 1984 1988 1992 1996 2000 2004 2008 2012 2016 • Inflating trends with MS SS Full Classic Adjust

Single Step allows a more COMPLETE model h 2+rg RIB CWT LWT URIB_B URIB_C WWT RIB X X X X X X X X X X X CWT LWT URIB_B URIB_C WWT UFAT_B UFAT_C! FAT X UFAT_B UFAT_C FAT X

-10 1972 1974 1976 1978 1980 1982 1984 1986 1988 1990 1992 1994 1996 1998 2000 2002 2004 2006 2008 2010 2012 2014 2016 Carcass Weight EPD 50 40 30 20 10 0 -20 MS SSNew. Base

Correlations with MARC EPDs Single Step proves superior in USMARC validation Trait Birth CWT FAT MILK MARB REA Weaning YWT MS 0. 59 0. 32 0. 24 0. 40 0. 44 0. 24 0. 43 0. 51 SS 0. 60 0. 35 0. 42 0. 40 0. 51 0. 27 0. 43 0. 52 196 Sires

R-Square – SS predicts AAA performance better Yearling Gain EX MS Yearling Gain EX SS Weaning EX MS Weaning EX SS Birth EX MS Birth EX SS 0 0, 05 0, 15 0, 2

Why Does the Phone Ring? How can two flushmates be this different on EPD? Why don’t genomic scores and EPD match?

Single Step Weights Genomics Variably Across the Population • Multi-step = “One size fits all” • Single Step • Weights genomics more for animals genetically “closer” to the data • Like having an accuracy value for the genomic component of the EPD • Animals distant from data will change less from DNA testing, and have lower EPD accuracy

Range among Full-Sibs has been known for a VERY long time Gregor Mendel 1822 -1884 “Mendelian” Sampling

Single-Step Approach • Redefines pedigree relationships among animals based on genetic markers PGS S PGD X MGS D Aguilar et al, 2010 MGD

Single-Step Approach • Redefines pedigree relationships among animals based on genetic markers PGS S 50% PGD X MGS 25% Aguilar et al, 2010 D MGD

PGS - Semen PGD - Egg Sire

PGS - Semen PGD - Egg Sire

PGS - Semen PGD - Egg Sire

PGS - Semen PGD - Egg Sire

PGS - Semen PGD - Egg Sire Calf 1

PGS - Semen PGD - Egg Sire Calf 1

PGS - Semen PGD - Egg Sire Calf 1

PGS - Semen PGD - Egg Sire Calf 1

PGS - Semen PGD - Egg Sire Calf 2 Calf 1

PGS - Semen PGD - Egg Sire Calf 2 Calf 1

PGS - Semen PGD - Egg Sire Calf 2 Calf 1

PGS - Semen PGD - Egg Sire Calf 3 Calf 2 Calf 1

Variation the root of all progress Distribution of Birth Weight - Bull Calves BW Heritability 0. 43 54 57 60 63 66 69 72 75 78 81 84 87 90 93 96 99 102 0, 06 0, 05 0, 04 0, 03 0, 02 0, 01 0 Environment Genetic

-6, 7 -6, 2 -5, 7 -5, 20000001 -4, 70000001 -4, 20000001 -3, 70000001 -3, 20000001 -2, 70000001 -2, 20000001 -1, 70000001 -1, 20000001 -0, 700000007 -0, 200000007 0, 3 0, 8 1, 3 1, 8 2, 3 2, 8 3, 3 3, 8 4, 3 4, 8 5, 3 5, 8 6, 29999999 6, 79999999 7, 29999999 7, 79999999 8, 29999999 8, 79999998 9, 29999998 Variation Source of Variation the root of all progress Distribution of BW EPD 0, 16 0, 14 0, 12 0, 1 0, 08 0, 06 0, 04 0, 02 0 Sire Dam Mendelian Sampling

Variation in BW EPD – ET progeny • 646 ET from commercial recipients – centered on +2 parental average

I mate a +2 dam to +2 sire and progeny is +5, … really?

Really!

What does theory and Mendel say is possible? More range in “True EPD” possible than observed in EPD • 1, 000 simulated progeny

Two ET Full sibs Sib A BW EPD 1. 6 Genomic Score 61 Sib B BW EPD 2. 5 Genomic Score 23

Top side of Sire pedigree

Expected Relationship of Schearbrook Shoshone to calf?

1/2 1/4 1/8 1/16 1/32 Expected Relationship of 1/64 Schearbrook Shoshone to calf?

Expected G Ancestor BW EPD Gen 1 Gen 2 Gen 3 Gen 4 Gen 5 G A R Grid Maker 5. 5 4 0. 0625 Ideal 1418 of 8103 4286 5 6 0. 0156 Rito 2100 G D A R 4. 6 6 0. 0156 Schearbrook Shoshone 4. 3 5 6 8 0. 0508 V D A R New Trend 315 3. 5 4 6 7 0. 0859 B/R New Frontier 095 2. 9 2 0. 2500 G D A R Traveler 044 2. 4 5 0. 0313 B/R Ruby 1224 2. 3 3 0. 1250 Boyd New Day 8005 2. 1 3 0. 1250 Altune of Conanga 6104 2 4 0. 0625 B/R New Design 036 1. 5 3 5 5 0. 1875 P S Power Play 1. 4 6 6 6 8 9 0. 0527 N Bar Emulation EXT 1. 4 6 0. 0156 G A R Precision 1680 1. 2 3 6 6 0. 1563 Riverbend Blackbird 4301 1. 1 3 0. 1250 Connealy Dateline 0. 7 3 5 0. 1563 V A R Reserve 1111 0. 7 1 0. 5000 S A F Fame 0. 6 6 0. 0156 S A F Focus of E R 0 5 0. 0313 Q A S Traveler 23 -4 -0. 9 6 6 7 7 0. 0469 Tehama Bando 155 -1. 5 4 5 0. 0938 Band 234 of Ideal 3163 -1. 6 5 6 0. 0469 prop from FS Diff expected 0. 0297 0. 48 -0. 0161 1. 03 0. 0332 2. 13 0. 0110 0. 22 0. 0367 0. 43 -0. 0093 0. 04 -0. 0206 0. 66 0. 0517 0. 41 0. 0150 0. 12 -0. 0059 0. 0326 0. 17 -0. 0053 0. 10 0. 0055 0. 35 -0. 0361 0. 23 -0. 0047 -0. 0457 0. 0217 -0. 0016 -0. 0152 -0. 0244 -0. 0342 -0. 0230 0. 04 0. 29 0. 04 0. 10 0. 48 0. 52 0. 36 0. 49

Expected G Ancestor BW EPD Gen 1 Gen 2 Gen 3 Gen 4 Gen 5 G A R Grid Maker 5. 5 4 0. 0625 Ideal 1418 of 8103 4286 5 6 0. 0156 Rito 2100 G D A R 4. 6 6 0. 0156 Schearbrook Shoshone 4. 3 5 6 8 0. 0508 V D A R New Trend 315 3. 5 4 6 7 0. 0859 B/R New Frontier 095 2. 9 2 0. 2500 G D A R Traveler 044 2. 4 5 0. 0313 B/R Ruby 1224 2. 3 3 0. 1250 Boyd New Day 8005 2. 1 3 0. 1250 Altune of Conanga 6104 2 4 0. 0625 Average 0. 08 prop from FS Diff expected 0. 0297 0. 48 -0. 0161 1. 03 0. 0332 2. 13 0. 0110 0. 22 0. 0367 0. 43 -0. 0093 0. 04 -0. 0206 0. 66 0. 0517 0. 41 0. 0150 0. 12 -0. 0059 0. 09 . 01 Calf with higher BW EPD is 15% MORE related to the higher BW EPD Ancestors 0. 15

Ancestor N Bar Emulation EXT G A R Precision 1680 Riverbend Blackbird 4301 Connealy Dateline V A R Reserve 1111 S A F Fame S A F Focus of E R Q A S Traveler 23 -4 Tehama Bando 155 Band 234 of Ideal 3163 Average Expected G BW EPD Gen 1 Gen 2 Gen 3 Gen 4 Gen 5 1. 4 6 0. 0156 1. 2 3 6 6 0. 1563 1. 1 0. 7 0. 6 0 -0. 9 -1. 5 -1. 6 3 3 1 6 5 6 4 5 5 6 7 7 prop from FS Diff expected 0. 0055 0. 35 -0. 0361 0. 23 0. 1250 0. 1563 0. 5000 0. 0156 0. 0313 0. 0469 0. 0938 0. 0469 -0. 0047 -0. 0457 0. 0217 -0. 0016 -0. 0152 -0. 0244 -0. 0342 -0. 0230 0. 04 0. 29 0. 04 0. 10 0. 48 0. 52 0. 36 0. 49 0. 12 -. 02 -. 13 Calf with higher BW EPD is 13% LESS related to the lower BW EPD Ancestors

Summary of Changes • Narrower ranges for some traits, greater ranges for others • Minimal change for proven animals, considerable change for some young animals • More variation among half- and full-sibs • More current, real-time use of genomic information • More accurate prediction of progeny performance

Questions/Discussion Dan W. Moser, Ph. D. dmoser@angus. org AGI President 816 -383 -5196 Kelli Retallick, M. S. kretallick@angus. org Genetic Service Director 816 -383 -5190 Stephen Miller, Ph. D. smiller@angus. org Genetic Research Director 816 -383 -5157
- Slides: 46