
AFFORDABLE HOUSING OUTLOOK September 27 2019 Presented by

AFFORDABLE HOUSING OUTLOOK September 27, 2019 Presented by: Armand Tiberio
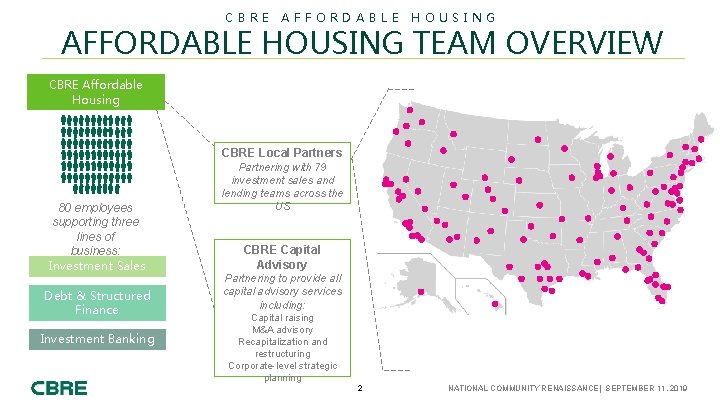
CBRE AFFORDABLE HOUSING TEAM OVERVIEW CBRE Affordable Housing CBRE Local Partners 80 employees supporting three lines of business: Investment Sales Debt & Structured Finance Investment Banking Partnering with 79 investment sales and lending teams across the US CBRE Capital Advisory Partnering to provide all capital advisory services including: Capital raising M&A advisory Recapitalization and restructuring Corporate-level strategic planning 2 NATIONAL COMMUNITY RENAISSANCE| SEPTEMBER 11, 2019
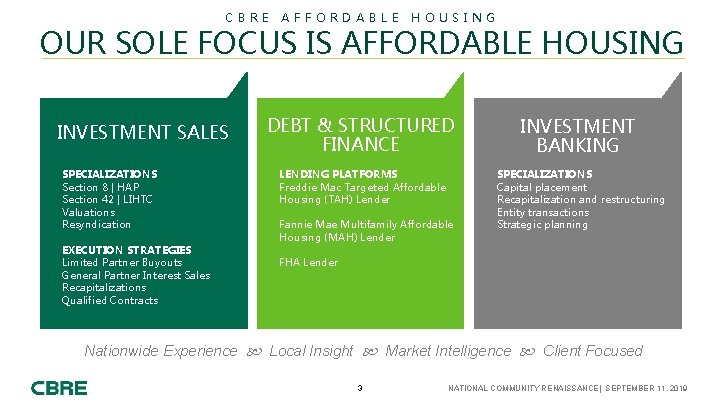
CBRE AFFORDABLE HOUSING OUR SOLE FOCUS IS AFFORDABLE HOUSING INVESTMENT SALES SPECIALIZATIONS Section 8 | HAP Section 42 | LIHTC Valuations Resyndication EXECUTION STRATEGIES Limited Partner Buyouts General Partner Interest Sales Recapitalizations Qualified Contracts DEBT & STRUCTURED FINANCE LENDING PLATFORMS Freddie Mac Targeted Affordable Housing (TAH) Lender Fannie Mae Multifamily Affordable Housing (MAH) Lender INVESTMENT BANKING SPECIALIZATIONS Capital placement Recapitalization and restructuring Entity transactions Strategic planning FHA Lender Nationwide Experience Local Insight Market Intelligence Client Focused 3 NATIONAL COMMUNITY RENAISSANCE| SEPTEMBER 11, 2019
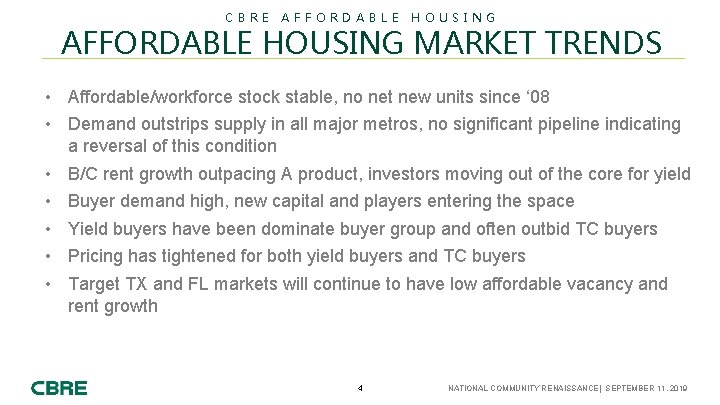
CBRE AFFORDABLE HOUSING MARKET TRENDS • Affordable/workforce stock stable, no net new units since ‘ 08 • Demand outstrips supply in all major metros, no significant pipeline indicating a reversal of this condition • B/C rent growth outpacing A product, investors moving out of the core for yield • Buyer demand high, new capital and players entering the space • Yield buyers have been dominate buyer group and often outbid TC buyers • Pricing has tightened for both yield buyers and TC buyers • Target TX and FL markets will continue to have low affordable vacancy and rent growth 4 NATIONAL COMMUNITY RENAISSANCE| SEPTEMBER 11, 2019
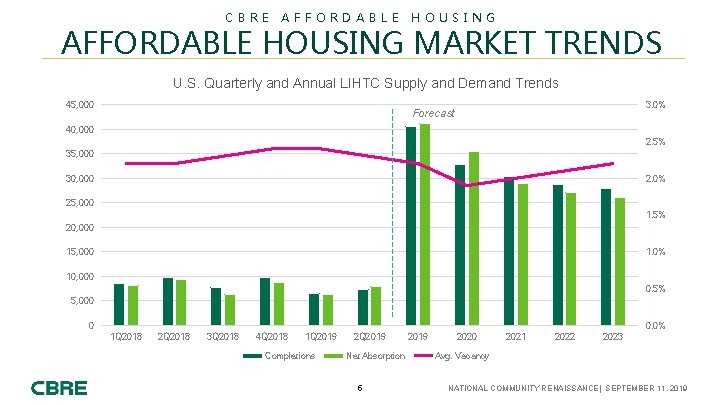
CBRE AFFORDABLE HOUSING MARKET TRENDS U. S. Quarterly and Annual LIHTC Supply and Demand Trends 45, 000 3. 0% Forecast 40, 000 2. 5% 35, 000 30, 000 2. 0% 25, 000 1. 5% 20, 000 15, 000 1. 0% 10, 000 0. 5% 5, 000 0 0. 0% 1 Q 2018 2 Q 2018 3 Q 2018 4 Q 2018 1 Q 2019 Completions 2 Q 2019 Net Absorption 5 2019 2020 2021 2022 2023 Avg. Vacancy NATIONAL COMMUNITY RENAISSANCE| SEPTEMBER 11, 2019
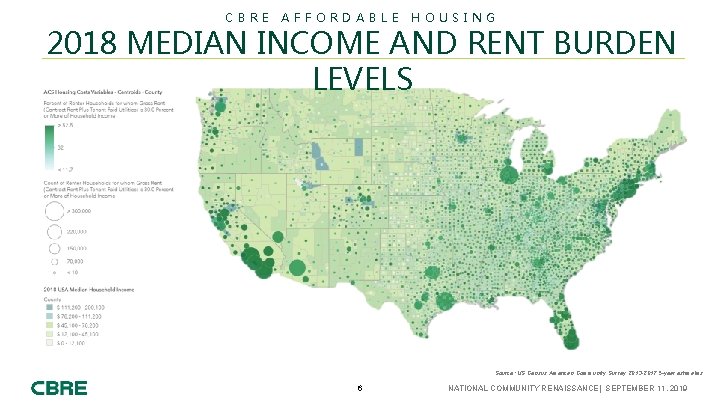
CBRE AFFORDABLE HOUSING 2018 MEDIAN INCOME AND RENT BURDEN LEVELS Source: US Census American Community Survey 2013 -2017 5 -year estimates 6 NATIONAL COMMUNITY RENAISSANCE| SEPTEMBER 11, 2019
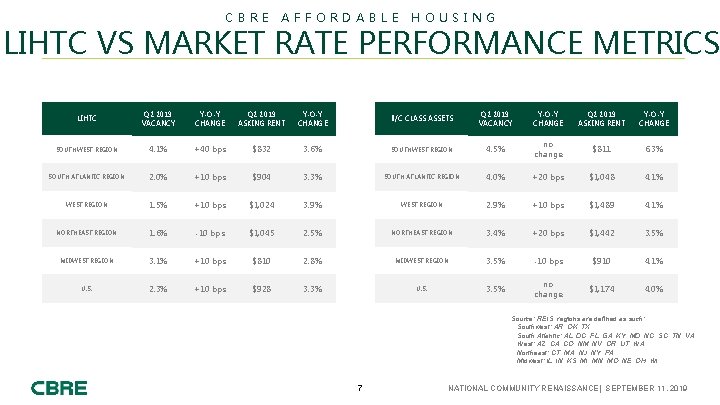
CBRE AFFORDABLE HOUSING LIHTC VS MARKET RATE PERFORMANCE METRICS LIHTC Q 2 2019 VACANCY Y-O-Y CHANGE Q 2 2019 ASKING RENT Y-O-Y CHANGE B/C CLASS ASSETS Q 2 2019 VACANCY Y-O-Y CHANGE Q 2 2019 ASKING RENT Y-O-Y CHANGE SOUTHWEST REGION 4. 1% +40 bps $832 3. 6% SOUTHWEST REGION 4. 5% no change $811 6. 3% SOUTH ATLANTIC REGION 2. 0% +10 bps $904 3. 3% SOUTH ATLANTIC REGION 4. 0% +20 bps $1, 048 4. 1% WEST REGION 1. 5% +10 bps $1, 024 3. 9% WEST REGION 2. 9% +10 bps $1, 489 4. 1% NORTHEAST REGION 1. 6% -10 bps $1, 045 2. 5% NORTHEAST REGION 3. 4% +20 bps $1, 442 3. 5% MIDWEST REGION 3. 1% +10 bps $810 2. 8% MIDWEST REGION 3. 5% -10 bps $910 4. 1% U. S. 2. 3% +10 bps $928 3. 3% U. S. 3. 5% no change $1, 174 4. 0% Source: REIS, regions are defined as such: Southwest: AR, OK, TX South Atlantic: AL, DC, FL, GA, KY, MD, NC, SC, TN, VA West: AZ, CA, CO, NM, NV, OR, UT, WA Northeast: CT, MA, NJ, NY, PA Midwest: IL, IN, KS, MI, MN, MO, NE, OH, WI 7 NATIONAL COMMUNITY RENAISSANCE| SEPTEMBER 11, 2019
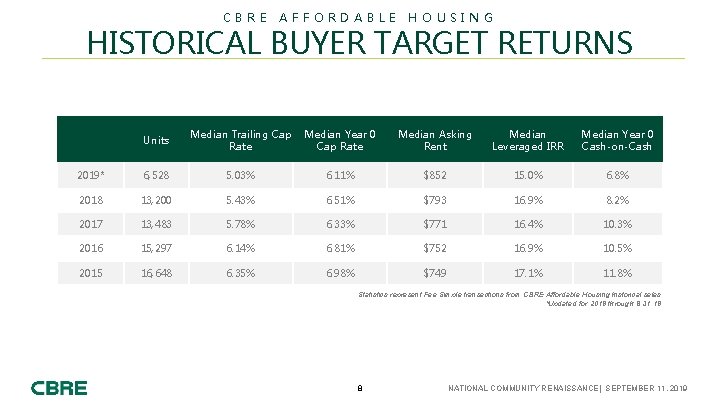
CBRE AFFORDABLE HOUSING HISTORICAL BUYER TARGET RETURNS Units Median Trailing Cap Rate Median Year 0 Cap Rate Median Asking Rent Median Leveraged IRR Median Year 0 Cash-on-Cash 2019* 6, 528 5. 03% 6. 11% $852 15. 0% 6. 8% 2018 13, 200 5. 43% 6. 51% $793 16. 9% 8. 2% 2017 13, 483 5. 78% 6. 33% $771 16. 4% 10. 3% 2016 15, 297 6. 14% 6. 81% $752 16. 9% 10. 5% 2015 16, 648 6. 35% 6. 98% $749 17. 1% 11. 8% Statistics represent Fee Simple transactions from CBRE Affordable Housing historical sales *Updated for 2019 through 8. 31. 19 8 NATIONAL COMMUNITY RENAISSANCE| SEPTEMBER 11, 2019
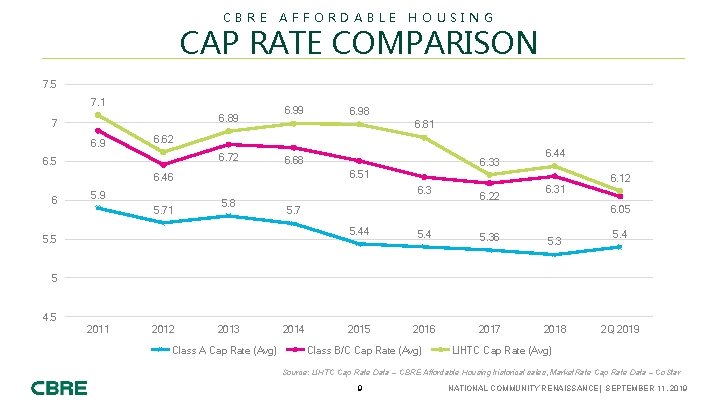
CBRE AFFORDABLE HOUSING CAP RATE COMPARISON 7. 5 7. 1 6. 89 7 6. 99 6. 81 6. 62 6. 72 6. 5 6. 68 6. 33 6. 3 5. 9 5. 71 6. 44 6. 51 6. 46 6 6. 98 5. 8 6. 22 6. 31 6. 05 5. 7 5. 5 6. 12 5. 44 5. 36 5. 3 2015 2016 2017 2018 5. 4 5 4. 5 2011 2012 2013 Class A Cap Rate (Avg) 2014 Class B/C Cap Rate (Avg) 2 Q 2019 LIHTC Cap Rate (Avg) Source: LIHTC Cap Rate Data – CBRE Affordable Housing historical sales, Market. Rate Cap Rate Data – Co. Star 9 NATIONAL COMMUNITY RENAISSANCE| SEPTEMBER 11, 2019
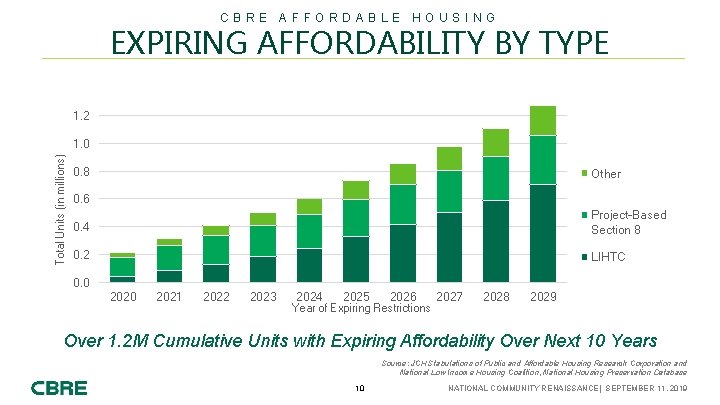
CBRE AFFORDABLE HOUSING EXPIRING AFFORDABILITY BY TYPE 1. 2 Total Units (in millions) 1. 0 0. 8 Other 0. 6 0. 4 Project-Based Section 8 0. 2 LIHTC 0. 0 2021 2022 2023 2024 2025 2026 Year of Expiring Restrictions 2027 2028 2029 Over 1. 2 M Cumulative Units with Expiring Affordability Over Next 10 Years Source: JCHS tabulations of Public and Affordable Housing Research Corporation and National Low Income Housing Coalition, National Housing Preservation Database 10 NATIONAL COMMUNITY RENAISSANCE| SEPTEMBER 11, 2019
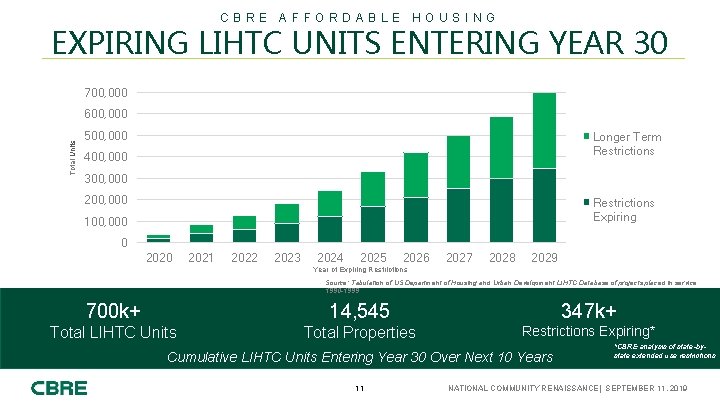
CBRE AFFORDABLE HOUSING EXPIRING LIHTC UNITS ENTERING YEAR 30 700, 000 Total Units 600, 000 500, 000 Longer Term Restrictions 400, 000 300, 000 200, 000 Restrictions Expiring 100, 000 0 2021 2022 2023 2024 2025 2026 2027 2028 2029 Year of Expiring Restrictions Source: Tabulation of US Department of Housing and Urban Development LIHTC Database of projects placed in service 1990 -1999 700 k+ 14, 545 347 k+ Total LIHTC Units Total Properties Restrictions Expiring* Cumulative LIHTC Units Entering Year 30 Over Next 10 Years 11 *CBRE analysis of state-bystate extended use restrictions NATIONAL COMMUNITY RENAISSANCE| SEPTEMBER 11, 2019
CBRE AFFORDABLE HOUSING EQUITY MARKET TRENDS & OPPORTUNITIES • Affordable housing is an attractive alternative investment segment • Growing number of equity groups interested in partnering with operators • Limited capital sources actually investing • ESG/Impact capital a real and growing segment; but cost of capital is not necessarily cheaper, although there are some banks with below market capital for CRA or to drive relationships • Pension capital is selectively making direct investments through operators 12 NATIONAL COMMUNITY RENAISSANCE| SEPTEMBER 11, 2019

CBRE Armand Tiberio Vice Chairman, Capital Markets T +1 206 826 5772 armand. tiberio@cbre. com AFFORDABLE HOUSING PROFILES Armand Tiberio is a Vice Chairman, Capital Markets. Prior to joining CBRE, Mr. Tiberio was a senior vice president at Marcus & Millichap and a partner and national director at Tax Credit Group, where he was involved in executing over $19 billion in sales and financing transactions. He has over 19 years of investment real estate experience, primarily dedicated to the affordable housing industry. Armand currently oversees the advisory group and is part of the executive committee for CBRE Affordable Housing. Armand’s experience and understanding of the affordable housing industry provides clients with the resources and support they need to navigate the complexities of partnership interest sales, fee simple sales, and valuations. His hard work, persistence, and focus have allowed him to develop strong relationships with affordable housing industry leaders to maximize results for clients. Armand currently sits on the board of the National Housing and Rehabilitation Association and is a frequent speaker in front of large owners and industry groups. He graduated from Pepperdine University with a bachelor’s degree in Business and Finance. 13 NATIONAL COMMUNITY RENAISSANCE| SEPTEMBER 11, 2019

THANK YOU
- Slides: 14