Affordability Strategies Scott Looney sloonhawken edu Head of

Affordability Strategies Scott Looney - sloon@hawken. edu Head of School, Hawken School Connecticut Association of Independent Schools May 14, 2008 1

2001 1965 1929 1983 1946 1921 1900 2

3

External Realities and Trends

Moody’s Independent School Outlook 5 Slide courtesy of Pat Bassett, from “Financial Survivability: The Economic Meltdown –Brutal Facts vs. Unshakeable Beliefs

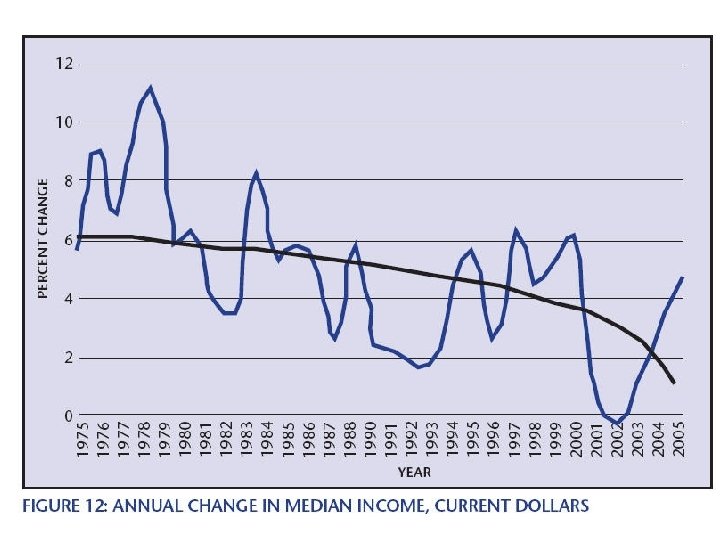
2007 = first net drop in income for top 5% in US census data going back to 1966 6

What’s happening over last ten years… • • Tuition up 30% in real dollars in 10 years Overall staff up 32% in 10 years Student teacher ratios getting smaller Financial Aid Dollars up 38%, but recipients up only 2% • Attrition down overall 8% • Enrollment up by 20% • Giving up by 20%

Projected Population Growth by State 8

Net Migration by State 9

Connecticut Population Percent Growth: 2000 -2008 and 2013 10

Connecticut Population in School Percent Growth: 2000 -2008 and 2013 11

Connecticut Population by Race Percent Growth: 2000 -2008 and 2013 0. 25 0. 2 0. 15 0. 1 0. 05 0 -0. 05 White Black 2000 - 2008 Asian Hispanic Other 2008 - 2013 12

Demographic Maps - Connecticut • • • Population from 1990 to 2004 Race Average Household Expenditure on Education 13

How Many Families Make That Much? Percentage of families earning $200 K+ with school-age children US Boston Chicago Los Angeles 0 -4 0. 59 1. 13 0. 97 5 -9 0. 61 1. 14 0. 95 1. 05 10 -13 0. 49 0. 93 0. 74 0. 76 14 -17 0. 49 0. 87 0. 74 0. 73 Total 2. 2 4. 07 3. 4 3. 51 Source: Mark Mitchell, NAIS Demographics Center, www. nais. org

The Disappearing Middle Class The Middle Class: Dual Income Family @$75, 000 (Source: Harvard Magazine, Feb, 2006 “The Middle Class on the Precipice”)

17

18

Affordability Solutions

Affordability Challenge Solutions • Market Value: Internally and Externally

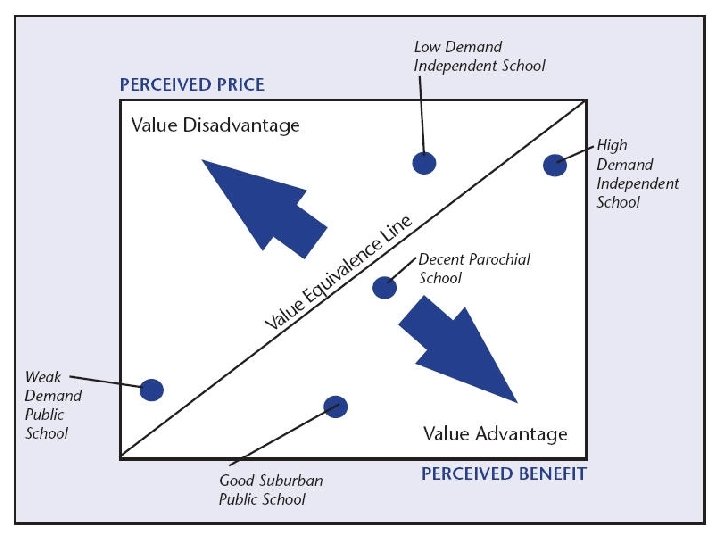
Satisfaction Value = Cost

Benefits Value = Price

Internal Marketing • Reinforcing the value proposition for current constituents – About dialog, not monologue • Formalize listening – Understand their needs, values and perspective – About relationships and participation – Creating a sense of community - belonging

Internal Marketing • Intentional Commitment – – – Head of School Leadership Cultural shift…from tradition of modesty. Administrative Coordination Budget and Responsibility Market and Constituent Research • Strategies – – – Systematize and regularize internal communications Website (intranet) Ceremony and Tradition Gatherings and Meetings Volunteer training and empowerment Any other activity that increases awareness, community, belonging…

Internal Marketing • Reinforcing the value proposition for current constituents – VP for parents: ROI (tangible proof of success) & happy children – VP for students: Belonging, achievement, opportunity – VP for alumni: Linkage to their success, Relationships, Tradition, Brand Association – VP for faculty: being valued for contribution, relationships

Parents want… • Their children to be happy and successful (not necessarily in that order). • The school to respond to their questions or issues immediately. • Parents expect the class size which was advertised will be the class size their child experiences • Parents want to know that the school is a good steward of their tuition dollars • The reputation and prestige of the school to provide them justification to their friends of the expense.

Most Parents want measurable results • Standardized test scores – One of the ways the academic program is judged • Many schools don’t see high test scores as a trophy to pursue so there is a conflict with parent expectations • College Placement – Many parents believe that attendance at a high tuition independent school is an implied warranty to the Ivy League • Merit Scholarships to college – Increasingly seen as an indicator of the academic and extra curricular strength of the student body

Reframing “Success” • Provide the context and tools by which our constituents can more appropriately measure us. • Helping families measure success, in ways that align with the school’s mission • Understand that many families expect quantifiable data, don’t dismiss this need. • Alumni success, satisfaction and accomplishment key to making the case. • Benchmarking against alternative options (public, private, parochial)…ie. NELS study.

Percentage of students planning to earn postgraduate degrees by age 30 Source: NAIS Report “Values Added: The Lifelong Benefits of an Independent School Education” and Cranbrook Schools Alumni Survey Classes 1980 to 2004

Percentage reporting more than 11 hours of studying per week during their senior year in High School Source: NAIS report “Independent Schools: Preparing Students for Achievement in College and Beyond (HERI Report) and Cranbrook Alumni survey classes of 1980 -2004.

Teenagers in the United States 11, 000 20% who live in Midwest 2, 200, 000 25% who would consider leaving home Research 4% who can afford boarding 25% who are Strong Enough Students Outreach & Promotion Inquiries & Leads Recruitment Interviews / Visits Applicants Marketing Evaluation Yield Retention Accepts Enrolled Alumni 284 146 94 69 22, 000 5, 500 1, 084 322 550, 000

Inquiries Apps Accepts Enroll B Inquiries Apps Accepts Enroll C
 Apps Selectivity (admit rate) (72%")
Inquiries Admission Funnel Conversion Inquiry Conversion (15% vs. 34%) Apps Selectivity (admit rate) (72% vs. 51%) Accepts Yield Enroll Comparisons are with NAIS Day-Boarding Averages Yield (53% vs. 63%)

Communications Continuum Qualified Students, Unaware of Your School Awareness Inquiries & Leads Interviews / Visits Comprehension Applicants Conviction Accepts Enrolled Alumni Action

Personal Selling Sales –Promotion Publicity Advertising Selling –Promotion 1, 2, 3, 4, 5, 6, 7 8, 9, 10 11, 12 13, 14 12 Marketing Communications Hierarchy 1. One-to-one, face-to-face conversation MOST EFFECTIVE 2. Small group discussion or meeting 3. Person speaking before a large group 4. Telephone conversation between two persons 5. Hand-written personal note 6. E-mail correspondence 7. Computer-generated "personal" letter (managed correspondence) MARGINALLY 8. Article in institutional newsletter, magazines, etc. EFFECTIVE 9. Brochure or pamphlet sent out as a direct-mail piece 10. Mass-produced, non-personal letter 11. News in popular press (newspapers, radio, television, etc. ) 12. Press Releases 13. Targeted Advertising in newspapers, radio, television, , etc. LEAST 14. Diffuse -Passive Advertising, (i. e. billboards, etc. ) EFFECTIVE

Personal Selling Sales -Promotion Publicity Selling -Promotion Advertising 1, 2, 3, 4, 5, 6, 7 8, 9, 10 11, 12 13, 12 14 Marketing Communications Hierarchy ACTION 1. One-to-one, face-to-face conversation 2. Small group discussion or meeting 3. Person speaking before a large group 4. Telephone conversation between two persons CONVICTION 5. Hand-written personal note 6. E-mail correspondence 7. Computer-generated "personal" letter 8. Article in institutional newsletter, magazines, etc. COMPREHENSION 9. Brochure or pamphlet sent out as a direct-mail piece 10. Mass-produced, non-personal letter 11. News in popular press (newspapers, radio, television, etc. ) 12. Press Releases 13. Targeted Advertising in newspapers, radio, television, , etc. 14. Diffuse -Passive Advertising, (i. e. billboards, etc. ) AWARENESS

Communication Timing Type of Information Data / Facts Emotion What Our Families Want What We Tend To Do Beginning Time End
")
New Growth Opportunities 4 3 Markets Market Development Market Penetration Present 1 Products (Diversification) Product Development 2 New

Average and Median Household Incomes for Cranbrook’s Top Ten Day Student Communities vs. Michigan and U. S. norms.

Average and Median Household Incomes for Harrisburg’s Top Ten Day Student Communities vs. Pennsylvania and U. S. norms.

Cranbrook Harrisburg Academy

Affordability Challenge Solutions • Market Value: Internally and Externally • Proactively Attend to Student Retention

Staff Time Grand Total Approximately = 64 hours One Student 2. 5 X 5 hours = 12. 5 hours Accepts 4. 1 X 5 hours = 20. 5 hours Applications 5. 5 X 3. 5 hours = 19. 25 hours Campus Visits 15. 3 X 45 mins = 11. 5 hours Inquiries 1 2. 5 4. 1 5. 5 15. 3
 Establish a committee: – Definite Members: Director of")
Steps to Limiting Voluntary Attrition 1) Establish a committee: – Definite Members: Director of Admission, Academic Dean, Dean of Students, School Counselor and Business Manager. – Possible Members: Head of School, Assistant Head. – Chair: Director of Admission. 2) Foundation Information: Accurate consistent retention and attrition statistics a. Categories with consistent information: name, graduation year, reason for leaving (voluntary, involuntary, discipline, medical, academic), date enrolled, date departed b. Who will keep this data? …get it right!
 Meetings (regular) – Retention Goals – Enrollment Projections")
Steps to Limiting Voluntary Attrition 3) Meetings (regular) – Retention Goals – Enrollment Projections – Enrollment Policy » Examples: a) Counseling out policies b) year-end review process c) status switches; day to boarding, vice versa 4) Regular Reports to the Faculty a) Essential faculty education, their role in enrollment management b) Head of School’s Support 5) Year End Student Review – Organize process so there are NO surprises: Another nightmare…the faculty creates 10 unexpected openings in June. – Control the Process

Affordability Challenge Solutions • • • Market Value: Internally and Externally Proactively Attend to Student Retention Moderate Tuition Growth – Grow non-tuition revenue sources – Reduce operating costs

Rise in Boarding Tuitions “The most powerful force in the universe… compound interest. ” Albert Einstein

Rise in Day Tuitions

“More “Straight Talk: ” The National Commission on the Cost of Higher Education and its Implications for Virginia” Rita J. Kirshstein David A. Rhodes American Institutes for Research

Business Economics vs. School Economics A Business • • Price = Cost + Profit Price reacts swiftly to demand When demand is up, price goes up to maximize profit When demand goes down, hold a sale to avoid surplus inventory. Sales offers can be for short durations and can be changed easily Sticker price reductions are viewed by consumers as positive Pricing strategies reviewed and adjusted every quarter Can reduce payroll costs swiftly A School • • Cost = (Price – Discount) + Subsidy Price cannot react swiftly to demand When demand goes up selectivity and/or price can go up When demand goes down, tuition discounting used to avoid surplus enrollment vacancies Financial aid offers due to discounting is for years and cannot be changed easily. Sticker price reductions can be misinterpreted by consumers as a sign of weakness Pricing strategies reviewed once a year, but adjusted less frequently Cannot easily reduce payroll costs

School Funding Sources by Moody’s Rating

• The PAVS Matrix Concepts affecting demand affordability Prestige – The public perception of the quality of the school based on its historical reputation of preparing students for ‘success’ • Affordability – the perception of the price of enrolling after considering any financial assistance from sources other than family. High affordability means a family thinks the school is within its means…low affordability is out of reach • Value – the perception of what a family is receiving for the money it is paying, whatever the sum. Value results from a variety of factors including prestige and affordability • Sacrifice – the degree to which a family is willing to forego certain things in order to devote a portion of its resources to school costs that otherwise could be used for other expenses, savings or 53 investments. Courtesy of Marketing Independent Schools in the 21 st Century, Chapter six, “The Affordability Dilemma” by Mark Mitchell

“Relative Demand” Matrix of PAVS Matrix Perceptions of School Qualities Highest Demand Schools High Prestige High Affordability Perceptions of Viability High Value High Sacrifice High Demand Schools High Prestige Low Affordability Medium Value Medium Sacrifice Average Demand Schools Low Prestige High Affordability Low Value Medium Sacrifice Low Demand Schools Low Prestige Low Affordability Low Value Low Sacrifice 54 Courtesy of Marketing Independent Schools in the 21 st Century, Chapter six, “The Affordability Dilemma” by Mark Mitchell

Where does my school fall… • A School’s price and approach to affordability should be in line with the school’s actual place in the PAVS Matrix…not the place to which a school aspires. • It is hard for a school’s leadership to “own” their true relative ranking (when it is not the top one), as they are so personally fond of the school that their loyalty to the school blinds them to the relative prestige of the school. • Tuitions at schools are often set in relationship to other schools that actually in a higher relative position. • Pricing a school in relation to that of schools in different “relative demand” position is dangerous in the long term either risking enrollment shortages (usually) or leaving too much potential revenue on the table (rarely). 55

“Relative Demand” Based Strategies • Highest Demand: The Enviable Position. These schools have high prestige and high affordability…making them seem like a good value, regardless of their price. They have tremendous price inelasticity. Their strategy is to charge a very high sticker price and promote their need based aid program to keep qualified applicants in the pool. • High Demand: These schools probably find it most difficult to diversify the student body. Since prestige is high, it receives many applications and may have waitlists, but because its affordability is low, only families with substantial resources can pay the price. They are very near (or slightly above) their price ceiling. This school needs to aggressively communicate the availability of financial aid and this school needs to market the value provided. 56 Courtesy of Marketing Independent Schools in the 21 st Century, Chapter six, “The Affordability Dilemma” by Mark Mitchell

“Relative Demand” Based Strategies • Average Demand: Although less prestigious, this school is still considered just as affordable and may be more accessible. This school might have some difficulty diversifying socio-economically as higher income families may be less willing to attend due to the lower prestige perception. Those full-pay families have unlimited choice and are drawn to higher prestige schools. The solution for these schools may be to offer an incentive-based, merit oriented program in addition to its need based program to attract the wealthy, high achieving students who might enhance its prestige and widen its socioeconomic diversity. • Low Demand: The most difficult position. It is neither prestigious nor affordable. Few will be willing to make a sacrifice to enroll here. These schools must work hard to enhance and communicate the quality of the school and its programs to persuade that it is worth the price. If successful at this strategy over time this school can eventually become a Tier II school. As a short term solution this school could adopt net tuition revenue strategies (discounting) to increase its affordability…even while its relative prestige is still low. 57 Courtesy of Marketing Independent Schools in the 21 st Century, Chapter six, “The Affordability Dilemma” by Mark Mitchell

*from "Liberal Arts Colleges: Thriving, Surviving or Endangered? ": David W. Breneman The Brookings Institution Enrollment Demand, Price and Revenue* Demand Price High Tuition Revenue Low Tuition (High Tuition Low. Tuition Revenue Enrollment) (Price X Enrollment) Tuition Revenue (Low Tuition, High FP Enrollment) 0 Low FP Enrollment Full Paying High FP Students Enrollment 58 Enrollment

Tuition for High Demand School to Match Moderate School’s Enrollment Tuition for Low Demand School to Match Moderate School’s Enrollment

One pricing approach….

Affordability Challenge Solutions • • • Market Value: Internally and Externally Proactively Attend to Student Retention Moderate Tuition Growth – Grow non-tuition revenue sources – Reduce operating costs • Use Net Tuition Revenue Accounting – Push Enrollment Capacity

Full Paying Tuition Revenue

Optimal Enrollment Full Paying Tuition Revenue

Optimal Enrollment Full Paying Tuition Revenue

Unfunded Aid FA Revenue Full Pay Revenue

Full Pay Revenue Unfunded Student Aid FA FA Revenue

Enrolled Yield Admits Applications 67

Admission Accountability • QUALITY and composition of Student body: Academic, Diversity, Extracurricular. • QUANTITY - Enrollment at optimal level (capacity). • REVENUE -Net Tuition Revenue.

Financial Aid is not real money. . . • Financial Aid is potential revenue lost • Unless a school is turning away qualified full paying students, in order to make a space for a student receiving financial aid, there is no revenue lost by admitting students who receive aid. • In fact, financial aid students are a valuable source of revenue!

Is the glass half empty or half full? • Net Tuition Revenue = the tuition remaining after the marginal cost of educating that student (receiving aid) is subtracted from tuition paid. • Tuition = $20, 000 but family only pays school $10, 000 and the additional marginal cost to educate that child is $2, 000. Net tuition revenue is $8, 000. • So, this student could be viewed as a $10, 000 loss (traditional F/A accounting) or a $8, 000 gain (net tuition revenue accounting).

Students on Aid are a source of income, not a cost to the school. • Look at the tuition revenue (beyond marginal costs) generated by students on financial aid. • In most schools, the revenue generated from families on financial aid is significant.

Cranbrook Upper School Financial Aid Revenue as % of Total

Spending more aid is fiscally responsible. . . “Capping the amount of unfunded student aid is not an option (for schools under capacity). And yet, that is precisely the type of move that college officials are tempted to try, ignoring the logic of the downward sloping demand curve. Capping unfunded student aid at some arbitrary percentage of the expense budget, unrelated to the demand curve, could result in lower enrollments and a loss in net tuition revenue. ” David W. Breneman Liberal Arts Colleges: Thriving, Surviving or Endangered?
 revenue, enrollment")
How do you move towards Net Tuition Revenue accountability? • Prepare: 1) revenue, enrollment and financial aid histories; 2) a financial analysis of the potential impact; 3) a budgeting system. • Work to get all constituencies (Admission, Business Manager, Head, Board) to understand concept. Assure them that this will make admission more financially accountable. • Supply Head and Board with information necessary to accept tuition revenue and let go of traditional financial aid accounting.

Challenges of Net Tuition Revenue Accounting • Accurate accounting of both tuition revenue and financial aid. • Realistic two or three year enrollment and financial aid projections. • Establishing the school’s true capacity, without increasing the fixed costs. • Establishing the marginal cost of educating one additional student at your school. • Getting the Admission/Financial Aid Director, Head, Business Manager and the Board to fully understand the concept and ramifications of NTRA.

Budgeting • Spread awards across grades, don’t commit too much aid to younger students. • Don’t spend too much of future years’ budgets. • Have F/A goals or limits as to how many full, half, small, etc. . awards to be given. • Create a system to track tuition revenue and F/A numbers accurately. • (Go to spreadsheet).

Affordability Challenge Solutions • • • Market Value: Internally and Externally Proactively Attend to Student Retention Moderate Tuition Growth – Grow non-tuition revenue sources – Reduce operating costs • • • Use Net Tuition Revenue Accounting Push Enrollment Capacity Consider Merit Aid

Merit Scholarships Advantages: • Gets talented families past “sticker shock” to apply for the “honor” of winning a merit scholarships…vs. the “shame” of having to ask for need based aid. • Marketed correctly it will generate large numbers of new applicants…many of whom would not have considered applying to any of our schools. • Many of the “runner-up” candidates will decide they want to enroll, even after they do not win the scholarship. • Will add a good number of exceptionally talented students to our schools, thus increasing the prestige of the independent school industry in Ohio 78

Merit Scholarships Disadvantages: • Could compete with need-based budget…thus setting up competition between socio-economic diversity and academic talent. • Could trigger a merit aid “war” thus lowering all of our net tuition revenues • Could be poorly perceived by our current students when they learn they are ineligible. • Not applicable to some types of independent schools (LD, elementary only, etc) 79

Optimal Enrollment Full Paying Tuition Revenue

Optimal Enrollment Full Paying Tuition Revenue

Affordability Challenge Solutions • Market Value: Internally and Externally • Proactively Attend to Student Retention • Moderate Tuition Growth – Grow non-tuition revenue sources – Reduce operating costs • • • Use Net Tuition Revenue Accounting Push Enrollment Capacity Consider Merit Aid Market Affordability Align Aid Distribution with Institutional Needs

83

84

Affordability Challenge Solutions • Market Value: Internally and Externally • Proactively Attend to Student Retention • Moderate Tuition Growth – Grow non-tuition revenue sources – Reduce operating costs • • • Use Net Tuition Revenue Accounting Push Enrollment Capacity Consider Merit Aid Market Affordability Align Aid Distribution with Institutional Needs

Economic Trends and Financial Aid 22 -Yr Avg Ann Chg in Aid Granted: 7. 61% 91 -92: Avg Aid up 13. 3% 02 -03: Avg Aid up 13. 1% Avg Apps up 6. 5%

Key Learnings § Anticipate and plan for spending rate increase for financial aid to be 1. 5 to 2 times more than normal – Important: This does not mean 1. 5 to 2 times more in dollar amount; it means 1. 5 to 2 times greater percentage increase in aid spending over a typical year § Don’t be squeamish about the spike in financial aid you’re about to experience – It’s what has helped schools weather the storm in the past – It’s a natural consequence of downturn that more people will need more help – In a most-likely scenario, the spike will only be necessary for a year

Dealing With… § Job and Income Loss § – Remind families that the application seeks a “snapshot in time” of current situation – Lowered values will be considered in assessments if they complete the application correctly – Work to get a projected income statement and documentation – Use “provisional” or semester-based awards – Follow up regularly for updated job status § Unusual Expense Allowances Decreasing Net Worth § – View carefully case-by-case – Allow more leeway if credit cards used to pay normal expenses due to income loss – Count annualized monthly payments as unusual expenses Restricted Access to Credit – Not many families rely on credit to pay ind sch tuition – Your Tuition Solution remains the sole player still providing K 12 tuition loans

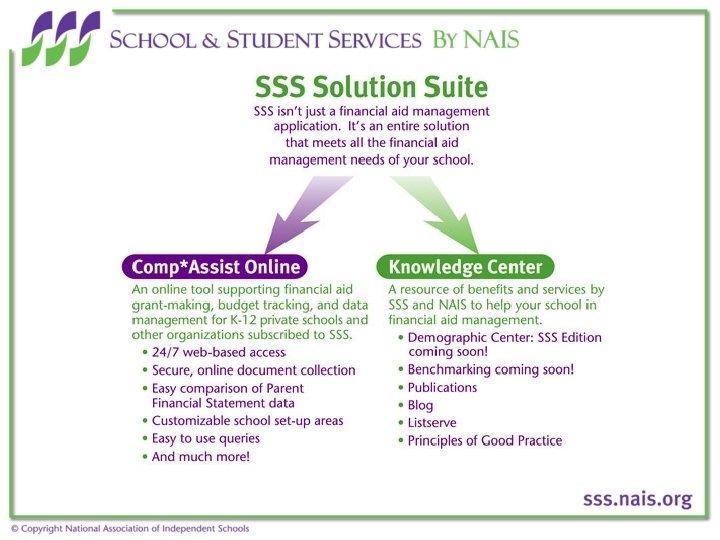
Key Features of SSS 2009 -2010 • SSS Solution Suite offers comprehensive financial aid information • Leading technology for financial aid processing to make your school run faster and smarter • Web-based platform (for schools and families) • SSS to collect your required tax and other documentation • SSS will scan, index, and make documents available on the web within the application • SSS will capture relevant information from required documents and present to schools for review

Web-Based Platform • Access SSS anywhere you can access the web • The site is password protected and secure • Applications processed all year so financial aid awards can be made all year • NAIS can make any updates to the system quickly

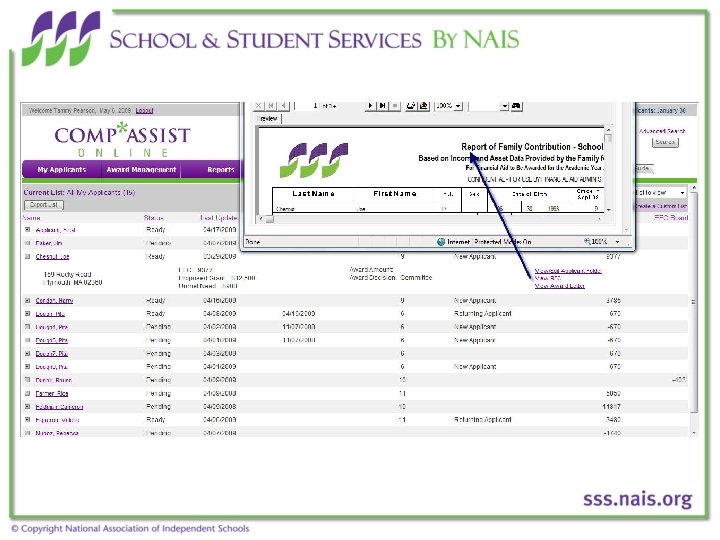
Web-Based Applicant Management

Document Handling • Customize what documents you require • SSS will collect all documentation and indicate “complete” files • All information sent to SSS is secure • Documents are scanned within 48 hours of receipt • Documents are kept in paper file throughout the school year then securely shredded • Electronic files are retained indefinitely • Document handling flexibility • Family may send to SSS • School may scan and upload to family file (no data capture on this option)

One-Stop Document Management

Scan, Index, and View • SSS will scan and index all received documentation • You may view all documentation received from families • You may choose to view only the docs associated with certain information from the PFS • All scanned docs will be PDF and available for printing, if necessary

Data Capture and Professional Judgment • SSS will capture relevant information from required documents and present PFS and other information side by side • You have the ability to modify PFS fields from that information while maintaining the original information • Real-time change to the RFC • View information document with a click of the mouse

Budget and Data Management • Calculate awards • Manage your financial aid budget • Create custom reports to add to standard report library • Access other NAIS data sources to analyze and plan • Export data to other applications

Web Portal for Parents • Separate parent portal that retains historical information • Populate new year’s form with existing information to help parents enter current information more easily • One place for parents to submit all documents • Parents can check on the status of their documents

NAIS Demographic Center: SSS Edition • Data included with SSS by NAIS subscription • Summary Reports of Key Variables • School age population • Household Income • Family Income • Trend and Percent Reporting • Block Group, Zip code, City, County,

Rebuilding SSS with Schools • New SSS has been in active development with the NAIS school community for three years • Seven pilot schools have been using the evolving beta version for financial aid processing for three years • Final group of 10 schools conducting user interface testing • Continuous feedback gathered from schools at demonstrations held around the country “The new SSS offers schools increased efficiency and flexibility in processing and offers families increased ease of transactions and security. NAIS has been very helpful through the pilot program and are ready to implement the new SSS with training and great customer care. ” – Russ Gagarin, Director of Admissions and Financial Aid at Landon School, MD
Built")
The New SSS The tried and true with the cutting edge new! • (Re)Built to Help Schools Help Families • Allows the same art and science approach to financial aid awarding • Science to determine general need • Art to customize need based on individual situations • The cutting edge of financial aid processing to make your school run faster and smarter! • • • web-based solutions customized document collection paperless offices secure information storage and retrieval side-by-side information comparison SSS Solution Suite to help answer all of your financial aid questions


The End 107

108

SSS 2009 Timeline • May 15 –Subscription Opens • June thru August – SSS and Comp*Assist Online Demonstrations in-person and via webinar • August – Paper PFS and Financial Aid Guide available • October 1 – Comp*Assist Online available to schools (customize your experience) • November 1 – PFS Online available for parents
")
New SSS Pricing minus Early Bird Discount minus Fee Waiver value ($50 before 9/1/09) (5 x$35=$175) $250 $125 $200 $75 $25 $0 Enrollment Cost NAIS Members Schools 175+ enrolled Schools <175 enrolled Non-NAIS Members Schools 175+ enrolled Schools <175 enrolled Family Costs Paper PFS Online PFS $350 $200 $300 $150 PFS $42 $35 $125 $0 Add’l School Reports $0 $0

Multiple Choice Quiz When there is an exciting new project or opportunity for your schools admission/marketing operation what are you most likely to do? A. B. C. D. Consider it for a little while, but decide the office is just so swamped it will have to wait. Work with the staff to eliminate some current projects/tasks to make time and find money to do this new project well. Add this new project on top of everything else, and hope you can get it all done and paid for…somehow. My office is too busy to even think about new projects/initiatives.

Low URGENT High Time Low IMPORTANT High
 Low IMPORTANT High")
Low URGENT High Time (What we should do) Low IMPORTANT High

High Time URGENT Subtract Low Add Low IMPORTANT High

“Smart organizations ignore the urgent. Smart organizations understand that important issues are the ones to deal with. If you focus on the important stuff, the urgent will take care of itself. ” “The easiest thing to do is to allow the urgency of the situation to force us to make the decisions (or take the actions) that we'd rather not take. Why? Because then we don't have to take responsibility for what happens. The situation is at fault, not us. ” From “If it’s urgent, ignore it” by Seth Godin

Exercise at School 2 1. 2. 3. List two ideas you hope to add to your add office’s operations this next year. Now, list the items/tasks which your office will discontinue doing to allow enough time and/or money to accomplish these new initiatives? How will you (credibly) explain/justify the discontinuation of a previously executed task or service to your Head/Board?
- Slides: 116