Aerodynamics of Flow Around a Cylinder Group 2


: resultant viscous forces acting on a body ã Pressure")


 ã Total Pressure: ã Drag Force:")
 Dimensionless Drag coefficient, CD")
, skin friction drag is negligible.")
 For a cylinder, Drag force: ã Lift force: r")


 äRepeat procedure with the")


 X/D=5: Re = 53, 649 ã n ã")

: Re = 35, 000 ã CD = 1.")


 seems more accurate. Pressure differential inside the")

- Slides: 25
Aerodynamics of Flow Around a Cylinder Group 2 A: Adya Ali Andrew Parry James Sizemore Dwayne White
Overview Objective ã Theory ã Experimental Procedure ã Results and Discussion ã Error Analysis ã Conclusion ã
Objective To find the aerodynamic lift and drag forces on a circular cylinder placed in uniform free-stream velocity. ã To find drag, lift and pressure coefficients using different methods: ã ãWake Measurements ãNormal pressure distribution
Theory Skin friction drag (Df): resultant viscous forces acting on a body ã Pressure drag (Dp): due to unbalanced pressure forces caused by flow separation ã Total drag = skin friction drag + pressure drag ã ã D = Df + Dp
Method 1 - Wake Measurements Determine the velocity profiles in the wake ã Select two sections ã ãSection 1 (imaginary)- to account for the pressure difference ãSection 2 - to obtain wake measurements ã *Courtesy of Dr. Alvi’s Lab Manual (exp 7)
Method 1 - Equations ã Conservation of Momentum: W= width of body u 1, u 2=velocities ã Assume no pressure loss between sections 1 & 2.
Method 1 - Equations (cont’d) ã Total Pressure: ã Drag Force:
Method 1 - Equations (cont’d) Dimensionless Drag coefficient, CD
Method 2 -Pressure Distribution For large Reynolds number (Re>103), skin friction drag is negligible. ã Total drag pressure drag ã Image reproduced from “Aerodynamics for Engineers”, J. Bertin & M. Smith
Method 2 -Pressure Distribution (cont’d) For a cylinder, Drag force: ã Lift force: r = radius of cylinder p = pressure = angular position
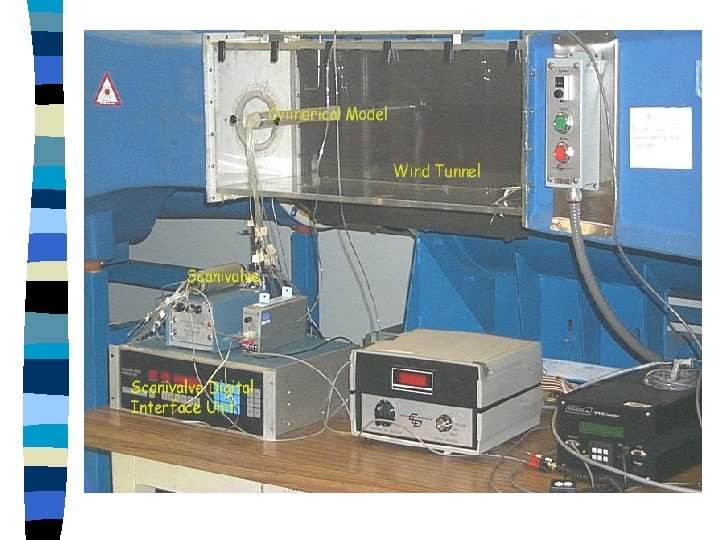
Experimental Technique ã Apparatus ãWind tunnel - airflow driven by a fan Image reproduced from “Fundamentals of Aerodynamics” J. Anderson, Jr. ãPitot-static tube - used to measure the velocity of the wind in the wake
Experimental Technique ãCylindrical test model - with pressure ports along its circumference Courtesy Dr. Alvi’s Lab Manual
Experimental Technique ãScanivalve and scanivalve digital interface unit ãADC Card on Pentium-based PC ãComputer-controlled vertical drive
Experimental Technique ã Procedure ãWake Measurement: äSelect 2 locations, äSet wind tunnel speed counter at 550; (V=30. 68 m/s) äMeasure dynamic pressure upstream of the cylinder äMove pitot-static tube to the center of the cylinder
Experimental Technique äMeasure output at vertical locations (4 mm intervals) äRepeat procedure with the cylinder at x/D = 10 ãNormal Pressure Distribution äSet wind tunnel speed counter at 550 (30. 68 m/s) äRecord the output gauge pressure at each port äRepeat the procedure for counter reading at 350 (17. 83 m/s)
Results ã Wake Profile x/D=5
Results ã Wake Profile x/D=10
Drag Coefficients: V= 30. 68 (m/s) X/D=5: Re = 53, 649 ã n ã CD =. 76 (+/-). 39 X/D=10: Re = 54, 034 Theoretical Drag Coefficient: Re = 59, 380 n CD = ã n 1 . 67 (+/-). 013 V =30. 68 (m/s)
Pressure Coefficient
Drag Coefficients ã V=17. 83 (m/s): Re = 35, 000 ã CD = 1. 26 (+/-). 54 V=30. 68: Re = 60, 000 ã CD = ã ã Theoretical Drag Coefficient: CD = 1; CL = 0 Transition Re: 300, 000 - 500, 000 1. 19 (+/-). 079 V =17. 83 (m/s) V =30. 68 (m/s)
Lift Coefficients ã Theoretical Lift Coefficient: n CL = 0
Error Analysis ã Instrument ã Pitot-static tube ã Center calibration for cylinder wake ã Integration ã Trapezoidal approximation ã Wind Tunnel ã Length of the wind tunnel ã Width of wind tunnel
Conclusion ã ã Method 2 (pressure ports) seems more accurate. Pressure differential inside the wake is unsteady. Outside the wake the pressure differential is steady. The pitot-static tube can measure turbulent fluctuations accurately.
THE END QUESTIONS?