Advanced Topics in STR DNA Analysis Validation Aspects


? Gene. Scan function Genotyper function Peak detection threshold")

 •")
 – “the lowest content that can be measured")
 • Typically 3 times the signal-to-noise (based on standard deviation")
 One allele peak above")
 J. Forensic Sci.")
 J. Forensic Sci.")
, 661 -676 • Different 310")
 • 25 Individuals – 63 pg to 1 ng amplifications")
 With sufficient input DNA one can stay away")

 • Point of saturation for an instrument detector so that")


")

 647 -660 • PP")


 854")


 Microvariants can appear in the 4 base repeat motif present")


 4% p. DMA")


 http: //www. cstl. nist. gov/biotech/strbase/validationworkshop. htm")

![Student's t-Tests "Student" (real name: W. S. Gossett [1876 -1937]) developed statistical methods to](https://slidetodoc.com/presentation_image_h/cb5094fa54c824ecad972cb63f7166fc/image-60.jpg "Student's t-Tests \"Student\" (real name: W. S. Gossett [1876 -1937]) developed statistical methods to")

 http: //www. fbi. gov/hq/lab/fsc/backissu/july 2004/standards/2004_03_standards 02. htm 3.")


 Validation is a")

 8. 1. 3 Internal validation")

")
")


: 66 -96 J. Forensic Sci.")


 COfiler kit allele relative size ranges 6 15 CSF 1 PO")


 Manually filled syringes replaced by mechanical")


;")


- Slides: 90
Advanced Topics in STR DNA Analysis Validation Aspects to Consider in Bringing a New STR Kit “On-Line” AAFS 2006 Workshop #6 Seattle, WA February 20, 2006 john. butler@nist. gov Dr. John M. Butler Dr. Bruce R. Mc. Cord mccordb@fiu. edu
Validation Aspects to Consider in Bringing a New STR Kit “On-Line” Outline for This Section Bruce • Setting peak detection thresholds • Measuring sensitivity, dynamic range, resolution, precision • Development of data interpretation guidelines John • Validation definitions and requirements for documentation • Determining the types of tests and numbers of samples to run • Examples
Setting thresholds for the ABI 310/3100 • Where do current ideas on instrument thresholds for the ABI 310/3100 come from? • How do I set these values in my laboratory? • Why might they vary from one instrument to the next? • How do these thresholds affect data interpretation?
What is a true peak (allele)? Gene. Scan function Genotyper function Peak detection threshold Stutter percentage Peak height ratio (PHR) Signal (S) Allele 1 True allele Allele 2 Noise (N) Stutter product Heterozygote peak balance Signal > 3 x sd of noise PHR consistent with single source Typically above 60% Stutter location above 15%
Threshold Settings for the ABI 310/3100 Detection Limit: 3 x the standard deviation of the noise. Estimated using 2 x peak to peak noise. (approximately 35 - 50 RFUs) Limit of Quantitation: 10 x the standard deviation of the noise Estimated using 7 x peak to peak noise (150 -200 RFUs) Below this point estimates of peak area or height are unreliable. Dynamic Range: The range of sample quantities that can be analyzed from the lowest to the highest (linear range is also important) Stochastic Threshold: Level of quantifiable DNA below which peaks can show severe imbalance (peak height ratios below 60%) Approximately 150 -200 RFUs. Enhanced stutter also occurs at these signal levels. Will be covered more in the low copy number section of this workshop…
The Scientific Reasoning behind the Concept of an Analytical Threshold (limit of detection) • This is fundamentally an issue of reliability • For a peak intensity three times the standard deviation of the noise there is a limited chance that such a signal is the result of a random fluctuation • This is because 99. 7 percent of all noise signals fall below this value (from the definition of a Gaussian curve) • Below this point the very real possibility exists that what you think is a peak is simply a statistical fluctuation in the baseline noise.
Sensitivity • Limit of detection (LOD) – “the lowest content that can be measured with reasonable statistical certainty. ” • Limit of quantitative measurement (LOQ) – “the lowest concentration of an analyte that can be determined with acceptable precision (repeatability) and accuracy under the stated conditions of the test. ” • How low can you go? EURACHEM Guide (1998) The Fitness for Purpose of Analytical Methods: A Laboratory Guide to Method Validation and Related Topics, p. 43; available at http: //www. eurachem. ul. pt/guides/valid. pdf
Limit of Detection (LOD) • Typically 3 times the signal-to-noise (based on standard deviation of the noise) or 2 x Np-p Is this peak real? Yes, it is a peak but you cannot rely on it for concentration determinations as it is not >10 S/N > 2 Np-p 2 x Np-p (baseline in a blank)
Types of Results at Low Signal Intensity (Stochastic amplification potential) One allele peak above the detection threshold and one below 220 RFUs Straddle Data Detection threshold 200 RFUs • Only one allele in a pair is 190 RFUs above the laboratory stochastic threshold Allelic Drop-out • one or more sets of alleles do not amplify 1 ng input DNA 50 pg input DNA
TWGDAM validation of Amp. Fl. STR Blue Wallin et al. (1998) J. Forensic Sci. 43(4): 854 -870 • Minimum cycle # (27 -30 cycles examined) • Amplification adjusted to 28 cycles so that quantities of DNA below 35 pg gave very low peaks or no peaks (below the analytical threshold!) • 35 pg is approx 5 cells • (but is 35 pg the analytical threshold? ) Determining this value might be a useful goal of a validation study
TWGDAM validation of Amp. Fl. STR Blue Wallin et al. (1998) J. Forensic Sci. 43(4): 854 -870 Determination of Minimum Sample • Goal: avoid situations where peak imbalance results in only one detectable allele from a heterozygous pair. • Perform serial dilution (1 ng- 8 pg) of 2 control samples which were heterozygous at all 3 loci – Samples above 125 pg had peak height RFUs above 150 – Below 125 pg peak heights were not significantly above background – At 31 pg peaks were very low or undetectable • “Peaks below 150 RFU should be interpreted with caution” Why? Noise and stochastic fluctuation!
Sensitivity of Detection Moretti et al, JFS, 2001, 46(3), 661 -676 • Different 310 instruments have different sensitivities; determination of stochastic threshold should be performed following in-house studies – Variations in quantitation systems – Variations in amplification systems – Variations in instrument sensitivity • Peaks with heights below the threshold should be interpreted with caution – Caution should be used before modification of • Amplification cycles • Electrophoretic conditions
Sensitivity Study (Debbie Hobson-FBI) • 25 Individuals – 63 pg to 1 ng amplifications with Profiler Plus and Cofiler – amplicon run on five 310 s – Gene. Scan Analysis threshold sufficient to capture all data – Geno. Typer: category and peak height • Import data into Excel – peak height ratios determined for heterozygous data at each locus
Sensitivity Study: Profiler Plus (Debbie Hobson-FBI) With sufficient input DNA one can stay away from low peak heights But note variation in signal!
Offscale Data – Just as important as low signal intensity • Elevated baselines are seen with overloaded samples- Moretti et al, JFS 2001, 46(3)647 -660 • Probably due to nonspecific amplification • Stutter is artificially enhanced in such samples due to cutoff of peak top • -A may also be apparent as a result of poor PCR conditions
Limit of Linearity (LOL) • Point of saturation for an instrument detector so that higher amounts of analyte do not produce a linear response in signal (Linear range < Dynamic range) • In ABI 310 or ABI 3100 detectors, the CCD camera saturates leading to flat-topped peaks. Off-scale peaks
Useful Range of an Analytical Method Dynamic range Instrument Response limit of linearity LOL ~5 -7000 RFUs Linear range limit of quantitative measurement LOQ limit of detection LOD ~50 RFUs ~200 RFUs LOD = 3 x SD of blank LOQ = 10 x SD of blank Dynamic Range Concentration of Sample Adapted from Figure 1 -7 in Skoog, D. A. , et al. (1998) Principles of Instrumental Analysis (5 th Edition). Thomson Learning, Inc.
Matrix effects are caused by sampling outside of linear range. Overloaded samples stress the matrix calibration The effect of pull-up on an overloaded sample
Setting Laboratory Thresholds • Analytical Threshold – the minimum quantity that can be detected • Dynamic Range – the range of sample quantities (highest and lowest) that can be detected • Stochastic Threshold – the signal intensity at which a particular quantity of DNA can no longer reliably be detected – Reliability can be defined by an increase in the standard deviation of peak height intensity or an increase in the standard deviation of signal intensity or both. – The stochastic threshold is greater than or equal to the analytical threshold
How to Determine the Dynamic Range 1. Perform a series of amplifications of 5 different samples with 5. 00, 2. 00, 1. 00, 0. 50, 0. 25, 0. 13, 0. 06, 0. 03 ng DNA 2. Use your laboratory quantification system, your thermal cycler, and your 310. 3. Determine the average and standard deviation of each set of samples 4. Your dynamic range is the range of concentrations that are not overloaded. The linear range can be established by running concentration standards.
How to Set Thresholds • First determine the analytical threshold for your particular laboratory using the signal intensity from one or several CE systems Analytical threshold for this instrument is approx. 50 RFUs
How to determine the stochastic threshold • Examine intensity and peak height ratio of 5 samples at three different low concentrations (e. g. , 60, 75, and 125 pg) • Observe variation in peak height ratio and peak intensity • The stochastic threshold is the point at which this variation begins a rapid increase (change in slope of line relating std dev vs concentration) • This can also be defined as the concentration at which a set percentage of peak height ratio values fall below 60%
TWGDAM validation of Amp. Fl. STR Blue. PCR Wallin et al. JFS, 1998 43(4) 854 -870 • In approximately 80 heterozygous loci in population samples: – Average peak height ratio was 92% for each locus – D 3, v. WA, FGA – Standard deviation was 7% • Thus 99. 7% of all samples should show a peak height ratio (PHR) above 71% • Those that have a PHR of <70% may result from mixtures, low [DNA], inhibition, degradation or poor primer binding
Heterozygote Peak Height Ratios Identifiler STR Kit Developmental Validation 116 correctly genotyped population samples (n = 69– 101, depending on locus). Template inputs varied from approximately 250 pg to greater than 3 ng 60 % Low amount of input DNA (~250 pg) Collins PJ, Hennessy LK, Leibelt CS, Roby RK, Reeder DJ, Foxall PA. Developmental validation of a single-tube amplification of the 13 CODIS STR loci, D 2 S 1338, D 19 S 433, and amelogenin: the Amp. Fl. STR Identifiler PCR amplification kit. J. Forensic Sci. 2004; 49(6): 1265 -1277.
Peak height ratios Moretti et al. , JFS 2001, 46(3) 647 -660 • PP + Cofiler gave PHR >88% n= 230+ samples with a lower range PHR (-3 sd) of 59% • Suggest using 59% as a guide • 2% of single source samples were below this value • Many validation studies focus on 1 ng input DNA. What happens with lower amounts?
Heterozygote Peak Height Ratios Holt CL, Buoncristiani M, Wallin JM, Nguyen T, Lazaruk KD, Walsh PS. TWGDAM validation of Amp. Fl. STR PCR amplification kits forensic DNA casework. J Forensic Sci 2002; 47(1): 66 -96.
Heterozygote Peak Height Ratios Identifiler STR Kit Developmental Validation 60 % Heterozygote peak height ratios with varying inputs of template DNA. The results depicted are from three amplifications of a single genomic DNA at 0. 03125, 0. 0625, 0. 125, 0. 5, 1. 0, and 1. 25 ng. Multiple injections were averaged, resulting in a total of 39 data points per input amount (13 heterozygous markers × 3 repetitions). Collins PJ, Hennessy LK, Leibelt CS, Roby RK, Reeder DJ, Foxall PA. Developmental validation of a single-tube amplification of the 13 CODIS STR loci, D 2 S 1338, D 19 S 433, and amelogenin: the Amp. Fl. STR Identifiler PCR amplification kit. J. Forensic Sci. 2004; 49(6): 1265 -1277.
Peak Height Ratio Guidelines • One way to approach concentration dependence • Profiler Plus – 200 to 300 RFU: 55 to 60% – 300 to 1000 RFU: 60 to 65% – above 1000 RFU: 65 to 70% • Cofiler – 200 to 300 RFU: 60% – 300 to 1000 RFU: 60 to 65% – above 1000 RFU: 70% to 75%
TWGDAM validation of Amp. Fl. STR Blue Wallin et al. JFS, 1998 43(4) 854 -870 • Stutter increases with allele size: • Greatest amount was 8. 6% w/ sd of 0. 6, thus 8. 6 + 3(0. 6) = 10. 4 or approx. 11% is the stutter threshold • Stutter increases at low copy # Leclair et. al (2004) Systematic analysis of stutter percentages and allele % Stutter peak height and peak area ratios at heterozygous STR loci forensic casework and database samples. J. Forensic Sci. 49(5): 968 -980 Peak height (D 5 S 818)
Issues with Data below the Stochastic threshold and above the analytical threshold • PCR artifacts and stutter become prevalent • Low levels of bleed through are possible • Instrument spikes are more numerous • -A peaks may appear • Dye blobs become more significant in overall e-gram • Low level 2 nd contributors may show peaks Typically between 50 and 200 RFU – depends on validation studies
Fuzzy Logic in Data Interpretation • The ABI 310 is a dynamic system • Sensitivity varies with – – – Allele size Injection solvent Input DNA Instrument factors Presence of PCR inhibitors Gel matrix • Thus interpretation must be conservative and data from these studies yields guidelines, not rules. The results and their significance cannot be dissociated from the overall facts of the case.
So why examine low level data at all? • Detection of straddle data in which one allele is above threshold and the other is below • Detection of the presence of low level mixtures • Clues to the presence of inhibited samples or poor injections • Aids in determination if a suspect is excluded as a contributor
Other Analytical Factors to Consider • Precision • Resolution • Sizing Algorithm
Precision (Resolution isn’t enough!) Microvariants can appear in the 4 base repeat motif present in these STRs If 3 X Std. Dev. is greater than 0. 5, then a certain number of 9. 3 peaks will be labeled 10. TH 01 10 TH 01 9. 3 10 +/- 3 = 99. 7
Precision Current values in the literature range from 0. 12 to 0. 24 depending on the system and type of repeat. Most papers in the forensic literature report values under 0. 15. What affects precision? Obtaining good precision is not magic
Run-to-Run Precision on an ABI 310 Analysis of 70 samples and two allelic ladders from a set of ABI PRISM 310 runs using one allelic ladder to calibrate From Identifiler User’s Manual
Temperature Effects and DNA Secondary Structure • Even under highly denaturing conditions DNA can self associate • Differences in conformation can affect migration time • Increase precision by limiting this effect? http: //biochem. stanford. edu/biochem 201/Slides/DNA%20 Topology/065%20 Supercoiled%20 DNA%20 jpeg. JPG
How to avoid 2 Structure Effects • Elevate Temperature to 60 o • Add Strong Denaturants – 7 -8 M Urea – Pyrrolidinone • Examine response of 250, 340 peaks in ROX ladder urea Rosenblum et al. , Nucleic Acids Res. , 1997
Change in size of GS 250 peak with Temperature (Tamra Std) 4% p. DMA with 8 M urea and 5% 2 -pyrrolidinone *Rosenblum et al. , Nucleic Acids Res. (1997) 25, 19, 2925
Precision and Resolution Elevated temperatures melt out DNA 2° structure, increasing the precision of the analysis. However, resolution is lost as a result of decreased viscosity. 100 m. M TBE 2% HEC, DB-17 Capillary Temp. Resolution (bp) allele size Std. Dev. 30 1. 3 197. 4 0. 20 45 1. 6 196. 0 0. 08 60 1. 7 (n=7) 195. 6 (n=7) 0. 07 (n=200+)
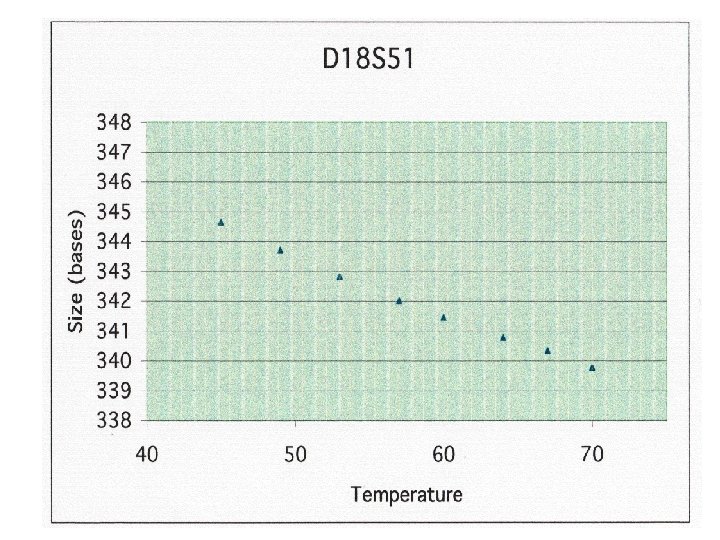
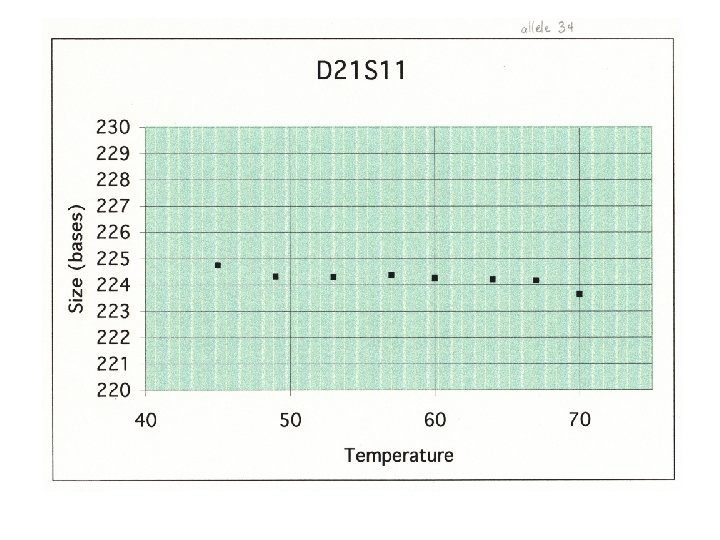
What is the effect of Temperature on Profiler+? Could it affect precision, allele size? Why do some band shifts occur at only one locus? Examine various alleles at temperatures from 40 -70 o. C What response? What sizing?
Effect of Temperature on Allele Size POP 4, p. H 8, 350 V/cm, 45 -70°C STR D 3 S 1358 v. WA FGA Amel. D 8 S 1179 D 21 S 11 D 18 S 51 D 5 S 818 D 13 S 317 D 7 S 820 Allele Size* Slope+ 12 21 30 X 19 36 26 7 8 15 111. 2 194. 9 264. 7 103. 5 170. 4 232. 4 341. 9 131. 2 205. 0 292. 8 -0. 10 -0. 07 -0. 14 -0. 13 -0. 16 -0. 03 -0. 18 -0. 09 -0. 12 -0. 09 *Estimated + Std. Dev 0. 01 0. 02 0. 01 size at 61°C °C/base, ave. of 4 measurements
Effect of Operator Chosen Sizing Method • Global Southern Method: Generates best-fit curve from all matched fragments in the size standard • Local Southern Method: Generates best-fit curve from only nearby internal lane standard data points
Global Southern Sizing Method Global Southern Method: Generates best-fit curve from all matched fragments in the size standard (ROX)
Local Southern Sizing Method Local Southern Method: Generates best-fit curve from nearby internal lane standard data points -Size est. obtained by creating a curve using 3 standard points
Effect of Operator Chosen Sizing Method l Global Southern: – Similar slopes within a locus – Differential response in slopes between loci l Local Southern: – Differential response between and within loci – Many slopes significantly larger (-0. 156 vs. – 0. 104) Hartzell, Muncy, Mc. Cord, Forensic Science International, 2003, 133, 228 -234. ,
Implications of Temperature Studies Temperature affects precision through sample denaturation New studies indicate there is a variable response to temperature especially between loci The effect is far more pronounced in local southern Temperature control is important because it affects both precision and resolution. Band shifts are a natural consequence of differential response to temperature
How Does Your Laboratory Derive Its Interpretation Rules? From your Validation Studies or Others? • Peak detection threshold – set to 50 RFU or 150 RFU based on your lab data or what FBI or manufacturer has done? Do you use S/N >3 for determining if something is a true peak? • Peak height ratio threshold – Set at 70% due to suggestion by manufacturer? Or 50 -70% based on other data? • Stutter product threshold – are Genotyper macros set to 15%, manufacturer values, or adjusted based on your validation? Does it matter? How do these values play into your mixture interpretation guidelines? • Sample Cleanup - Post PCR concentration a sample may also remove salts artificially enhancing injection. Will this move results into stochastic range?
Example of an Interpretational Guideline
What is Validation and Why Should It Be Done? • Part of overall quality assurance program in a laboratory • We want the correct answer when collecting data… – We want analytical measurements made in one location to be consistent with those made elsewhere (without this guarantee there is no way that a national DNA database can be successful). • If we fail to get a result from a sample, we want to have confidence that the sample contains no DNA rather than there might have been something wrong with the detection method…
Elements for Guaranteeing Quality Results in Forensic DNA Testing • • • Accepted Standards and Guidelines for Operation Laboratory Accreditation Proficiency Testing of Analysts Standard Operating Procedures Validated Methods Calibrated Instrumentation Documented Results Laboratory Audits Trustworthy Individuals
Assumptions When Performing Validation • The equipment on which the work is being done is broadly suited to the application. It is clean, wellmaintained and within calibration. • The staff carrying out the validation are competent in the type of work involved. • There are no unusual fluctuations in laboratory conditions and there is no work being carried out in the immediate vicinity that is likely to cause interferences. • The samples being used in the validation study are known to be sufficiently stable. Roper, P. , et al. (2001) Applications of Reference Materials in Analytical Chemistry. Royal Society of Chemistry, Cambridge, UK, pp. 110 -111.
How do you validate a method? • Decide on analytical requirements – Sensitivity, resolution, precision, etc. • • Plan a suite of experiments Carry out experiments Use data to assess fitness for purpose Produce a statement of validation – Scope of the method Roper, P. , et al. (2001) Applications of Reference Materials in Analytical Chemistry. Royal Society of Chemistry, Cambridge, UK, pp. 108 -109.
Tools of Method Validation • Standard samples – positive controls – NIST SRMs • • • Blanks Reference materials prepared in-house and spikes Existing samples Statistics Common sense Roper, P. , et al. (2001) Applications of Reference Materials in Analytical Chemistry. Royal Society of Chemistry, Cambridge, UK, p. 110.
Common Perceptions of Validation Lots of experiments are required Effort The goal is not to experience every possible scenario during validation… “You cannot mimic casework because every case is different. ” Many labs are examining far too many samples in validation and thus delaying application of casework and contributing to backlogs… Significant time is required to perform studies Time
Validation Workshop (Aug 24 -26, 2005 at NFSTC) http: //www. cstl. nist. gov/biotech/strbase/validationworkshop. htm COURSE CONTENTS Day #1 • Validation Overview (John) • Introduction to DAB Standards (Robyn & John) • Developmental Validation (John) Day #2 • Inconsistency in Validation between Labs (John) • Internal Validation (Robyn) • Method Modifications and Performance Checks (Robyn) Day #3 • Practical Exercises (Robyn) Was filmed and is being made into a training DVD as part of the President’s DNA Initiative…
Number of Samples Needed Relationship between a sample and a population of data How do you relate these two values? Data collected in your lab as part of validation studies “Sample” of Typical Data All potential data that will be collected in the future in your lab Student’s t-Test associates a sample to a population “Population” of All Data Obtained
Student's t-Tests "Student" (real name: W. S. Gossett [1876 -1937]) developed statistical methods to solve problems stemming from his employment in a brewery. Student's t-test deals with the problems associated with inference based on "small" samples: the calculated mean (Xavg) and standard deviation ( ) may by chance deviate from the "real" mean and standard deviation (i. e. , what you'd measure if you had many more data items: a "large" sample). http: //www. physics. csbsju. edu/stats/t-test. html
Student’s t-Test Curve Impact of Number of Experiments on Capturing Variability in a Population of Data 3 4. 30 4 3. 18 5 2. 78 6 2. 57 7 2. 45 8 2. 36 9 2. 31 10 2. 26 50 2. 01 100 1. 98 500 1. 96 10000 1. 96 for an infinite number of samples tested
Revised SWGDAM Validation Guidelines (July 2004) http: //www. fbi. gov/hq/lab/fsc/backissu/july 2004/standards/2004_03_standards 02. htm 3. Internal Validation …a total of at least 50 samples (some studies may not be necessary…) The document provides validation guidelines and definitions approved by SWGDAM July 10, 2003.
Design of Experiments Conducted for Validation Studies • Before performing a set of experiments for validation, ask yourself: – What is the purpose of the study? – Do we already know the answer? – Can we write down how we know the answer? • Think before you blindly perform a study which may have no relevance (e. g. , extensive precision studies) • Too often we do not differentiate learning, validation, and training
Points for Consideration • Remove as many variables as possible in testing an aspect of a procedure – e. g. , create bulk materials and then aliquot to multiple tubes rather than pipeting separate tubes individually during reproducibility studies • Who can do (or should do) validation… – – Outside contractor? Summer intern Trainee Qualified DNA analyst
What are the goals of validation studies involving a new STR typing kit? • Stutter product amounts Why? : aids in mixture interpretation guidelines (how often does your laboratory call peaks below 15% of an adjacent allele? ) • Precision studies Why? : aids in defining allele bin windows (in reality does anyone ever change the ± 0. 5 bp from the Genotyper macro? ) • Sensitivity studies Why? : aids in defining lower and upper limits • Mixture studies Why? : aids in demonstrating the limits of detecting the minor component • Concordance studies Why? : to confirm that new primer sets get the same results as original primer sets – potential of polymorphism causing allele dropout… • Peak height ratio studies Why? : aids in mixture interpretation guidelines (how often does your laboratory call peaks below a 60% heterozygote peak height ratio? )
FBI DNA Quality Assurance Audit Developmental Validation Scorecard
DNA Advisory Board Quality Assurance Standards Section 2. Definitions • (ff) Validation is a process by which a procedure is evaluated to determine its efficacy and reliability forensic casework analysis (DNA analysis) and includes: Manufacturer – (1) Developmental validation is the acquisition of test data and determination of conditions and limitations of a new or novel DNA methodology for use on forensic samples; – (2) Internal validation is an accumulation of test data within the laboratory to demonstrate that established methods and procedures perform as expected in the laboratory. Forensic Lab
Validation Section of the DNA Advisory Board Standards issued October 1, 1998 and April 1999; published in Forensic Sci. Comm. July 2000 STANDARD 8. 1 The laboratory shall use validated methods and procedures forensic casework analyses (DNA analyses). 8. 1. 1 Developmental validation that is conducted shall be appropriately documented. 8. 1. 2 Novel forensic DNA methodologies shall undergo developmental validation to ensure the accuracy, precision and reproducibility of the procedure. The developmental validation shall include the following: 8. 1. 2. 1 Documentation exists and is available which defines and characterizes the locus. 8. 1. 2. 2 Species specificity, sensitivity, stability and mixture studies are conducted. 8. 1. 2. 3 Population distribution data are documented and available. 8. 1. 2. 3. 1 The population distribution data would include the allele and genotype distributions for the locus or loci obtained from relevant populations. Where appropriate, databases should be tested for independence expectations. 8. 1. 3 Internal validation shall be performed and documented by the laboratory. 8. 1. 3. 1 The procedure shall be tested using known and non-probative evidence samples (known samples only). The laboratory shall monitor and document the reproducibility and precision of the procedure using human DNA control(s). 8. 1. 3. 2 The laboratory shall establish and document match criteria based on empirical data. 8. 1. 3. 3 Before the introduction of a procedure into forensic casework (database sample analysis), the analyst or examination team shall successfully complete a qualifying test. 8. 1. 3. 4 Material modifications made to analytical procedures shall be documented and subject to validation testing. 8. 1. 4 Where methods are not specified, the laboratory shall, wherever possible, select methods that have been published by reputable technical organizations or in relevant scientific texts or journals, or have been appropriately evaluated for a specific or unique application. FORENSIC SCIENCE COMMUNICATIONS JULY 2000 VOLUME 2 NUMBER 3
DNA Advisory Board Standards (Forensic Sci. Comm. July 2000) 8. 1. 3 Internal validation shall be performed and documented by the laboratory. 8. 1. 3. 1 The procedure shall be tested using known and non-probative evidence samples (known samples only). The laboratory shall monitor and document the reproducibility and precision of the procedure using human DNA control(s). 8. 1. 3. 2 The laboratory shall establish and document match criteria based on empirical data. 8. 1. 3. 3 Before the introduction of a procedure into forensic casework (database sample analysis), the analyst or examination team shall successfully complete a qualifying test. 8. 1. 3. 4 Material modifications made to analytical procedures shall be documented and subject to validation testing.
Overview of Internal Validation Studies 3. Internal Validation: The internal validation process should include the studies detailed below encompassing a total of at least 50 samples. Some studies may not be necessary due to the method itself. 3. 1 Known and nonprobative evidence samples 3. 2 Reproducibility and precision 3. 3 Match criteria 3. 4 Sensitivity and stochastic studies 3. 5 Mixture studies 3. 6 Contamination 3. 7 Qualifying test SWGDAM Revised Validation Guidelines http: //www. fbi. gov/hq/lab/fsc/backissu/july 2004/standards/2004_03_standards 02. htm
Suggestions for an Internal Validation of an STR Kit • Standard samples (3. 1) Between 1 and ~20 samples – Verify correct type with positive control or NIST SRM samples – Concordance study with 5 -10 (non-probative casework) samples previously typed with other kit(s) • Precision samples (3. 2) 5 -10 samples – Run at least 5 -10 samples (allelic ladder or positive control) • Sensitivity samples (3. 4) 14 samples – Run at least 2 sets of samples covering the dynamic range – 5 ng down to 50 pg—e. g. , 5, 2, 1, 0. 5, 0. 2, 0. 1, 0. 05 ng • Mixture samples (3. 5) 10 samples – Run at least 2 sets of samples – Examine 5 different ratios—e. g. , 10: 1, 3: 1, 1: 3, 1: 10 >50 samples
Additional Suggestions for Meeting the SWGDAM Revised Validation Guidelines • Match Criteria (3. 3) – As part of running a batch of samples (e. g. , 10 or 96), run one allelic ladder at the beginning and one at the end – If alleles are typed correctly in the second allelic ladder, then the match criteria (i. e. , precision window of +/-0. 5 bp) has likely been met across the entire size range and duration of the run • Contamination Check (3. 6) – Run negative controls (samples containing water instead of DNA) with each batch of PCR products • Qualifying Test (3. 7) – Run proficiency test samples
Steps Surrounding “Validation” in a Forensic Lab Effort to Bring a Procedure “On-Line” This is what takes the time… • Installation – purchase of equipment, ordering supplies, setting up in lab • Learning – efforts made to understand technique and gain experience troubleshooting; can take place through direct experience in the lab or vicariously through the literature or hearing talks at meetings • Validation of Analytical Procedure – tests conducted in one’s lab to verify range of reliability and reproducibility for procedure • SOP Development – creating interpretation guidelines based on lab experience • QC of Materials – performance check of newly received reagents • Training – passing information on to others in the lab • Qualifying Test – demonstrating knowledge of procedure enabling start of casework • Proficiency Testing – verifying that trained analysts are performing procedure properly over time
General Steps for Internal Validation • Review literature and learn the technique • Obtain equipment/reagents, if necessary • Determine necessary validation studies (there can be overlap and you only need to run a total of 50 samples) • Collect/obtain samples, if necessary • Perform validation studies maintaining all documentation • Summarize the studies and submit for approval to Technical Leader • Write-up the analytical procedure(s). Include quality assurance (controls, standards, critical reagents and equipment) and data interpretation, as applicable • Determine required training and design training module(s) • Design qualifying or competency test From Robyn Ragsdale (FDLE), Validation Workshop (Aug 24 -26, 2005 at NFSTC) http: //www. cstl. nist. gov/biotech/strbase/validationworkshop. htm
Other DAB Standards to Consider: 9. 1. 1 9. 1. 2 9. 2. 3 9. 4 10. 2 10. 3 The laboratory shall have an standard protocol for each analytical technique used. The procedures shall include reagents, sample preparation, extraction, equipment and controls, which are standard for DNA analysis and data interpretation. The laboratory shall identify critical reagents (if any) and evaluate them prior to use in casework…… The laboratory shall monitor the analytical procedures using appropriate controls and standards. The laboratory shall identify critical equipment and shall have a documented program for calibration of instruments and equipment. The laboratory shall have a documented program to ensure that instruments and equipment are properly maintained. From Robyn Ragsdale (FDLE), Validation Workshop (Aug 24 -26, 2005 at NFSTC) http: //www. cstl. nist. gov/biotech/strbase/validationworkshop. htm
Example with Identifiler STR Kit • Your lab is currently running Profiler. Plus/COfiler and wants to switch to Identifiler. What is needed for your internal validation? • What is different between Identifiler and Profiler. Plus/COfiler? – Two new STR loci: D 19 S 433 and D 2 S 1338 – Different fluorescent dyes Different – Additional fluorescent dye (5 -dye vs 4 -dye) Loci (2 extra STRs) Dyes – Different dye on internal size standard Mobility Modifiers – More loci being amplified in the multiplex Software (5 -dye) – Mobility modifiers to move allele sizes • PCR primer sequences are the same so potential allele discordance due to primer binding site mutations should not be an issue • What has been reported in terms of developmental validation for Identifiler?
ABI Kit Validation Papers J. Forensic Sci. 2002; 47(1): 66 -96 J. Forensic Sci. 2004; 49(6): 1265 -1277
Population Studies with D 2 S 1338 and D 19 S 433 • These STR loci are part of the widely used SGM Plus kit • Included in profile frequency calculator using 24 European populations and 5, 700 individuals: http: //www. str-base. org/calc. php • Budowle, B. (2001) Genotype profiles for five population groups at the short tandem repeat loci D 2 S 1338 and D 19 S 433. Forensic Sci. Comm. 3(3); available at http: //www. fbi. gov/hq/lab/fsc/backissu/july 2001/budowle 1. htm • Budowle, B. , et al. (2001) Population data on the STR loci D 2 S 1338 and D 19 S 433. Forensic Sci. Comm. 3(3); available at http: //www. fbi. gov/hq/lab/fsc/backissu/july 2001/budowle 2. htm • Butler, J. M. , et al. (2003) Allele frequencies for 15 autosomal STR loci on U. S. Caucasian, African American, and Hispanic populations. J. Forensic Sci. 48(4): 908 -911; genotypes available at http: //www. cstl. nist. gov/biotech/strbase/NISTpop. htm
Different Fluorescent Dyes Visible spectrum range seen in CCD camera 500 525 550 575 600 NED PET ROX FAM Filter F Filter G 5 JOE VIC 625 650 LIZ 675 700 nm Commonly used fluorescent dyes Arrows indicate the dye emission spectrum maximum Filter sets determine what regions of the CCD camera are activated and therefore what portion of the visible light spectrum is collected
Mobility Shift with Non-Nucleotide Linker “Mobility Modifiers” FIG. 1—NED dye labeled loci from two amplifications of a single sample using TPOX primers both with and without non-nucleotide linkers. The X-axis indicates base pair size and the Y-axes RFU. The top panel depicts the amplification without non-nucleotide linkers. Sizes for the TPOX alleles for this panel were 222. 93 and 234. 81 bp. Sizes for the TPOX alleles in the amplification using the modified primer, depicted in the bottom panel, were 229. 85 and 241. 71 bp, indicating an average shift of 6. 91 bp. Peaks heights, intralocus balance, and intracolor balance were similar in both amplifications. Collins PJ, Hennessy LK, Leibelt CS, Roby RK, Reeder DJ, Foxall PA. Developmental validation of a single-tube amplification of the 13 CODIS STR loci, D 2 S 1338, D 19 S 433, and amelogenin: the Amp. Fl. STR Identifiler PCR amplification kit. J. Forensic Sci. 2004; 49(6): 1265 -1277.
Mobility Modifiers Fluorescent dye at 5’end Primer sequence For each linker unit added, there is an apparent migration shift of ~2. 5 bp 3’-end 5’-end Non-nucleotide linkers (mobility modifiers) PCR amplification generates a labeled PCR product containing the mobility modifiers Figure 5. 7, J. M. Butler (2005) Forensic DNA Typing, 2 nd Edition © 2005 Elsevier Academic Press
Size overlap (A) COfiler kit allele relative size ranges 6 15 CSF 1 PO JOE-labeled (green) 279. 65 bp 6 317. 67 bp 15 D 7 S 820 NED-labeled (yellow) 256. 01 bp 292. 62 bp (B) Identifiler kit 10 non-nucleotide linkers allele relative size ranges 6 = ~ +25 bp shift 15 D 7 S 820 6 FAM-labeled (blue) 255. 15 bp 291. 58 bp 6 15 CSF 1 PO 6 FAM-labeled (blue) 304. 69 bp 341. 84 bp Figure 5. 8, J. M. Butler (2005) Forensic DNA Typing, 2 nd Edition © 2005 Elsevier Academic Press
Sizing Precision with Non-Nucleotide Linkers No apparent significant decrease in precision with mobility modifiers… Collins PJ, Hennessy LK, Leibelt CS, Roby RK, Reeder DJ, Foxall PA. Developmental validation of a single-tube amplification of the 13 CODIS STR loci, D 2 S 1338, D 19 S 433, and amelogenin: the Amp. Fl. STR Identifiler PCR amplification kit. J. Forensic Sci. 2004; 49(6): 1265 -1277.
Instrument/Software Upgrades or Modifications • What should be done to “validate” new upgrade? – ABI 7000 to ABI 7500 – ABI 3100 to ABI 3130 xl – Gene. Scan/Genotyper to Gene. Mapper. ID • Try to understand what is different with the new instrument or software program compared to the one you are currently using (e. g. , ask other labs who may have made the switch) • If possible, try to retain your current configuration for comparison purposes for the validation period Run the same plate of samples on the original instrument/software and the new one
ABI 3100 ABI 3130 xl (upgraded from 3100) Manually filled syringes replaced by mechanical pump with polymer supplied directly from bottle
ABI 3130 xl vs ABI 3100 What NIST did to “validate” a 3130 xl upgrade • Ran plates of samples on both instruments with same injection and separation parameters and compared results – Data Collection version 1. 0. 1 (3100) vs 3. 0 (3130 xl) – POP-6 (3100) vs POP-7 (3130 xl) – 36 cm array (3100) vs 50 or 80 cm array (3130 xl) • Ran several plates of Identifiler samples and compared allele calls (noticed a sensitivity difference with equal injections and relative peak height differences between dye colors) – all obtained allele calls were concordant • Ran a plate of Profiler Plus samples and compared sizing precision – precision was not significantly different • Also examined SNa. Pshot products and mt. DNA sequencing data
Comparison of ABI 3100 Data Collection Versions Same DNA sample run with Identifiler STR kit (identical genotypes obtained) Gene. Scan display ABI 3100 (36 cm array, POP-6) Data Collection v 1. 0. 1 5 s@2 k. V injection ABI 3130 xl (50 cm array, POP-7) Data Collection v 3. 0 5 s@2 k. V injection 10/04/05 KK_A 4; well A 2 (JK 3993) Relative peak height differences are due to “variable binning” with newer ABI data collection versions. Difference in the STR allele relative mobilities (peak positions) are from using POP-6 vs. POP-7.
Validation Section of the DNA Advisory Board Standards issued July 1998 (and April 1999); published in Forensic Sci. Comm. July 2000 STANDARD 8. 1 The laboratory shall use validated methods and procedures forensic casework analyses (DNA analyses). 8. 1. 1 Developmental validation that is conducted shall be appropriately documented. 8. 1. 3 Internal validation shall be performed and documented by the laboratory. FORENSIC SCIENCE COMMUNICATIONS JULY 2000 VOLUME 2 NUMBER 3
Why is Documentation of Validation Important? 9. Documentation of Validated Methods 9. 1 Once the validation process is complete it is important to document the procedures so that the method can be clearly and unambiguously implemented. There a number of reasons for this. The various assessments of the method made during the validation process assume that, in use, the method will be used in the same way each time. If it is not, then the actual performance of the method will not correspond to the performance predicted by the validation data. Thus the documentation must limit the scope for introducing accidental variation to the method. In addition, proper documentation is necessary for auditing and evaluation purposes and may also be required for contractual or regulatory purposes. 9. 2 Appropriate documentation of the method will help to ensure that application of the method from one occasion to the next is consistent. EURACHEM Guide (1998) The Fitness for Purpose of Analytical Methods: A Laboratory Guide to Method Validation and Related Topics, p. 37; available at http: //www. eurachem. ul. pt/guides/valid. pdf
Laboratory Internal Validation Summaries Soliciting Information on Studies Performed by the Community