Advanced Topics in STR DNA Analysis Capillary Electrophoresis


3, 000, 000")


 –")


 • “Gel” is")

")
 and molecular weight (chain length) will affect resolution viscosity limits applicable")


 • Distill dimethyl acrylamide")
,")
 (PDMA), • 100 m. M TAPS (p. H 8.")


 Stacking with Low Ionic Strength DNA - DNA DNA - High")
![Ion Mobility Effects The Injection of DNA by voltage is described by [DNAinj] =](https://slidetodoc.com/presentation_image_h2/aee7308ea4d605e3764e6d05f0d16ddb/image-41.jpg "Ion Mobility Effects The Injection of DNA by voltage is described by [DNAinj] =")


! – ABI sells")

 Solvent Resolution Water")

 blank + Mg. Cl")

 I Charged coupled device capillary Grating")


 • Dye-labeled nucleotide insertion during")
 JOE (Green) Emission 548 Emission")


")

 Filter Set C Set F 6 FAM (5 FAM) TET")

")


 The use of entangled polymer buffers")


- Slides: 73
Advanced Topics in STR DNA Analysis Capillary Electrophoresis Instrumentation: Theory and Application AAFS 2006 Workshop #6 Seattle, WA February 20, 2006 john. butler@nist. gov Dr. John M. Butler Dr. Bruce R. Mc. Cord mccordb@fiu. edu
Capillary Electrophoresis Instrumentation: Theory and Application Outline for This Section • • • Historical perspective Advantages and disadvantages of CE ABI 310 and 3100 instrument components Injection Separation Detection
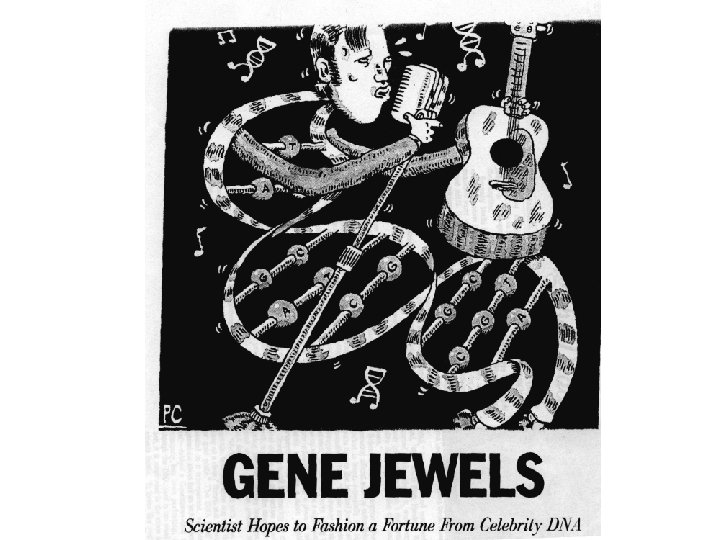
There are 23 pairs of Chromosomes 3 billion base pairs means 1/(1/4)3, 000, 000 possible combinations Melanie Mc. Cord Where is the important information for identification Vs The part that tells us how to play the saxaphone?
DNA Analysis by RFLP Long Process; Requires High Quality DNA and Lots of It…
Inventor of the PCR "I think I might have been stupid, in some respects, if it weren't for my psychedelic experiences. -Kary Mullis, Ph. D. , Nobel Prize Laureate, Chemistry, 1993
The Process of DNA Typing via PCR
The Application • Speed and detection capabilities of DNA analyses have improved since the development of PCR – Increase in number of complex assays necessitates automated testing procedures • Automated systems are needed to increased sample throughput – Automated systems must be robust and must demonstrate long term stability
What are the keys to a useful measure of genetic variability, esp. with STRs ? • Reproducible results from day to day • Resolution of a single base over the range of analysis • Precision under 0. 17 bp for size separation • Stability over time and insensitivity to matrix effects • Relative accuracy (not absolute)
Methods of determination of genetic variability • Probe hybridization • Charge based mobility and separation – gel and capillary electrophoresis • Partitioning and ion exchange – HPLC • Conformation – SSCP, heteroduplex polymorphism • Size measurement – Mass Spectrometry – All of these have been used one time or another for STR/VNTR analysis
How do the various methods add up at present? • Probe based methods– can be difficult to detect length variations • HPLC– lacks resolution • MS – – has trouble with sizes above 90 bp • Conformational polymorphisms– will not always vary sufficiently • Electrophoresis– currently best option- but can have trouble with precision and resolution
The Issues 1. Although the PCR is rapid and efficient, sample loads 2. keep increasing 2. Soon all sexual offenders (and other felons) wil be required to submit a sample for testing. Current estimated backlog is 540, 000 samples. 3. The number of untested rape kits nationwide is estimated to be 180, 000 to 500, 000. 4. What technique could be used to automate the analysis of so many samples?
Why Use Capillary Electrophoresis for DNA Analysis? 1. Injection, separation, and detection are automated. 2. Rapid separations are possible 3. Peak information is automatically stored for easy retrieval.
Capillary Electrophoresis System Capillary filled with entangled Polymer Argon Ion Laser Capillary + Buffer Deconvoluted Result 5 -20 k. V Buffer (Sample)
Process Involved in 310/3100 Analysis • Injection – electrokinetic injection process (formamide, water) – importance of sample stacking • Separation – – Capillary – 50 um fused silica, 47 cm (36 cm to detector) POP-4 polymer – Polydimethyl acrylamide Buffer - TAPS p. H 8. 0 Denaturants – urea, pyrolidinone • Detection – fluorescent dyes with excitation and emission traits – CCD with defined virtual filters produced by assigning certain pixels
Separation
Electrophoresis Theory “Ok here’s my recipe idea called the electric pickle. Attach the hot lead to a screw and shove it in. The neutral lead goes in the other end. Turn out the lights and plug it in It glows and sizzles. The juicy ones work best” www. voltnet. com/cook P= VI = I 2 R Pickle cooks vep = ep. V Ions move through pickle faster at high voltage ep = q/6 r Small ions with high charge move fastest
DNA and Electrophoresis “From a practical point of view it is disappointing that electrophoresis cannot be used to fractionate or analyze DNA on the basis of size” Olivera, Biopolymers 1964, 2, 245 ep = q/6 r A T PO- G PO- small ions with high charge move fastest C PO- As size increases so does charge!
Separation Mechanism Electrophoretic flow DNA-- Electroosmotic flow is a bulk flow that is created by the build up of charge on a capillary wall. POP polymer minimizes this effect Si. OH Si. O- + H+
Issues with CE separations • Effect – electroosmotic flow Polyethylene oxide separation of p. BR 322 HAE III digest (EOF present) PDMA (POP) separation of DNA (EOF not present)
In the early 1990 s the real question was how to transition from a gel to a capillary • Cross-linked acrylamide gel filled capillaries were tried first – Reusable? – Bubble formation – Themal degradation • Alternative was to not use a gel at all – Refillable sieving polymers – However, resolution initially was poor with these polymers
So what are sieving buffers? They are gels - very similar to polyacrylamide They are not gels they flow Actually these are known as entangled linear polymers and there are many common applications
Entangled Polymer Solutions • Polymers are not cross-linked (above entanglement threshold) • “Gel” is not attached to the capillary wall • Pumpable -- can be replaced after each run • Polymer length and concentration determine the separation characteristics • Examples: – 1% HEC (hydroxyethyl cellulose) – 4% polyvinyl pyrolidinone – POP-4 and POP-6 POP 4 Polymer Polydimethyl acrylamide
Transient Pores Are Formed Above the Entanglement Threshold. C < C* C = C* C > C*
Rg V Ogston Sieving ~ 0 e-NC Reptation ~1/N Entanglement ~ f(1/CN)
Mesh size (concentration) and molecular weight (chain length) will affect resolution viscosity limits applicable chain length
The electric field strength can influence the shape of the DNA molecule. low moderate high Follow the dancing DNA
Resolution vs Field Strength 500 V/cm 4. 5 min 333 V/cm 1% HEC 100 bp Ladder 266 V/cm 100 V/cm 30 min
Resolution vs Field Strength 500 V/cm 4. 5 min 333 V/cm 1% HEC 100 bp Ladder 266 V/cm 100 V/cm 30 min
The Keys 1. Polymer strand interactions create pores 2. Average pore size~ average DNA volume 3. Viscosity should be minimized 4. Field strength optimized
How to Improve Resolution? 1. Lower Field Strength 2. Increase Polymer Concentration 3. Increase Polymer Length 4. Use a longer capillary All of these come at a cost of longer separation run times
How Are Separations Performed in a 310? We use POP-4 (4% poly-dimethylacrylamide, 8 M urea, 5% pyrrolidinone) US Patent 5, 552, 028 covers POP-4 synthesis Running buffer contains 100 m. M TAPS and 1 m. M EDTA (adjusted to p. H 8. 0 with Na. OH) PDMA structure
Synthesis Procedure for PDMA (Molecular Wt = 1 Million amu) • Distill dimethyl acrylamide to remove stabilizers • Add 16. 3 ml of methanol to 46. 3 ml d. H 2 O • Added 6. 3 g of dimethyl acrylamide to mixture • N 2 bubbled through for 1 h (covered flask to prevent excess methanol evaporation) • Add 0. 3 ml of ammonium persulfate stock solution (made by dissolving 0. 2 g of APS in 1. 8 ml of d. H 2 O) to the methanol/ H 2 O mixture • Remove solvents and dry to powder Madabhushi, R. S. DNA Sequencing in Noncovalently Coated Capillaries Using Low Viscosity Polymer Solutions. In Methods in Molecular Biology, 2001, Vol. 163.
Synthesis Results Effect of Concentration and Molecular Weight on resolution 4% PDMA (100 K), Taps buffer 7. 3% PDMA (1 M), Taps buffer
Commercial POP-4 • 4% poly(dimethylacrylamide) (PDMA), • 100 m. M TAPS (p. H 8. 0), 8 M urea, 5% 2 -pyrrolidinone
Separation Issues • Capillary wall coating -- dynamic coating with polymer – Wall charges are masked by methyl acrylamide • Electrophoresis buffer – – – Urea for denaturing and viscosity Buffer for consistent p. H Pyrolidinone for denaturing DNA EDTA for stability and chelating metals • Polymer solution – – Entangled to separate DNA – High molecular weight for good resolution – Mimimum concentration/viscosity for easy refilling (POP 4, POP 6 • Run temperature -- 60 o. C helps reduce secondary structure on DNA and improves precision. (Temperature control affects DNA sizing)
Injection
Injection Methods for CE capillary + 5 k. V 0. 5 psi ABI 310 DNADNADNA- Hydrodynamic sample vial DNADNADNA- Electrokinetic Ulfelder K. J. ; Mc. Cord, B. R. (1996) Capillary Electrophoresis of DNA, In Handbook of Capillary Electrophoresis (Landers, J. , ed. ), CRC Press: NY, pp. 347378. Butler, J. M. (1997) Effects of sample matrix and injection on DNA separations. Analysis of Nucleic Acids by Capillary Electrophoresis (Heller, C. , ed. ), Vieweg: Germany, Chapter 5, pp. 125 -134
How is injection accomplished on a 310 Electrode Capillary tip and electrode are rinsed several times in water and then dipped into sample. A voltage is then applied Samples
Stacking Effects (a) Stacking with Low Ionic Strength DNA - DNA DNA - High Field High Ionic Strength Buffer + Low Field (b) Regular EK Injection High Ionic Strength DNA - Low Field High Ionic Strength Buffer Low Field +
Ion Mobility Effects The Injection of DNA by voltage is described by [DNAinj] = E( r 2)[DNAsam]( ep+ eof) However this equation assumes no interfering ions are present. Cl- ions and other interferents will compete with DNA {DNAinj} = [DNAinj]/[other ionsinj] Ions such as Cl- have a higher charge/mass ratio and ep is greater
Effect of Formamide Conductance on DNA Concentration 208 u. S 338 u. S 408 u. S 1180 u. S
Two Major Effects of Sample Stacking 1. Sample is preconcentrated. Effect is inversely proportional to ionic strength 2. Sample is focused. Ions stop moving in low electric field 3. Mobility of sample = ep = velocity/ electric field Buffer low E high ionic strength -DNA DNA DNA high E DNA - - Cl - low ionic strength
Typical Sample Preparation for ss. DNA ? 1. Perform PCR with dye-labeled primers 2. Dilute 1 µL PCR product with 24 µL deionized formamide; add 1 µL ROX-labeled internal sizing standard 3. Denature 2 minutes at 95 o. C with thermocycler 4. Cool to 4 o. C in thermocycler or ice bath 5. Sample will remain denatured for at least 3 days
Comments on Sample Preparation • Use high quality formamide (<100 S/cm)! – ABI sells Hi-Di formamide – regular formamide can be made more pure with ion exchange resin (or less! You better measure it, aliquot it out, and freeze it!) • Deionized water vs. formamide – Biega and Duceman (1999) J. Forensic Sci. 44: 1029 -1031 – Crivellente, Journal of Capillary Electrophoresis 2002, 7 (3 -4), 73 -80. – water works fine but samples are not stable as long as with formamide; water also evaporates over time… • Denaturation with heating and snap cooling – use a thermal cycler for heating and cold aluminum block for snap cooling – heat/cool denaturation step is necessary only if water is substituted formamide. . .
Injection Study Evaluate of the effects of sample injection on electrophoretic separations by CE. • • different solvents (water and formamide of varying purity); different concentration of the sample; addition of salts; sample stacking Electrokinetic injection has some unusual properties!
Effect of Formamide on Peak Resolution and Sensitivity (Rox Internal Standard) Solvent Resolution Water 1. 19+/1 0. 01 Peak Height 2700+/- 300 Formamide (27 S) 1. 15+/- 0. 05 2960+/- 30 Formamide (360 S) 1. 20+/- 0. 08 879 +/- Formamide 1000 S) 1. 20+/- 0. 06 290 +/- 14 4
Effect of increasing relative sample volume Sensitivity improves only in poor quality formamide! Sample / Formamide As [DNA] increases so does ionic strength, making injection almost independent of u. L DNA injected
Effect of Increasing salt concentration (Reannealed ds DNA moves faster) blank + Mg. Cl 2 1 m. M + Mg. Cl 2 4 m. M + Mg. Cl 2 8 m. M + Mg. Cl 2 12 m. M + Mg. Cl 2 16 m. M
Detection
OPTICS Laser (488 nm) I Charged coupled device capillary Grating
Capillary Electrophoresis Instrumentation ABI 310 single capillary ABI 3100 16 capillary array
CCD Image of 16 -Capillary Array
Detection Issues • Fluorescent dyes – spectral emission overlap – relative levels on primers used to label PCR products – dye “blobs” (free dye) • Virtual filters (determine which pixels are used – hardware (CCD camera) – software (color matrix)
Laser Used in ABI 310 • • • Argon Ion Laser 488 nm and 514. 5 nm for excitation of dyes 10 m. W power Lifetime ~5, 000 hours (1 year of full-time use) Cost to replace ~$5, 500 Leads to highest degree of variability between instruments and is most replaced part • Color separation matrix is specific to laser used on the instrument • Laser is on unless instrument is off!
Methods for Fluorescently Labeling DNA • Intercalating Dyes (post-PCR) • Dye-labeled nucleotide insertion during PCR • Dye-labeled primer insertion during PCR 3’TGCATCTACGATGTAATCG 5’ CGTAGCTG 3’ ENZYME Linkers, dyes, etc. can be added to the 5’ end of the primer without disturbing the reaction. Individual bases can also be tagged Intercalation process Covalent labeling process
Amine Reactive Dyes used in Labeling DNA FAM (Blue) JOE (Green) Emission 548 Emission 520 TAMRA (Yellow) Emission 580 linker DNA Base ROX (Red) Emission 605 linker Dye DNA Base Dye The succinimidyl ester reacts rapidly with amine linkers on DNA bases
Fluorescent Emission Spectra for ABI Dyes 5 -FAM JOE NED ROX NED is a brighter dye than TAMRA Normalized Fluorescent Intensity 100 80 60 40 20 0 520 540 Laser excitation (488, 514. 5 nm) 560 580 600 620 640 WAVELENGTH (nm) ABI 310 Filter Set F Butler, J. M. (2001) Forensic DNA Typing, Figure 10. 4, ©Academic Press
Virtual Filters Used in ABI 310 Visible spectrum range seen in CCD camera 500 525 550 575 600 625 650 675 700 nm Commonly used HEX PET ROX LIZ fluorescent dyes FL TET JOE NED TMR FAM VIC Arrows indicate the dye emission spectrum maximum Filter A Filter C Filter F Filter G 5 Filter sets determine what regions of the CCD camera are activated and therefore what portion of the visible light spectrum is collected
Please Note! • There are no filters in a 310 • Its just the choice of pixels in the CCD detector • All the light from the grating is collected • You just turn some pixels on and some off
Raw Data from the ABI Prism 310 (prior to separation of fluorescent dye colors)
Why Make a Matrix? The matrix is the solution to a problem: What’s the contribution at any given wavelength (filter set) from each dye ? There are 4 dyes • Remember algebra from high school? • To solve a problem with 4 unknowns, you need 4 equations
Matrix Standards (Raw Data) Filter Set C Set F 6 FAM (5 FAM) TET (JOE) HEX (NED) ROX (ROX)
For Example I 540= bxb + gyb + yzb + rwb I 560= bxg + gyg + yzg + rwg I 580= bxy + gyy + yzy + rwy I 610= bxr + gyr + yzr + ywr intensity of blue intensity of green intensity of yellow intensity of red Where b is the %blue labeled DNA g is the %green labeled DNA, etc. x, y, z, w are the numbers in the matrix (sensitivity to each color) If you solve xyzw for each dye individually Then you can determine dye contribution for any mixture
Matrix Standards (After Color Separation)
DNA Size Estimation with ABI 310 Once you can label DNA you must next determine its size 1. Each sample is run with a ROX internal standard 2. An external standard is run with ROX as well 3. The unknown allele sequence is determined by comparison to the known ladder allele 4. Assumptions?
Estimating size The red internal lane standard establishes the allele size. This size is compared to an allelic ladder run earlier.
Assumptions with ABI 310 Method affecting precision 1. DNA is a sphere. (it is not) 2. The conditions for unknown run are the same as the ladder run. (they are not) 3. The ROX dye migrates relatively the same as the FAM dye. (It does not) 4. A calibration for one ladder is good for an entire run (sometimes) 5. Temperature is constant (to what degree? )
There is a size range for calling an allele These bins define the precision of the system They are commonly defined as +/- 0. 5 bp However they can also be defined by the precision of an allele call (+/- 3 standard deviations)
What affects precision? Lots of things: – – – – Temperature Sequence of Rox standard vs sample Sequence of allele vs ladder Conformation of DNA Polymer matrix Capillary condition Buffer concentration p. H – Showing that you can control these factors is the goal of laboratory validation – That will be discussed in future sections.
Conclusions DNA typing by capillary electrophoresis involves: 1) The use of entangled polymer buffers 2) Injection by sample stacking 3) Multichannel laser induced fluorescence 4) Internal and external calibration
Mc. Cord Research Group Ohio Miami
Acknowledgements Funding: National Institute of Justice National Science Foundation People: • • • Ohio University Tim Nock Jim Dove Sharon Williams Dr. Federica Crivellente Kylie Muncy Dr. Brittany Hartzel Dr. Yin Shen Dr. Nancy Tatarek Dr. Denise Chung • • Elsewhere Dr. Alice Isenberg FBI Dr. John Butler NIST Dr. Ralph Allen UVA Dr. David Mao J&W Scientific Dr. John Petersen UT-Galveston Dr. Lee Meadows Jantz • Florida International University • • Kerry Opel Rayna Hebard Sarah Hughes Dr. Dee Mills Points of view expressed in this presentation are those of the authors and do not necessarily represent the official view of the US department of Justice