Advanced Statistics Factor Analysis I Introduction Factor analysis

observed variables (Xi)")


; pioneer of FA in")


- Slides: 22
Advanced Statistics Factor Analysis, I
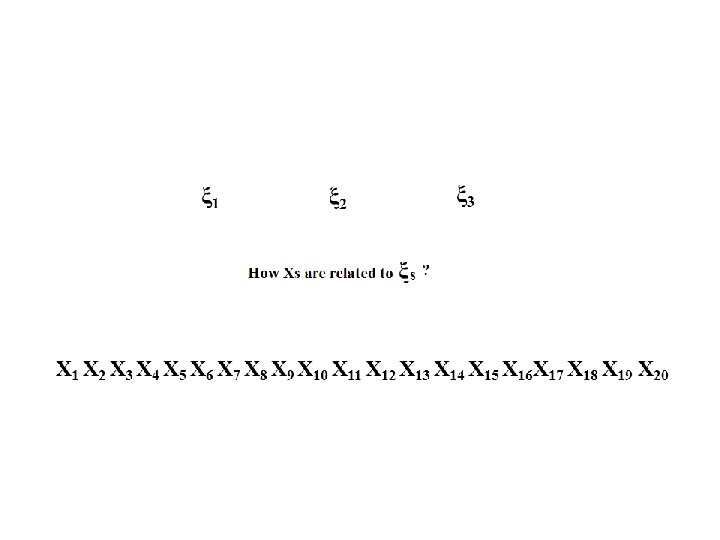
Introduction Factor analysis is a statistical technique about the relation between: (a)observed variables (Xi) (i = 1…. m) and (b)factors (ξj) (j = 1…k) [ξ pronounced ksi] - It is assumed that the no. of ξs is smaller than no. of Xs; - Xs are called indicators, measurements, data; - ξs are called constructs, unobserved variables, latent variables Factor analysis is a statistical method used to describe variability among observed variables in terms of a potentially lower number of factors. It is assumed that variations in a number of observed variables reflect the variations in fewer, unobserved variables (factors).
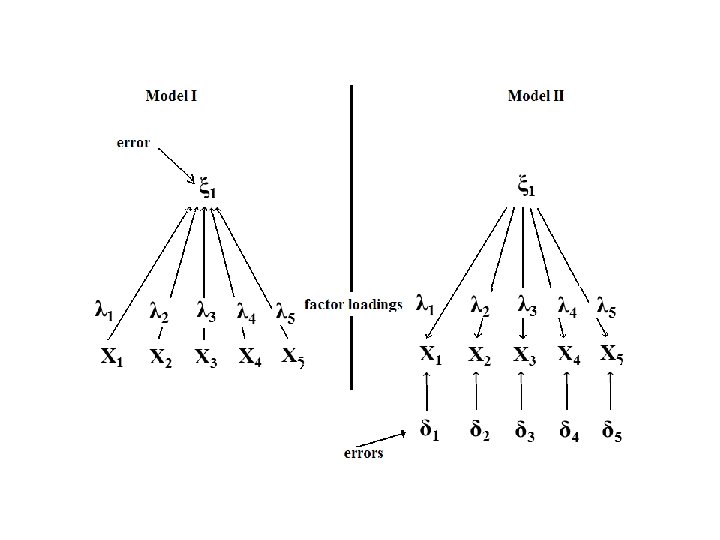
Basic questions Theory of measurement: 1. What causes what, ξ → Xs, Xs→ ξ ? 2. Do we explore the relation of Xs to ξs, or do we test (try to confirm) our a priori assumption about this relation? _________________________ Numerical strength of the relationship between ξ and Xs is expressed by coefficients λ (lambda). Error terms are denoted by δ (delta).
Models I and II Model I: ξ 1 = λ 1*X 1 + λ 2*X 2 + λ 3*X 3 + λ 4*X 4 + λ 5*X 5 + error Model II: X 1 = λ 1* ξ 1 + δ 1 X 2 = λ 2* ξ 1 + δ 2 X 3 = λ 3* ξ 1 + δ 3 X 4 = λ 4* ξ 1 + δ 4 X 5 = λ 5* ξ 1 + δ 5
PCA vs. FA • Model I corresponds to Principal Component Analysis, PCA • Model II corresponds to Factor Analysis, FA Answering the first question, What causes what, ξ → Xs, Xs→ ξ, leads to this basic distinction between PCA and FA The second question, Do we explore the relation of Xs to ξs, or do we test this relationship, deals with an important division within FA.
Exploratory factor analysis, EFA We do not assume the relationship between Xs and ξs. In particular we do not assume how many factors should be extracted and what would be their meaning. E. g. :
Confirmatory factor analysis, CFA .
Principal component analysis, PCA seeks a linear combination of variables such that the maximum variance is extracted from the variables. If there are more than one factor, PCA then removes this variance and seeks a second linear combination which explains the maximum proportion of the remaining variance, and so on. It results in orthogonal (uncorrelated) factors.
Exploratory factor analysis, EFA • EFA is used to uncover the underlying structure of a relatively large set of variables. The researcher's a priori assumption is that any indicator may be associated with any factor. This is the most common form of factor analysis.
Confirmatory factor analysis, CFA • CFA seeks to determine if the number of factors & the loadings of measured (indicator) variables on them conform to what is expected on the basis of pre-established theory. This is a testing-hypothesis approach. • Observed variables are selected on the basis of prior theory; factor analysis is used to see if they load as predicted on the expected number of factors. • The researcher's a priori assumption is that each factor (with specified meaning) is associated with a given subset of indicators. In short: A minimum requirement of confirmatory factor analysis is that one hypothesizes beforehand the number of factors in the model, and posit expectations about which variables will load on which factors.
History of FA 1. Charles Edward Spearman (1863 - 1945); pioneer of FA in connection with studying human intelligence. His theory that disparate cognitive test scores reflect a single general factor (g factor) led to developing factor analysis. The basic idea: test scores reflect g & the rest. Two factor model. 2. Raymond Bernard Cattell (1905 – 1998) continued the work on two-factor model of IQ. The distinction of fluid and crystallized intelligence: abstract, adaptive intellectual abilities versus applied or crystallized knowledge. However, his improvement of FA comes from studying personality.
T-F: Kinds of Research Questions, 1 1. Number of factors Goal: to reduce a large number of variables Xs to smaller number of factors ξs. - minimal number of variables for a meaningful factor: for PC 3, for FA 4 Examples of one factor solutions: (a) PC – social status measured by years of schooling, job complexity, and earnings; (b) FA – attitude toward free market economy measured by opinions that the government should not intervene (a) in flow of capital, (b and c) in labor market in terms of jobs and in terms of earnings, and (d) in prices of goods.
T-F: Kinds of Research Questions, 2 2. Nature of factors Factors are interpreted by the variables that correlate with them. Theoretical argument for naming factors.
T-F: Kinds of Research Questions, 3 3. Importance of Solutions and Factors Assessing the importance of solutions in terms of how much variance in a data set is accounted for by the factors.
T-F: Kinds of Research Questions, 4 4. Testing Theory in Factor Analysis In scientific work, even the simplest exploratory analysis should be guided by some theoretical consideration
T-F: Kinds of Research Questions, 5 5. Estimating Scores on Factors The ultimate goal of factor analysis is to create new variable(s), factor(s) ξs. It means that each unit of observation receives some value on this new variable. Is this distribution reasonable?
Terminology • Factor loadings: also called component loadings in PCA, are correlations between the variables (rows) and factors (columns). • The squared factor loading = the percent of variance in that indicator variable explained by the factor. To get the percent of variance in all the variables accounted for by each factor, we have to add the sum of the squared factor loadings for that factor (column) and divide by the number of variables. (Note the number of variables equals the sum of their variances as the variance of a standardized variable is 1. ) This is the same as dividing the factor's eigenvalue by the number of variables.
Interpreting factor loadings Rule of thumb in confirmatory factor analysis: loadings should be. 7 or higher to confirm that independent variables identified a priori are represented by a particular factor. Rationale: the. 7 level corresponds to about half of the variance in the indicator being explained by the factor. - the. 7 standard is high; real-life data may well not meet this criterion, which is why some researchers, particularly for exploratory purposes, will use a lower level such as. 4 for the central factor, and. 25 for other factors; - call loadings above. 6 "high" and those below. 4 "low". In any event, factor loadings must be interpreted in the light of theory, not by arbitrary cutoff levels.
Terminology • Communality: The sum of the squared factor loadings for all factors for a given variable (row) is the variance in that variable accounted for by all the factors; this is called the communality. The communality measures the percent of variance in a given variable explained by all the factors jointly; it may be interpreted as the reliability of the indicator. • Uniqueness of a variable: is the variability of a variable minus its communality. • Factor scores (also called component scores in PCA): are the scores of each case (row) on each factor (column). To compute the factor score for a given case for a given factor, one takes the case's standardized score on each variable, multiplies by the corresponding factor loading of the variable for the given factor, and sums these products. • Computing factor scores allows one to look for factor outliers. Also, factor scores may be used as variables in subsequent modeling.
Terminology • Eigenvalues: /Characteristic roots: The eigenvalue for a given factor measures the variance in all the variables, which is accounted for by that factor. The ratio of eigenvalues = the ratio of explanatory importance of the factors with respect to the variables. If a factor has a low eigenvalue, then it is contributing little to the explanation of variances in the variables and may be ignored as redundant with more important factors. Eigenvalues measure the amount of variation in the total sample accounted for by each factor. • Extraction sums of squared loadings: Initial eigenvalues and eigenvalues after extraction (listed by SPSS as "Extraction Sums of Squared Loadings") are the same for PCA extraction, but for other extraction methods, eigenvalues after extraction will be lower than their initial counterparts. SPSS also prints "Rotation Sums of Squared Loadings" and even for PCA, these eigenvalues will differ from initial and extraction eigenvalues, though their total will be the same.