Advanced Statistical Modeling In Real Estate Appraisal John


 Changes and")
 Changes and")


: – Normally distributed –")
: – Normally distributed –")


 = Intercept + Coefficients X Ln(factors)")


 =")
 =")


")


 Given what we know about this data,")
 Consistency: The MLE converges asymptotically to the")
 What do we mean by “asymptotic”? As")
 Asymptotic normality: As sample size increases, the")
 Asymptotic normality: As sample size increases, the")
 Efficiency: There is no asymptotically unbiased estimator")
 So why don’t we use MLE more")
 So why don’t we use MLE more")


 the method(s) center upon a testable")
 the method(s) center upon a testable")


 -- also Spearman’s ρ Kolmogorov-Smirnov (for normality) Mann-Whitney")


 “In developing a real property appraisal, an appraiser")
(b)(c) (viii) “(Describe) (Summarize) (State) the information analyzed, the appraisal")


 comment: “Mass appraisers must develop mathematical models that, with")
 comment: “Models must be calibrated using recognized techniques, including,")
 Changes and developments in economics, finance, law,")
 The reviewer must have the knowledge and")


- Slides: 174
Advanced Statistical Modeling In Real Estate Appraisal John A. Kilpatrick, Ph. D. , MAI August 2, 2012 www. greenfieldadvisors. com Suite 240 – 2101 4 th Ave Seattle, WA, USA 98121 +01 -206 -623 -2935 Suite 100 - 1870 The Exchange Atlanta, GA , USA 30339 +01 -770 -951 -7028
Advanced Statistical Methods
Advanced Statistical Methods Hedonic Modeling
Advanced Statistical Methods Hedonic Modeling Survey Research
Advanced Statistical Methods Hedonic Modeling Survey Research Meta Analysis
Advanced Statistical Methods Hedonic Modeling Survey Research Meta Analysis Expert Systems
Goals for this course:
Goals for this course: Basic familiarity with the fundamentals
Goals for this course: Basic familiarity with the fundamentals How does this comport with USPAP and CPE?
Goals for this course: Basic familiarity with the fundamentals How does this comport with USPAP and CPE? How does this fit in the appraisal body of knowledge?
Goals for this course: Basic familiarity with the fundamentals How does this comport with USPAP and CPE? How does this fit in the appraisal body of knowledge? When will you find this useful?
What this class is NOT -NOT focused on litigation NOT introducing new topics -- everything in this course is well established in the valuation literature NOT trying to teach the A. I’s Quant Analysis Course NOT trying to debate USPAP or CPE -- these methods are all well established in USPAP and in the Code of Professional Conduct
The Hedonic Regression Model Sometimes called a “hedonic pricing model” - Uses comparable prices in the same way as a sales adjustment grid - Called “hedonic” because it measure the marginal prices of individual components that people enjoy
USPAP? – more at the end Comment to Standards Rule 3 -1(a) Changes and developments in economics, finance, law, and society can have a substantial impact on the appraisal profession. To keep abreast of these changes and developments, the appraisal profession is constantly reviewing and revising appraisal methods and techniques and devising new methods and techniques to meet new circumstances. Each appraiser must continuously improve his or her skills to remain proficient in appraisal review.
USPAP? – more at the end Comment to Standards Rule 3 -1(a) Changes and developments in economics, finance, law, and society can have a substantial impact on the appraisal profession. To keep abreast of these changes and developments, the appraisal profession is constantly reviewing and revising appraisal methods and techniques and devising new methods and techniques to meet new circumstances. Each appraiser must continuously improve his or her skills to remain proficient in appraisal review.
The Hedonic Regression Model Advantages: – Statistically grounded – Easy to test which variables are statistically and economically meaningful – “Matched Pairs” to achieve marginal prices are embedded in the process – Easy to test accuracy
The Hedonic Regression Model Disadvantages: – Requires a large set of comparable data – Mathematically more difficult – Less appraiser judgment – (is this an advantage or disadvantage? ) – Can be difficult to explain
The Hedonic Regression Model What do we mean by “marginal prices” – Economic term – The regression equivalent of the output of a matched pair – In a linear regression, it’s the coefficient
The Hedonic Regression Model What do we mean by “marginal prices” Example: Land value = $10, 000 per acre V = 10000 X Thus, the marginal price of an acre of land is $10, 000
The Hedonic Regression Model What do we mean by “marginal prices” Example: House Value = $150/SF + $1, 000 for every bathroom > 2 -- $1, 000 for every bathroom < 2 + $2, 000 if it has a garage + $2, 000 if it has a fireplace
The Hedonic Regression Model What do we mean by “marginal prices” Example: V = Intercept + 150 X + 1000 (B-2) + 2000 G + 2000 F What is the marginal price of a fireplace?
The Hedonic Regression Model Consider this equation again: V = Intercept + 150 X + 1000 (B-2) + 2000 G + 2000 F
The Hedonic Regression Model Consider this equation again: V = Intercept + 150 X + 1000 (B-2) + 2000 G + 2000 F What’s missing?
The Hedonic Regression Model Consider this equation again: V = Intercept + 150 X + 1000 (B-2) + 2000 G + 2000 F What’s missing? Unexplained Variance
The Hedonic Regression Model Consider this equation again: V = Intercept + 150 X + 1000 (B-2) + 2000 G + 2000 F + The Greek Letter Epsilon ε
The Hedonic Regression Model Some rules about epsilon (unexplained variance): – Normally distributed – Mean of zero (indicates unbiasedness) – Standard deviation of 1 (consistency)
The Hedonic Regression Model Some rules about epsilon (unexplained variance): – Normally distributed – Mean of zero (indicates unbiasedness) – Standard deviation of 1 (consistency) We’ll return to these rules again in a minute: – Problems – Solutions
The Hedonic Regression Model Consider this equation again: V = Intercept + 150 X + 1000 (B-2) + 2000 G + 2000 F + Intercept? ε
The Hedonic Regression Model The Regression Intercept – A constant – The value of the equation if all other factors were set to zero
The Hedonic Regression Model The Regression Intercept – A constant – The value of the equation if all other factors were set to zero – In a hedonic pricing model, can be thought of as the value of a lot in the subject neighborhood
The Hedonic Regression Model The Regression Intercept – A constant – The value of the equation if all other factors were set to zero – In a hedonic pricing model, can be thought of as the value of a lot in the subject neighborhood – (not exactly statistically accurate)
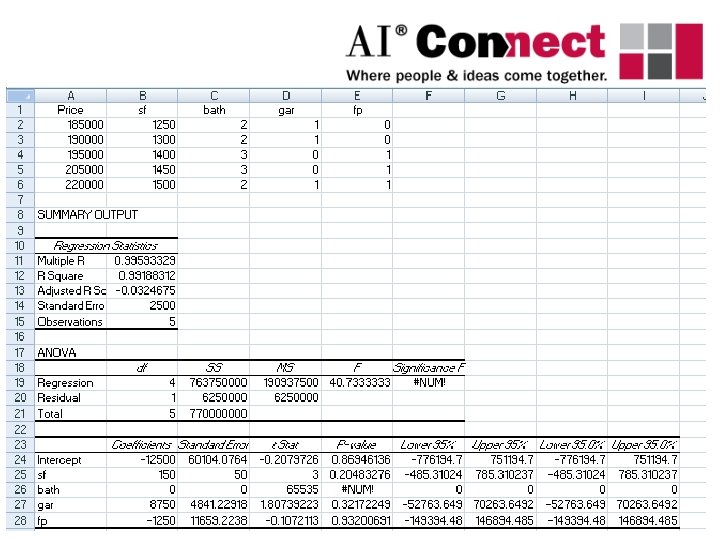
The Hedonic Regression Model Assume the following appraisal problem: Comp # Price SF # of baths Garage? Fireplace? 1 $185, 000 1250 2 Yes No 2 $190, 000 1300 2 Yes No 3 $195000 1400 3 No Yes 4 $205, 000 1450 3 No Yes 5 $220, 000 1500 2 Yes Subject ? 1400 2 Yes No
The Hedonic Regression Model Consider this equation again: V = -12, 500 + 150 X + 0 B + 8750 G - 1250 F V = -12, 500 + 150(1400) + 0(2) + 8750(1) – 1250(1) V = $205, 000
The Hedonic Regression Model Consider this equation again: much V = -12, 500 + 150 X + 0 B + 8750 GHow - 1250 F V= confidence do we have in this–answer? -12, 500 + 150(1400) + 0(2) + 8750(1) 1250(1) V = $205, 000
Notice the difference between R 2 and adjusted R 2
Notice the meaningless t- and p-statistics
Notice the meaningless F-statistic
Even though we get “unbiased” answers, the results are meaningless and lack validity, largely as the result of a small data set
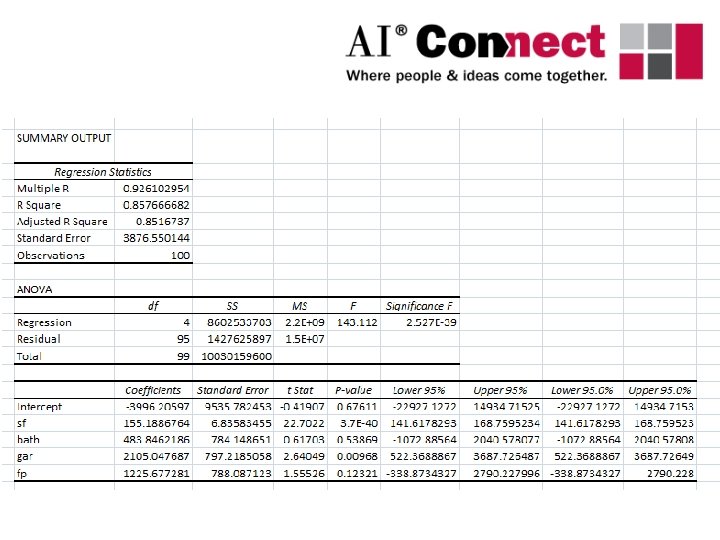
This data set goes on for 100 comp sales
Note the negative sign for the intercept – we’ll deal with that in a minute!
Note the more meaningful range of adjusted R 2
F-test shows that the regression is valid
Not all t-stats and p-values are in line, but the results are meaningful and have expected signs
We can “bootstrap” the process by eliminating the variables that don’t have meaningful results
Now, adjusted R 2 is improved and the intercept has the expected sign
The Hedonic Regression Model Now, what does our equation look like? V = 2846 + 148(SF) + 2132(G) V = 2846 + 148(1400) + 2132(1) = $212, 178 (earlier answer was $205, 000)
The Hedonic Regression Model One more improvement: Ln(V) = Intercept + Coefficients X Ln(factors) Why?
The Hedonic Regression Model Using logarithms is called a log- or semi-log transformation. Sometimes called a Box-Cox transformation Remember that error terms are supposed to be ~N(0, 1)? Real estate prices are always > 0, so this rule may be violated Log transformation corrects for this
The Hedonic Regression Model 2000 0 -20001200 1250 1300 1350 1400 1450 1500 1550 -4000 -6000 -8000 -10000 -12000 -14000 -16000 sf sf Residual Plot With Transform Residuals sf Residual Plot Without Transform 0. 02 0. 01 0 -0. 017. 081 -0. 02 -0. 03 -0. 04 -0. 05 -0. 06 -0. 07 -0. 08 7. 131 Without transform, residuals are biased 7. 181 7. 231 sf 7. 281 7. 331
The Hedonic Regression Model 2000 0 -20001200 1250 1300 1350 1400 1450 1500 1550 -4000 -6000 -8000 -10000 -12000 -14000 -16000 sf sf Residual Plot With Transform Residuals sf Residual Plot Without Transform 0. 02 0. 01 0 -0. 017. 081 -0. 02 -0. 03 -0. 04 -0. 05 -0. 06 -0. 07 -0. 08 7. 131 With transform, residuals are unbiased 7. 181 7. 231 sf 7. 281 7. 331
The Hedonic Regression Model Transformed solution V = Exp(Intercept + Coefficients X Factors) = $210, 686 (earlier answer was $212, 178)
The Hedonic Regression Model Transformed solution V = Exp(Intercept + Coefficients X Factors) = $210, 686 This is the anti-log function
The Hedonic Regression Model Appraisal Standards? Generally thought of under USPAP 6 (Mass appraisal, AVMs) Hedonic modeling is fully consistent with USPAP 1 When conducting a mass appraisal, IAAO supplemental standards provide good guidance Integrated with GIS, etc. Need to cite either/or USPAP 1 and 6
The Hedonic Regression Model Colwell, et. al, TAJ 2009 Cites Rubinfeld, Reference Manual on Scientific Evidence Cites In Re: Guardian Pipeline (Judge Frank Easterbrook) Testifying expert should have training in both appraisal and statistical methods
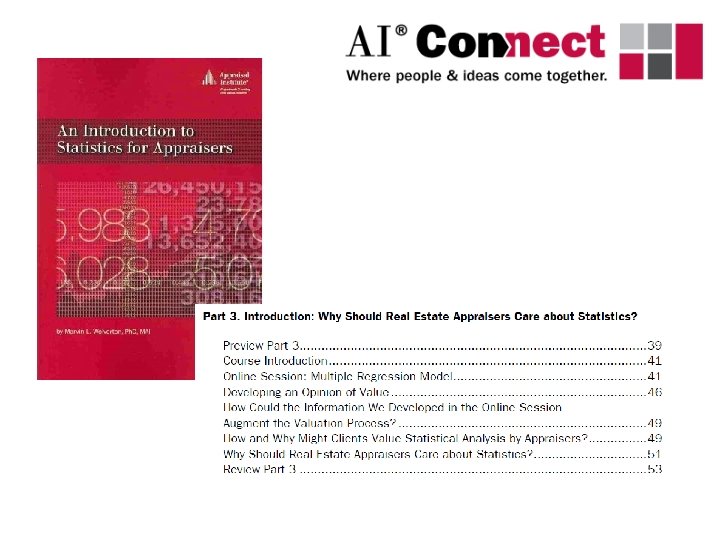
Hedonic Regression: “must read” Colwell, et. al, TAJ 2009 Rubinfeld, “Regression”, in Reference Manual on Scientific Evidence, (U. S. DOJ, 2010) Kauko & d’Amato, Mass Appraisal Methods (RICS, 2008) Gloudemans, Mass Appraisal of Real Property (IAAO, 1999) Wolverton, An Introduction to Statistics for Appraisers (A. I. , 2009)
Survey Research Informal surveys – Market Research – Rent/Cap Rate Surveys, etc. Formal surveys – Contingent Valuation – Conjoint Measurement – Perceived Diminution
Survey Research Informal surveys – Market Research – Rent/Cap Rate Surveys, etc. Formal surveys – Contingent Valuation – Conjoint Measurement – Perceived Diminution
Survey Research Common Uses: When transactional data is insufficient or unreliable – Lack of transactions – Transactions don’t meet definition of value – Market is at disequilibrium
Survey Research Common Uses: When transactional data is insufficient or unreliable – Lack of transactions – Transactions don’t meet definition of value – Market is at disequilibrium To supplement or support transactional data
Survey Research Two recent examples:
Survey Research Two recent examples: Allison v. Exxon – survey research told a compelling story to the jury when transactional data was muddled in a drinking water contamination case
Survey Research Two recent examples: Allison v. Exxon – survey research told a compelling story to the jury when transactional data was muddled in a drinking water contamination case Rogers v. U. S. – explained and supported a transactions-based adjustment in a rails-to-trails taking
Survey Research “stated preference” versus “revealed preference”
Survey Research “stated preference” versus “revealed preference” Transactional-based models (e. g. – sales comparison approach): the market participants reveal their preferences via the choices they make
Survey Research “stated preference” versus “revealed preference” Transactional-based models (e. g. – sales comparison approach): the market participants reveal their preferences via the choices they make Survey research: market participants state their preferences directly
Survey Research “stated preference” versus “revealed preference” Note that both are market perspectives, and rely on market data.
Facts of the situation
Facts of the situation Market Survey Responses
Facts of the situation Market Survey Responses Results: (value, adjustm’t, etc. )
Facts of the situation Market Survey Responses Often referred to as a fact card, but may be photographs, a video, or other presentation. Results: (value, adjustm’t, etc. )
Facts of the situation In Rogers v. U. S. , the “fact card” was actually a set of videos, much Results: Market like a typical Realtor. TM sales video. (value, Survey Alternate presentations of the adjustm’t, Responses video showed the yard with etc. )a trail and without a trail. Often referred to as a fact card, but may be photographs, a video, or other presentation.
Important issues include large sample size, response rate, and unbiased format of the questions. Facts of Market the Survey situation Responses Follows well-accepted sampling methods, derived from market research and statistics. Results: (value, adjustm’t, etc. )
Important issues include large sample size, response rate, and unbiased format of the Increasing use. Results: of internet questions. Facts of Market surveys allows(value, for very the Survey adjustm’t, situation Responses large samples, albeit with etc. ) but lower response rates, improves selection bias. Follows well-accepted sampling methods, derived from market research and statistics.
Survey Research - Advantages One of the only ways to measure “non-use” values – Environmental impairment – Both Goods (willingness to pay) and Bads (willingness to accept – Private impacts of public goods (airports, rails-totrails, etc. )
Survey Research - Advantages One of the only ways to measure “non-use” values – Environmental impairment – Both Goods (willingness to pay) and Bads (willingness to accept) – Private impacts of public goods (airports, rails-totrails, etc. ) Often referred to as “passive use” values
Survey Research - Advantages Enormously flexible Widely used both in appraisal and other areas – well developed body of knowledge Methodology outlined in the Reference Manual on Scientific Evidence published by the U. S. Justice Department Results easy to analyze and describe – understandable and compelling to a Court
Survey Research - Challenges 1993 NOAA Panel – questions which have been answered Confusing WTP with WTA (Note: WTP has an implicit income constraint) Confusing cross-sectional and longitudinal studies
Survey Research – “Must Read” Diamond, “Survey Research”, in Reference Manual on Scientific Evidence (U. S. DOJ, 2011) Mundy and Mc. Lean, “Addition of CV to the Required Body of Knowledge”, in J. Real Estate Practice and Education (ARES, 1998)
Meta Analysis Question – how do we statistically compile the collected wisdom of scholars in the field?
Meta Analysis Contrasting and combining results from different studies, Identifying patterns among study results Identifying sources of disagreement Identifying other interesting relationships
Meta Analysis One recent use -- to assess diminution in value resulting from environmental disamenities
Meta Analysis Assume we have three published studies about groundwater contamination:
Meta Analysis What if we took a weighted average of these studies?
Meta Analysis In reality, meta analyses look at dozens of studies, and control for such factors as type of contaminant (groundwater, air, etc. ), geographic region, neighborhood type (rural, suburban, etc. ), time factors, and underlying unimpaired property value.
Meta Analysis In reality, meta analyses look at dozens of studies, and control for such factors as type of contaminant (groundwater, air, etc. ), geographic region, neighborhood type (rural, suburban, etc. ), time factors, and underlying unimpaired property value. The exact control variables are less important than arriving at a good explanatory “fit”
25% The “file drawer problem” with meta analyses -- a cautionary tale Benfit from Transit Access Percentage Benefit 20% 15% 10% 5% 0% 0 5 10 Study Number 15 20 25
25% The “file drawer problem” with meta analyses -- a cautionary tale Benfit from Transit Access Percentage Benefit 20% 15% Imagine we’re conducting a meta analysis, and these are the 20 studies we find published 10% 5% 0% 0 5 10 Study Number 15 20 25
25% The “file drawer problem” with meta analyses -- a cautionary tale Benfit from Transit Access Percentage Benefit 20% 15% What if there were actually 30 studies, but 10 didn’t get published? 10% 5% 0% 0 5 10 15 20 Study Number 25 30 35
Percentage Benefit 25% Benfit from Transit Access Fortunately, this is rarely a problem 20% in real estate studies – negative or zero findings are usually just as 15% interesting and publishable as positive ones! 10% The “file drawer problem” with meta analyses -- a cautionary tale What if there were actually 30 studies, but 10 didn’t get published? 5% 0% 0 5 10 15 20 Study Number 25 30 35
Meta Analysis Usefulness? – Contaminated Property Litigation – Housing Characteristics – Real Estate Brokerage Effectiveness – REIT & RE Portfolio Valuation – Appraisal Accuracy – Environmental Amenities – Transportation Infrastructure & Airport Noise – Historic Preservation
Meta Analysis – “must read” Simons & Saginor, J. Real Estate Research, 2006 Lipscomb, Mooney, & Kilpatrick, J. Real Estate Literature, under review Sirmans, Mac. Donald, Macpherson, & Zietz, National Center for R. E. Research, 2005 Debrezion, Pels, & Rietveld, J. Real Estate Finance & Economics, 2007 Nelson, J Transport Economics and Policy, 2007
Expert Systems What happens “in between” the hedonic model and the sales adjustment grid? Is there a way to bring the power of statistical analysis to smaller data sets or “dirty” data? How can we incorporate the appraiser’s “judgment” into statistical processes?
Expert Systems Ties together several streams of research: – – Statistics Appraisal Theory and Practice Set Theory Equilibrium Theory
Expert Systems But first a word about WLS – weighted least squares OLS (ordinary least squares) only works if the error terms (the “residuals”) are normally distributed with a mean of zero and a standard deviation of 1 What if the error terms are badly behaved?
Expert Systems What could cause badly behaved errors? Spatial colinearity Temporal colinearity Non-negative variables (i. e. – truncated prices)
Expert Systems What could cause badly behaved errors? Spatial colinearity Temporal colinearity Non-negative variables (i. e. – truncated prices) These are all common in real estate data
Expert Systems In a pure regression model, we accommodate this with what’s called “weighted least squares” Some uniform weighting is applied Example – using a logarithmic adjustment in hedonic pricing models
Expert Systems Hence, when we apply regression or other statistical modeling to the appraisal process, one challenge is to incorporate appraiser judgment to adjust for “non -normality” in the data. Recall Colwell, et al. TAJ 2009 – both appraisal and statistics training are necessary in modeling
Expert Systems: The Bayesian Estimator
Expert Systems: The Maximum Likelihood Estimator (MLE) Given what we know about this data, what probability model fits best?
Expert Systems: The Maximum Likelihood Estimator (MLE) Consistency: The MLE converges asymptotically to the value being estimated. From an appraisal perspective, this means that there is a benefit to experience and professionally-developed judgment.
Expert Systems: The Maximum Likelihood Estimator (MLE) What do we mean by “asymptotic”? As “N” gets larger and larger, the equation becomes more and more normal. The Central Limit Theorem is an example of an asymptotic distribution
Expert Systems: The Maximum Likelihood Estimator (MLE) Asymptotic normality: As sample size increases, the MLE distribution tends toward a normal distribution.
Expert Systems: The Maximum Likelihood Estimator (MLE) Asymptotic normality: As sample size increases, the MLE distribution tends toward a normal distribution.
Expert Systems: The Maximum Likelihood Estimator (MLE) Efficiency: There is no asymptotically unbiased estimator that has lower asymptotic mean square error.
Expert Systems: The Maximum Likelihood Estimator (MLE) So why don’t we use MLE more often?
Expert Systems: The Maximum Likelihood Estimator (MLE) So why don’t we use MLE more often?
Expert Systems Ties together several streams of research – Appraisal Theory and Practice Shiller and Weiss (1999) – Type II errors Mass Appraisal Daubert & Kumho Tire
Expert Systems
Expert Systems Shiller & Weiss – Type II errors cause appraisal models to underestimate risk
Expert Systems A brief sojourn into Daubert Do(es) the method(s) center upon a testable hypothesis? Is there a known or potentially knowable error rate associated with the method(s)? Has the method been subject to peer review? Is the method generally accepted in the relevant scientific community?
Expert Systems A brief sojourn into Daubert Do(es) the method(s) center upon a testable hypothesis? Is there a known or potentially knowable error rate associated with the method(s)? Has the method been subject to peer review? Is the method generally accepted in the relevant scientific community?
Expert Systems Tie together several streams of research – Set Theory Fuzzy Logic (as distinct from neural networks)
Expert Systems Tie together several streams of research – “…a ‘fuzzy set’…extends the concept of membership in a set to situations in which there are many, possibly a continuum, of grades of membership. ” -- Zadeh (1964)
Expert Systems Tie together several streams of research – “…a ‘fuzzy set’…extends the concept of membership in a set to situations in which there are many, possibly a continuum, of grades of membership. ” From a statistician’s perspective, this sounds a whole lot like the way we determine “comparables” -- Zadeh (1964)
Expert Systems Tie together several streams of research – Equilibrium Theory What is the nature of the real estate market? Nash (1951)
Expert Systems Tie together several streams of research – Equilibrium Theory What is the nature of the real estate market? Nash (1951) Why does this matter?
Expert Systems Tie together several streams of research – Equilibrium Theory What is the nature of the real estate market? Nash (1951) Why does this matter? (hint: modeling heterogeneity)
Expert Systems The real estate transactional market constitutes a Nash equilibrium, in which all participants take into account the strategies of other participants in the goal of optimizing their utility.
Expert Systems The real estate transactional market constitutes a Nash equilibrium, in which all participants take into account the strategies of other participants in the goal of optimizing their utility. Thus, spatial and temporal autocorrelation are part of the process, rather than aberrations to the model.
Expert Systems The appraiser, faced with a set of data and a set of prior observations about the underlying market, uses fuzzy logic to formulates a maximum likelihood estimator to determine the true value of the property.
Expert Systems The appraiser, faced with a set of data and a set of prior observations about the underlying market, uses fuzzy logic to formulates a maximum likelihood estimator to determine the true value of the property. S/he is able to do this with a limited data set based on the Baysian priors already known about the probable behavior of the market.
Expert Systems Adapted from Mc. Clusky & Anaud’s Figure 4
Expert Systems Two Case Studies: • Plaquemines Parish, LA • Lomax, IL
Expert Systems Two Case Studies: • Plaquemines Parish, LA • Lomax, IL
Expert Systems COD: Coefficient of Dispersion From the IAAO Supplemental Standards
Expert Systems COD: Coefficient of Dispersion From the IAAO Supplemental Standards A measurement of the accuracy of the statistic
Expert Systems Parametric Statistics – used when we expect that the underlying data is well distributed (i. e. – normal) Non-Parametric Statistics – used when the data is not expected to be well defined or well distributed
Expert Systems Parametric Statistics – used when we expect that the underlying data is well distributed (i. e. – normal) Example – Mean, Standard Deviation Non-Parametric Statistics – used when the data is not expected to be well defined or well distributed Example – Median, Coefficient of Dispersion
Expert Systems Two Case Studies: • Plaquemines Parish, LA • Lomax, IL
Plaquemines Parish, LA
Shortly after Katrina
Proposed Plaquemines Parish Class Action Area
Proposed Plaquemines Parish Class Action Area Note Sample Area
C. O. D. = 9. 06%
Proposed Lomax, Ill Mass Tort Area
Table 4 Lomax Coefficients of Dispersion Property Type Double-Wide Mobile Home Old Style 1 Old Style 2 Ranch C. O. D 8. 05% 35. 21% 21. 81% 13. 40% 7. 67%
Lessons Learned & Avenues for Future Research The use of MLE’s in an expert system The use of non-parametric models to evaluate statistical properties (“known” error rates) How is this applicable in a single-property appraisal model?
Kendall’s tau (for collinearity & dependence) -- also Spearman’s ρ Kolmogorov-Smirnov (for normality) Mann-Whitney (to test if the differences in median between two populations equals zero) -- also Χ 2 Kruskal-Wallis statistic (variance)
Expert Systems – “must read” Kilpatrick, “Expert Systems and Mass Appraisal”, J. Property Investment and Finance, 2011 Lentz and Wang, J. Real Estate Research, 1998 – tells us that the sales adjustment grid is just a special case of the weighted least squares regression hedonic model.
USPAP? Scope of Work Rule – current wording: “The scope of work is acceptable when it meets or exceeds: • • The expectations of parties who are regularly intended users for similar assignments; and What an appraiser’s peers’ actions would be in performing the same or a similar assignment
USPAP? Scope of Work Rule – Proposed 2014 update: “The scope of work is acceptable when it meets or exceeds: • Both the expectations of parties who are regularly intended users for similar assignments and what an appraiser’s peers’ actions would be in performing the same or a similar assignment; or
USPAP? Scope of Work Rule – Proposed 2014 update: • Recognized methods and techniques prescribed by the Appraisal Practices Board of the Appraisal Foundation, or in other peer-reviewed, published appraisal or valuation books and articles, and published appraisal or valuation coursework taught by a college, university, professional appraisal or valuation organization, or state and federal government agencies. ”
USPAP? Scope of Work Rule – Proposed 2014 update: • Recognized methods and techniques prescribed by the Appraisal Practices Board of the Appraisal Foundation, or in other peer-reviewed, published appraisal or valuation books and articles, and published appraisal or valuation coursework taught by a college, university, professional appraisal or valuation organization, or state and federal government agencies. ”
USPAP? Standards Rule 1 -1 (a) “In developing a real property appraisal, an appraiser must… be aware of, understand, and correctly employ those recognized methods and techniques that are necessary to produce a credible appraisal. ”
USPAP? Standards Rule 2 -2(a)(b)(c) (viii) “(Describe) (Summarize) (State) the information analyzed, the appraisal methods and techniques employed, and the reasoning that supports the analyses, opinions, and conclusions…. ”
USPAP? Advisory Opinion 18 “An AVM’s output is not, by itself, an appraisal, and communication of an AVM’s output is not, in itself, an appraisal report. ”
USPAP? Advisory Opinion 18 “An AVM’s output is not, by itself, an appraisal, and communication of an AVM’s output is not, in itself, an appraisal report. ” Both USPAP 1 and 6 may apply
USPAP? Standards Rule 6 -4(b) comment: “Mass appraisers must develop mathematical models that, with reasonable accuracy, represent the relationship between property value and supply and demand factors, such as presented by quantitative and qualitative property characteristics. ”
USPAP? Standards Rule 6 -4(c) comment: “Models must be calibrated using recognized techniques, including, but not limited to, multiple linear regression, nonlinear regression, and adaptive estimation. ”
USPAP? Comment to Standards Rule 3 -1(a) Changes and developments in economics, finance, law, and society can have a substantial impact on the appraisal profession. To keep abreast of these changes and developments, the appraisal profession is constantly reviewing and revising appraisal methods and techniques and devising new methods and techniques to meet new circumstances. Each appraiser must continuously improve his or her skills to remain proficient in appraisal review.
USPAP? Comment to Standards Rule 3 -1(a) The reviewer must have the knowledge and experience needed to identify and perform the scope of work necessary to produce credible appraisal assignment results. Aspects of competency for an appraisal review, depending on the review assignment’s scope of work, may include, without limitation, familiarly with the specific type of property or asset, market, geographic area, analytical methods, and applicable laws, regulations, and guidelines.
CPE? E. R. 1 -4 It is unethical in the performance of a service to knowingly fail to: (a) Identify the appropriate Standards to be applied (b) Disclose in any report the Standards applied (c) Take all steps necessary or appropriate to understand the Standards applied
CPE? E. R. 1 -4 It is unethical in the performance of a service to knowingly fail to: (a) Identify the appropriate Standards to be applied (b) Disclose in any report the Standards applied (c) Take all steps necessary or appropriate to understand the Standards applied
Dr. John Kilpatrick, MAI, is an appraiser and financial economist and is the CEO of Greenfield Advisors, specializing in economic market and valuation analysis, principally in real estate matters, with offices in Seattle and Atlanta. He also serves as a Visiting Scholar in Real Estate Finance at Baruch College, City University of New York, and is a nationally-certified USPAP instructor. His Ph. D. is in Finance from the University of South Carolina, where he also taught Real Estate and Corporate Finance in the Moore School of Business. He also previously served as the founding Administrator of the South Carolina Supercomputer Network and as the Secretary/Treasurer of the Academic Coalition for Intelligent Manufacturing Systems, based in Washington, DC. Dr. Kilpatrick is the author of four books, contributing author to three others, and has written over one hundred journal articles, book chapters, monographs, and other publications. He is a frequent speaker before national groups, such as the U. S. Senate Subcommittee on Science, Technology, and Space, the National Trust for Historic Preservation, the Asian Real Estate Society, and Institutional Investor magazine’s Integrated Wealth Management Forum. His work in real estate finance has been the subject of recent articles in the New York Times, the Boston Globe, the Wall Street Journal, and the British magazine Modus. He is a contributing author Brownfield Law and Practice as well as the American Bar Association’s Brownfields 3 rd. His recent consulting clients include the U. S. General Services Administration, the Hearst Family, the Japan Real Estate Institute, and numerous private investors, corporations, university endowments, trusts, and law firms. Among his other honors, Dr. Kilpatrick is a Fellow of the Faculty of Valuation of the British Royal Institution of Chartered Surveyors, a Fellow of the American Real Estate Society, and is featured in Who’s Who in America.