ADVANCED SHORT TERM LIQUIDITY ANALYSIS Chapter 9 CHAPTER


 Articulate why converting expenses to related cash-based amounts benefits")


 n FIFO equals LISH or last-in, still-here; the last")
 n Financial statement implications (Exhibit 9 -1) n n")
 n Financial 9 -1) statement implications (Exhibit Alternative inventory-related")
 n LIFO reserves n n n The difference between")
 n LIFO liquidation Occurs when inventory levels are reduced")
 n Manufacturing considerations Inventory turnover measures the number of")
 n Manufacturing considerations (cont. ) Using all three inventory")

 n n Companies do not disclose cash and")
 n Bad Debts The inability to collect certain")
 n Bad Debts (cont. ) n n n")

 n Conceptual considerations for current liability measures n")

 n Analysts should assess financial flexibility with what if scenarios")
 n Sources of financial flexibility n Lines of credit Prearranged")
 n Sources of financial flexibility (cont. ) n Commercial paper")
")
 n Inventory analysis n Decline in inventory component costs")
 n The importance of inventory analysis diminished over time")
 Receivable analysis n Changes in receivables differed among companies")
 None of the companies disclosed their cash and credit")

 n Current liability analysis Became less of a concern")
 n Financial flexibility The industry increased financial flexibility from")
- Slides: 32
ADVANCED SHORT -TERM LIQUIDITY ANALYSIS Chapter 9
CHAPTER 9 OBJECTIVES n Compute and interpret an entity’s liquidity index. n Explain how inventory cost-flow assumptions, LIFO reserves, and LIFO liquidations affect inventory analysis. n Indicate how cash sales and uncollectible accounts influence analysis of accounts receivable.
CHAPTER 9 OBJECTIVES (CONT. ) Articulate why converting expenses to related cash-based amounts benefits analysis of current liabilities. n Discuss the importance of financial flexibility in liquidity analysis. n Describe why some technical adjustments to liquidity measures are sometimes impossible to compute or unnecessary to analysis. n Provide a detailed liquidity analysis of a company or industry. n
CURRENT ASSET LIQUIDITY n The liquidity index quantifies overall asset current liquidity n n Computed as total product days / current assets A current asset’s total product days equals its account balance * the number of days it is removed from cash Prepaid expenses are excluded from the calculation Liquidity index interpretation n Liquidity is inversely related to the index
INVENTORY ACTIVITY MEASURES n Inventory cost flow measures Managerial reporting assumption about which inventory items are sold first n The first-in, first-out (FIFO) method assumes the first units available for sale are sold first n The last-in, first-out (LIFO) method assumes the last units available for sale are sold first n
INVENTORY ACTIVITY MEASURES (CONT. ) n FIFO equals LISH or last-in, still-here; the last units available for sale compose ending inventory n LIFO equals FISH or first-in, still-here; the first units available for sale compose ending inventory
INVENTORY ACTIVITY MEASURES (CONT. ) n Financial statement implications (Exhibit 9 -1) n n The FIFO inventory disclosure better approximates current inventory cost than does the LIFO one LIFO cost of goods sold better current period match costs with revenues than that of FIFO reports higher income than LIFO does when prices are increasing LIFO reports higher income than FIFO does when prices are decreasing
INVENTORY ACTIVITY MEASURES (CONT. ) n Financial 9 -1) statement implications (Exhibit Alternative inventory-related disclosures produced by FIFO and LIFO affect inventory activity measures n LIFO reports faster inventory turnover than FIFO does when prices are rising n LIFO reports fewer days in inventory than FIFO does when prices are rising n
INVENTORY ACTIVITY MEASURES (CONT. ) n LIFO reserves n n n The difference between LIFO and FIFO inventory and cost of goods sold when LIFO is used to report inventory Analysts can convert LIFO disclosures to FIFObased cost of sales and inventory with the aid of LIFO reserve disclosures Using the cost of goods sold section facilities conversion from LIFO to FIFO disclosures (Exhibit 9 -2)
INVENTORY ACTIVITY MEASURES (CONT. ) n LIFO liquidation Occurs when inventory levels are reduced below their beginning balance n Matches previous periods’ costs against current period’s revenues n Reports more income than is sustainable over time n Notational disclosures address LIFO liquidation’s impact on income n
INVENTORY ACTIVITY MEASURES (CONT. ) n Manufacturing considerations Inventory turnover measures the number of times finished goods inventory is sold n A manufacturing concern has three types of inventory n Raw materials n Work in process n Finished goods n
INVENTORY ACTIVITY MEASURES (CONT. ) n Manufacturing considerations (cont. ) Using all three inventory amounts understates the turnover ratio (by overstating its denominator) n No adjustment is needed so long as the proportion of raw materials, work in process and finished goods are relatively constant over time and compatible with benchmark firms n
ACCOUNTS RECEIVABLE ACTIVITY MEASURES n Revenues are realized when goods are sold or services provided n Company receives either cash or a promise of cash (credit sales creating accounts receivable) when revenues are realized n The potential exists that credit sales will not be collected in cash
ACCOUNTS RECEIVABLE ACTIVITY MEASURES (CONT. ) n n Companies do not disclose cash and credit sales Only credit sales should be used in computing accounts receivable turnover Including cash sales in the numerator overstates the accounts receivable turnover ratio Lack of disclosure precludes adjusting the accounts receivable turnover ratio
ACCOUNTS RECEIVABLE ACTIVITY MEASURES (CONT. ) n Bad Debts The inability to collect certain outstanding receivables is a cost of extending credit n Bad debt expense (part of operating expenses) matches that business cost against the revenues realized in a reporting period n
ACCOUNTS RECEIVABLE ACTIVITY MEASURES (CONT. ) n Bad Debts (cont. ) n n n The allowance for uncollectible accounts reduces accounts receivable to its net amount Net accounts receivable are reported on the balance sheet Supplemental disclosures present an entity’s annual bad debt expense and write-offs of uncollectible accounts (Exhibit 9 -5)
ACCOUNTS PAYABLE ACTIVITY MEASURES n Accrued liability activity measures Similar approach to computing accounts payable turnover n Accrued liability turnover equals operating expenses / average accrued liabilities n Number of days in accrued liabilities equals 365 days / accrued liability turnover n
ACCOUNTS PAYABLE ACTIVITY MEASURES (CONT. ) n Conceptual considerations for current liability measures n n Vendor obligations are paid in cash The accounts payable turnover ratio should use purchases (rather than cost of goods sold) in its numerator Certain operating expenses do not require cash payment (e. g. , depreciation) The accrued liability turnover ratio should subtract non-cash obligations from the denominator of the ratio
FINANCIAL FLEXIBILITY n Enables an organization to Take advantage of unexpected opportunities n Meet unforeseen obligations n
FINANCIAL FLEXIBILITY (CONT. ) n Analysts should assess financial flexibility with what if scenarios List the possible unexpected opportunities and unforeseen circumstances n Assign probabilities to them n Investigate the affect of the more probable occurrences on financial flexibility n
FINANCIAL FLEXIBILITY (CONT. ) n Sources of financial flexibility n Lines of credit Prearranged loan with a maximum loan amount n Available for most firms n Callable at any time n
FINANCIAL FLEXIBILITY (CONT. ) n Sources of financial flexibility (cont. ) n Commercial paper (short-term promissory notes) Unsecured loans n Only available to most creditworthy firms n Costly instruments to issue n
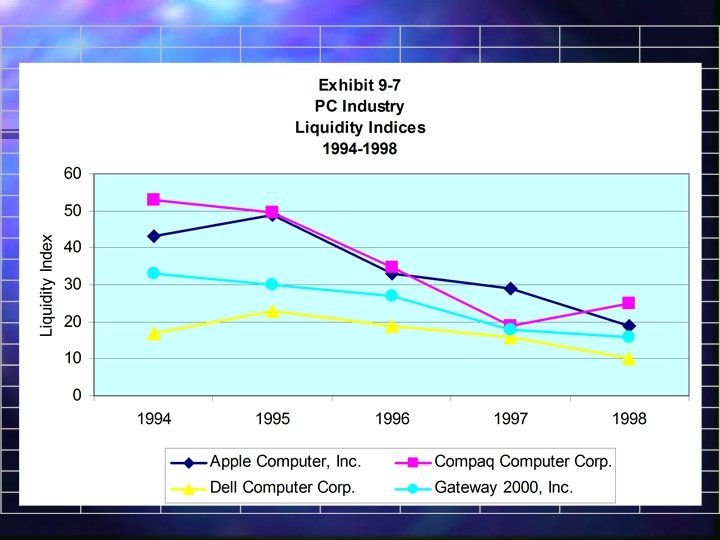
THE PC INDUSTRY n The liquidity index demonstrates the industry’s increasing liquidity (Exhibit 97) n Lower index in the later years of the analysis n Corporate liquidity increased despite a decline in their current ratios
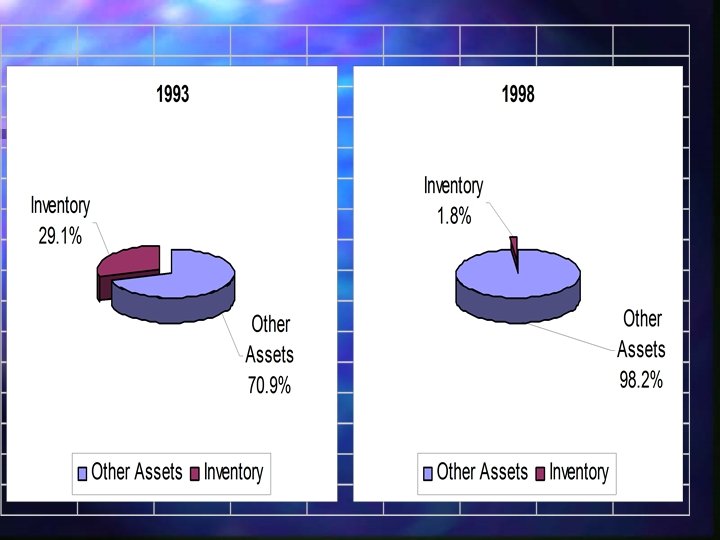
THE PC INDUSTRY (CONT. ) n Inventory analysis n Decline in inventory component costs and the amount of inventory held All four companies cost inventory on a FIFO basis n LIFO reserves are not a reporting issues n LIFO liquidation is not a reporting issue n
THE PC INDUSTRY (CONT. ) n The importance of inventory analysis diminished over time n Industry maturation required more efficient operating cycles n All firms greatly reduced their inventories
THE PC INDUSTRY (CONT. ) Receivable analysis n Changes in receivables differed among companies during the period analyzed (Exhibit 9 -10) n n Apple’s receivables declined (as did their revenues) Compaq’s receivables increased faster than their revenues did Dell’s and Gateway’s receivables increased slower than their revenues did
THE PC INDUSTRY (CONT. ) None of the companies disclosed their cash and credit revenues n Apple appears to adequately provide for bad debts (Exhibit 9 -11) n n The company had a large beginning balance in its allowance account Annual bad debt expenses approximated receivable write-offs The company maintained its large allowance account balance at the end of 1998
APPLE’S BAD DEBTS
THE PC INDUSTRY (CONT. ) n Current liability analysis Became less of a concern in the industry over time n Increased liquidity n Reduced vendor obligations (due to inventory declines) n n Technical adjustments not needed because of strong liquidity position
THE PC INDUSTRY (CONT. ) n Financial flexibility The industry increased financial flexibility from 1993 to 1998 n Companies reported rapid growth in cash and marketable securities n Apple’s deteriorating financial position increased its short-term borrowing costs n