Advanced Placement Statistics Section 9 1 9 2


 to get the question State: What is the probability that")

 all U. S. adults > 10(1012) all U.")
(. 7) > 10")

 & f)")


(. 4) > 10 714 > 10 nq")


(. 4) > 10 120 > 10 nq")


(. 4) > 10 (1200)(.")


(. 4) > 10 (4800)(.")


, 28 – 30")
- Slides: 44
Advanced Placement Statistics Section 9. 1 & 9. 2: Sampling Distributions and Sample Proportions EQ: How do we calculate the statistics for a sampling distribution?
More Stat Humor for March 14 th : Did you know that 3. 14% of sailors are… PI-rates?
RECALL: Design --- planning how to obtain data Descriptive --- using numbers, tables, or graphs to organize and summarize data obtained. Inference --- make generalizations, decisions, and predictions based on data obtained.
Old Terms: Parameter --- fixed number, such as or , which describe a population
In Class p. 568 #1, #2: Use correct notation #1 a #1 b #2 a #2 b
NEW TERMS: Sampling Distributions – statistical values taken from all possible samples of the same size from the same population These may involve sample proportions or sample means.
Variability --describes spread of distribution Sample size better estimate of true parameter Sample sizes tend to have variability
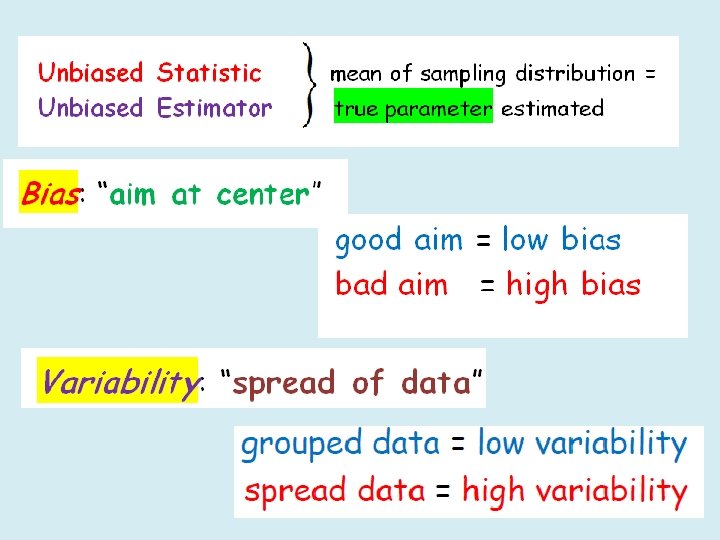
Describe each distribution in terms of low or high bias and variability.
Assignment p. 577 #8, 9, 10
Sample Proportions: statistical proportion used as an unbiased estimator for Remember: You never really know parameters. You must use statistics to estimate them.
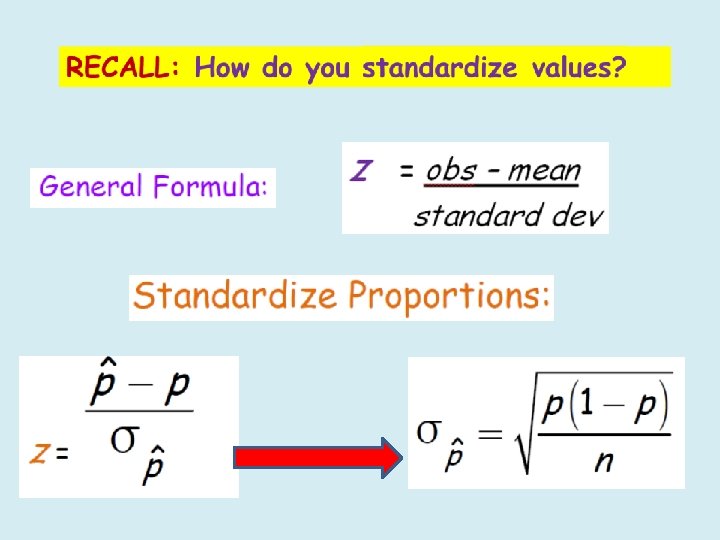
Standard Deviation of Sample Proportion See Formula Sheet!! also called Standard Error
Independence --- Standard Error can be used when n is large enough. CONDITION MUST BE CHECKED AND MET:
Day 48 Agenda: DG 21 --- 20 minutes
The sampling distribution may be calculated as if its approximately NORMAL. CONDITION MUST BE CHECKED AND MET: RECALL: # of successes > 10 # of failures > 10 Now we can use z-scores!!!
I would suggest turning your desk so you can work in a SMALL group as we go over these problems. We will work many example problems for the remainder of the course and it will “ take a village” to complete these tasks. In Class Assignment: p. 588 #19 , 20 , 21 You will need notebook paper for these examples.
We will follow the template: State What is the question asked? Plan Define parameters Address randomness independence and large counts State/calculate values necessary for “do” stage Do Calculate probability using correct notation and formula Make conclusion statement in context of problem Should include sketch if applicable
#19 Go to d) to get the question State: What is the probability that in a random sample of 1012 adults, 67% or fewer will say they drink the milk left in their cereal bowl? Would you consider this unusual?
#19 Plan: parameter of interest p = the true proportion of all US adults who say they drink the milk from their cereal bowl. randomness The problem states a random sample of 1, 012 U. S. adults were asked what they do with the leftover milk in their bowl after they have eaten their cereal.
#19 Plan: independence population > 10(sample) all U. S. adults > 10(1012) all U. S. adults > 10, 120 Population is large enough so we can use standard error.
#19 Plan: large counts np > 10 nq > 10 (1012)(. 7) > 10 (1012)(. 3) > 10 708. 4 > 10 303. 6 > 10 Number of successes and failures both larger than 10. Normal Approximation appropriate.
#19 Do: Since only 1. 86% of the samples of size n = 1012 will have 67% or fewer adults saying they drink the milk from their cereal bowl, I would consider these results unusual.
#19 now we will answer e) & f)
You will need a sample size of 4048 adults to half the standard error. f) If the pollsters had surveyed 1012 teenagers instead of adults , the proportion who say they drink the milk in their cereal bowls would probably be higher. Teenagers are more likely to drink the milk in their bowl.
#20 State: What is the probability a random sample of size n = 1785 fall within ±. 03 of the true population proportion of adults who attended church last week? Plan: parameter of interest p = the true proportion of all adults who attended church last week
#20 randomness The problem states a random sample of 1, 785 adults were asked if they attended church last week. independence population > 10(sample) all adults > 10(1785) all adults > 17, 850 Population large enough we can use standard error.
#20 large counts np > 10 (1785)(. 4) > 10 714 > 10 nq > 10 Normal (1785)(. 6) > 10 Approximation 1071 > 10 appropriate. Number of successes and failures both larger than 10.
#20 Do: Approximately 99. 03% of the random sample of size n = 1785 adults should give ± 0. 03 within the true population proportion of adults who attended church in the last week.
#21 State: What is the probability that a random sample of size n = 300, is within ±. 03 of the true population parameter, p = 0. 4 of people who say they attend church regularly? Plan: population of interest p = the true proportion of people who say they attend church regularly
#21 randomness The problem states a random sample of 300 adults were asked if they attended church regularly. independence population > 10(sample) all adults > 10(300) all adults > 3, 000 Population large enough for independence. (SE)
#21 Large counts np > 10 (300)(. 4) > 10 120 > 10 nq > 10 (300)(. 6) > 10 180 > 10 Number of successes and failures both larger than 10. Normal Approximation appropriate.
#21 Do: The probability that an SRS of adults of size n = 300 has 37% to 43% who say they attend church regularly is 71. 09%.
#21 State: What is the probability that a random sample of size n = 1200, is within ±. 03 of the true population parameter, p = 0. 4 of people who say they attend church regularly? Plan: population of interest p = the true proportion of people who say they attend church regularly
#21 randomness The problem states a random sample of 1200 adults were asked if they attended church regularly. independence population > 10(sample) all adults > 10(1200) all adults > 120, 000 Population large enough for independence. (SE)
#21 Large counts np > 10 nq > 10 (1200)(. 4) > 10 (1200)(. 6) > 10 480 > 10 720 > 10 Number of successes and failures both larger than 10. Normal Approximation appropriate.
Do: The probability that an SRS of adults of size n = 1200 has 37% to 43% who say they attend church regularly is 96. 68%.
#21 State: What is the probability that a random sample of size n = 4800, is within ±. 03 of the true population parameter, p = 0. 4 of people who say they attend church regularly? Plan: population of interest p = the true proportion of people who say they attend church regularly
#21 randomness The problem states a random sample of 4800 adults were asked if they attended church regularly. independence population > 10(sample) all adults > 10(4800) all adults > 480, 000 Population large enough for independence. (SE)
#21 Large counts np > 10 nq > 10 (4800)(. 4) > 10 (4800)(. 6) > 10 1920 > 10 2880 > 10 Number of successes and failures both larger than 10. Normal Approximation appropriate.
Do: The probability that an SRS of adults of size n = 4800 has 37% to 43% who say they attend church regularly is 99. 99%.
Conclusion: Larger sample sizes produce sampling distributions of the sample proportion that are more concentrated about the true proportion (less variability).
Assignment p. 589 – 591 #25, 26, 27 (a, b), 28 – 30