Advance in Hemodynamic Monitoring By Dr H P

Advance in Hemodynamic Monitoring By Dr H P Shum

Outline • Introductions • What we have previously – A line / CVC/ PAC • Advance techniques for haemodynamic monitoring

Introductions • Hemodynamics is concerned with the forces generated by the heart and the resulting motion of blood through the cardiovascular system • Hemodynamic monitoring is the intermittent or continuous observation of physiological parameters pertaining to the circulatory system with a view to early detection of need for therapeutic interventions

4 factors that affecting the haemodynamic conditions Myocardial contraction and heart rate Intravascular volume Vasoactivity

Old equipments • Arterial line – Real time SBP, DBP, MAP – Pulse pressure variation ( PP) • ΔPP (%) = 100 × (PPmax - PPmin)/([PPmax + PPmin]/2) • >= 13% (in septic pts, ) discriminate between fluid responder and non respondaer (sensitivity 94%, specificity 96%) Am J Respir Crit Care Med 2000, 162: 134 -138

Arterial line • Advantages – – Easy setup Real time BP monitoring Beat to beat waveform display Allow regular sampling of blood for lab tests • Disadvantages – Invasive – Risk of haematoma, distal ischemia, pseudoaneurysm formation and infection

Old equipments • Central venous catheter – Measurement of CVP, medications infusion and modified form allow for dialysis

Limitation of CVP Obstruction of the great veins Mechanical ventilation Decrease right ventricular compliance Systemic venoconstriction Tricuspid regurgitation

Central venous catheter • Advantages – Easy setup – Good for medications infusion • Disadvantages – Cannot reflect actual RAP in most situations – Multiple complications • Infections, thrombosis, complications on insertion, vascular erosion and electrical shock

Old equipment • Pulmonary arterial catheter

Indications for PAP monitoring • Shock of all types • Assessment of cardiovascular function and response to therapy • Assessment of pulmonary status • Assessment of fluid requirement • Perioperative monitoring

Clinical applications of PAC can generate large numbers of haemodynamic variables • • • Central venous pressure (CVP) Pulmonary arterial occlusion pressure (PAOP) =LAP = LVEDP Cardiac output / cardiac index (CO / CI) By thermodilution Stroke volume (SV) R ventricle ejection fraction/ end diatolic volume (RVEF / RVEDV) • Systemic vascular resistance index (SVRI) • Pulmonary vascular resistance index (PVRI) • Oxygen delivery / uptake (DO 2 / VO 2)

Area under curve is inversely proportion to rate of blood flow in PA ( = CO)

Patient with hypotension Hypovolemia • Low CVP • Low CI • High SVRI Cardiogenic • High CVP • Low CI • High SVRI Vasogenic • Low CVP • High CI • Low SVRI Consider fluid challenge Consider inotopic / IABP Consider vasopressor

Mixed Venous Saturation Sv. O 2 • Measured in pulmonary artery blood • Marker of the balance between whole body O 2 delivery (DO 2) and O 2 consumption (VO 2) • VO 2 = DO 2 * (Sa. O 2 – Sv. O 2) • In fact, DO 2 determinate by CO, Hb and Sa. O 2. Therefore, Sv. O 2 affected by – – CO Hb Arterial oxygen saturation Tissue oxygen consumption

Mixed Venous Saturation Sv. O 2 • Normal Sv. O 2 70 -75% Decreased Sv. O 2 • increased consumption • pain, hyperthermia • decreased delivery • low CO • anemia • hypoxia Increased Sv. O 2 • Increased delivery • high CO • hyperbaric O 2 • Low consumption • sedation • paralysis • cyanide toxicity

PAC • Advantages – Provide lot of important haemodynamic parameters – Sampling site for Sv. O 2 • Disadvantages – Costly – Invasive – Multiple complications (eg arrhythmia, catheter looping, balloon rupture, PA injury, pulmonary infarction etc) – Mortality not reduced and can be even higher Crit Care Med 2003; 31: 2734 -2741 JAMA 1996; 276 889 -897

Advance in haemodynamic assessment • Modification of old equipment • Echocardiogram and esophageal doppler • Pulse contour analysis and transpulmonary thermodilution • Partial carbon dioxide rebreathing with application of Fick principle • Electrical bioimpedance

tru. CCOMS system

As CO increase, blood flow over the heat transfer device increase and the device require more power to keep the temp. difference Therefore, provide continuous CO data

Objective To compare measurements of cardiac output using a new pulmonary artery catheter with those obtained using two " gold standard " methods: the periaortic transit time ultrasonic flow probe and the conventional pulmonary artery thermodilution. Design Prospective clinical trial. Setting Cardiac surgery operating room and surgical ICU in a university hospital. Material and methods In the operating room, a new pulmonary artery catheter (tru. CCOMS system) was inserted in eight patients. A periaortic flow probe was inserted in four of them. Measurements of cardiac output obtained with the tru. CCOMS catheter and with the flow probe were compared at different phases of the surgical procedure. In the intensive care unit, the cardiac output displayed by the tru. CCOMS monitor was compared with the value obtained after bolus injection performed subsequently. Results In the operating room (70 measurements), the coefficient of correlation between cardiac output measured by the flow probe and the tru. CCOMS system was r 2 = 0. 79, the bias was +0. 11 l/min with a precision of 0. 47 l/min, and limits of agreement – 0. 83 to +1. 05 l/min. In the intensive care unit (108 measurements), the coefficient of correlation between cardiac output measured by thermodilution and the tru. CCOMS system was r 2 = 0. 56, the bias was – 0. 07 l/min, the precision was 0. 66 l/min, and the limits of agreement were – 1. 39 to +1. 25 l/min. Conclusion The tru. CCOMS system is a reliable method of continuous cardiac output measurement in cardiac surgery patients.

Tru. CCOMS system • Advantage – Continuous CO monitoring – Provision of important haemodynamic parameter as PAC • Disadvantage – Invasive – Costly – Complications associated with PAC use

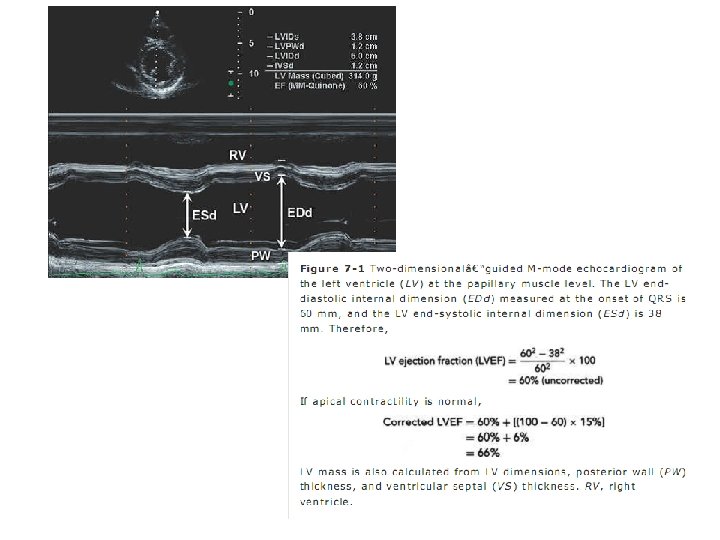
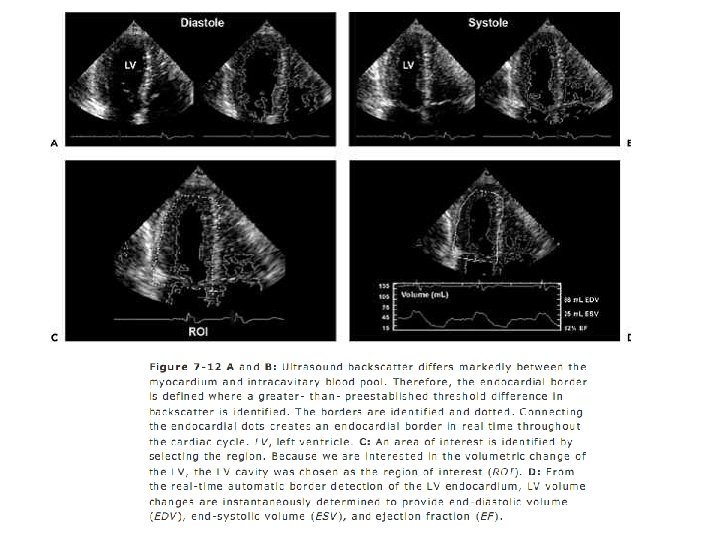
Transthoracic echo • Assessment of cardiac structure, ejection fraction and cardiac output • Based on 2 D and doppler flow technique

Echo doppler ultrasound • Measure blood flow velocity in heart and great vessels • Based on Doppler effect “ Sound freq. increases as a sound source moves toward the observer and decreases as the soure moves away”

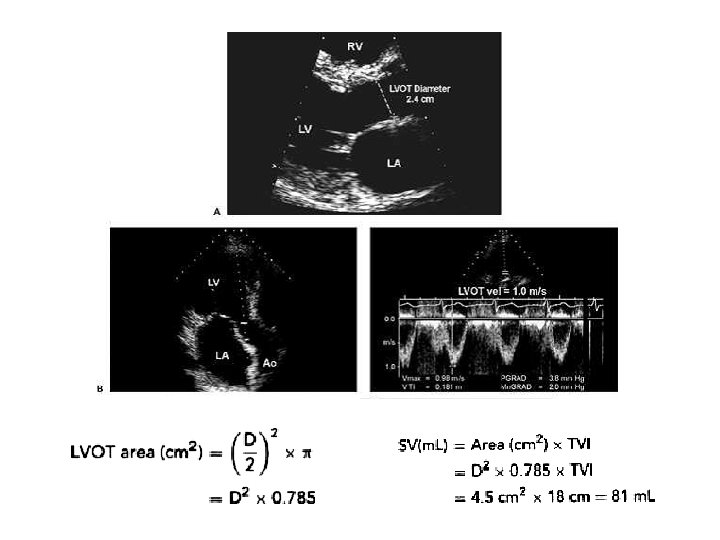
For transthoracic echo • Haemodynamic assessment for SV and CO – Flow rate = CSA x flow velocity – Because flow velocity varies during ejection, individual velocities of the doppler spectrum need to be summed – Sum of velocities called velocity time integral (VTI) – SV = CSA x VTI – CSA =( LVOT Diameter /2 )2 * – Therefore SV = D 2 * 0. 785 * VTI – CO = SV * HR

Transthoracic echo • Advantages – Fast to perform – Non invasive – Can assess valvular structure and myocardial function – No added equipment needed • Disadvantages – Difficult to get good view (esp whose on ventilator / obese) – Cannot provide continuous monitoring

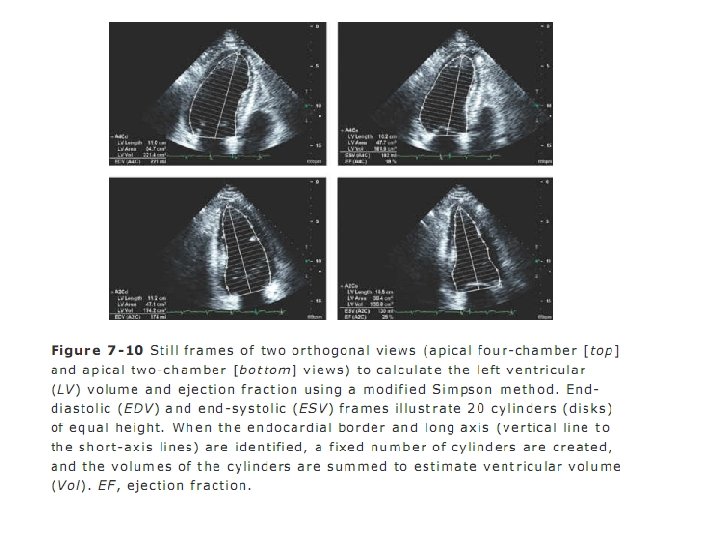
Transesophageal echo • CO assessment by Simpson or doppler flow technique as mentioned before • Better view and more accurate than TTE • Time consuming and require a high level of operator skills and knowledge

Esophageal aortic doppler US Decending aorta • Doppler assessment of decending aortic flow • CO determinate by measuring aortic blood flow and aortic CSA • Assuming a constant partition between caudal and cephalic blood supply areas • CSA obtain either from nomograms or by M-mode US • Probe is smaller than that for TEE • Correlate well with CO measured by thermodilution Crit Care Med 1998 Dec; 26(12): 2066 -72

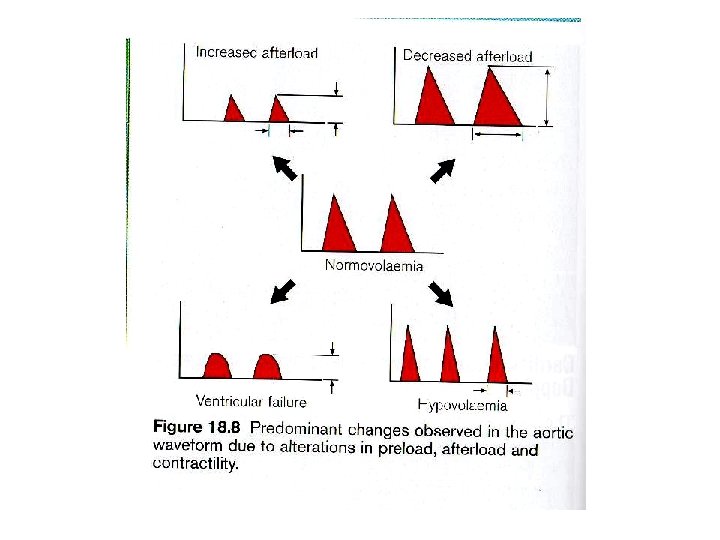
Normovolemia

Esophageal aortic doppler US • Advantages – – Easy placement, minimal training needed (~ 12 cases) provide continuous, real-time monitoring Low incidence of iatrogenic complications Minimal infective risk • Disadvantages – High cost – Poor tolerance at awake patient, so for those intubated – Probe displacement can occur during prolonged monitoring and patient’s turning – High interobserver variability when measuring changes in SV in response to fluid challenges

Pulse contour analysis • Arterial pressure waveform determinate by interaction of stroke volume and SVR

Pulse contour analysis • Because vascular impedance varies between patients, it had to be measured using another modality to initially calibrate the PCA system • The calibration method usually employed was arterial thermodilution or dye dilution technique • PCA involves the use of an arterially placed catheter with a pressure transducer, which can measure pressure tracings on a beat-to-beat basis • Pi. CCO and Li. DCO are the two commonly used model

What is the Pi. CCO-Technology? The Pi. CCO-Technology is a unique combination of 2 techniques for advanced hemodynamic and volumetric management without the necessity of a right heart catheter in most T injection patients: Transpulmonary Thermodilution t CV Bolus injecti on CALIBRAT ION PULSIOCA P TH Pulse Contour Analysis t

Parameters measured with the Pi. CCOTechnology The Pi. CCO measures the following parameters: Thermodilution Parameters • Cardiac Output CO • Global End-Diastolic Volume GEDV • Intrathoracic Blood Volume ITBV • Extravascular Lung Water EVLW* • Pulmonary Vascular Permeability Index PVPI* • Cardiac Function Index CFI • Global Ejection Fraction GEF Pulse Contour Parameters • Pulse Contour Cardiac Output PCCO • Arterial Blood Pressure AP • Heart Rate HR • Stroke Volume SV • Stroke Volume Variation SVV • Pulse Pressure Variation PPV • Systemic Vascular Resistance SVR • Index of Left Ventricular Contractility d. Pmx*

3 How does the Pi. CCO-Technology work? Most of hemodynamic unstable and/or severely hypoxemic patien instrumented with: Central venous line (e. g. for vasoactive agents administration…) Arterial line (accurate monitoring of arterial pressure, blood s The Pi. CCO-Technology uses any standard CV-line and a thermis tipped arterial Pi. CCO-catheter instead of the standard arteria line.
 CV A PULSIOCATH thermodilution catheter with lumen")
Pi. CCO Catheter Central venous line (CV) CV A PULSIOCATH thermodilution catheter with lumen for arterial pressure measurement Axillary: Brachial: Femoral: Radial: B R 4 F (1, 4 mm) 8 cm 4 F (1, 4 mm) 22 cm 3 -5 F (0, 9 -1, 7 mm) 7 -20 cm 4 F (1, 4 mm) 50 cm F t ! r e No Ri t gh H rt a e he t Ca
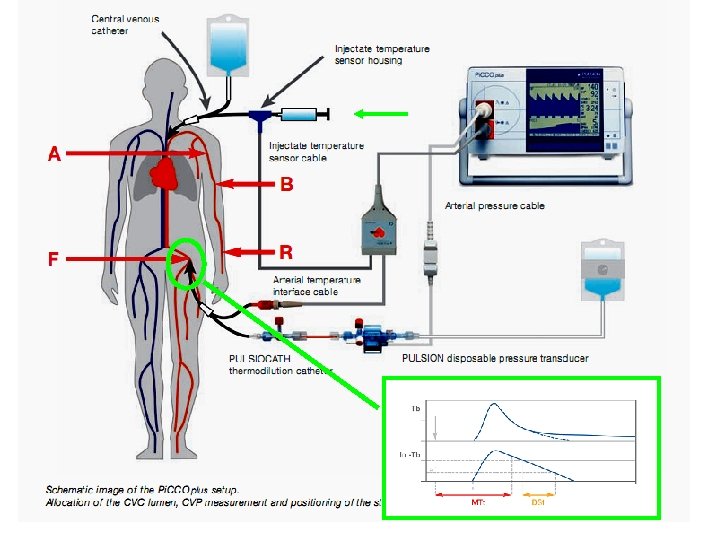

A. Thermodilution parameters Pi. CCO Catheter e. g. in femoral artery Bolus Injectio n Transpulmonary thermodilution measurement only requires central venous injection of a cold (< 8°C) or room-tempered (< 24°C) saline bolus… Right Heart RA RV Lung s EVL W* PBV EVL W* Left Heart LA LV

Transpulmonary thermodilution: Cardiac Output After central venous injection of the indicator, thermistor at the tip of the arterial catheter measures the downstream temperature changes. Cardiac output is calculated by analysis of thermodilution curve using a modified Stewart-Hamilton algorithm: injection CO Calculation: Area under the Thermodilution Curve Tb t Tb = Blood temperature Ti = Injectate temperature Vi = Injectate volume ∫ ∆ Tb. dt = Area under thermodilution curve K = Correction constant, made up of specific weigh specific heat of blood and injectate

Transpulmonary thermodilution: Volumetric parameters 1 All volumetric parameters are obtained by advanced analysis of thermodilution curve: For the calculations of volumes… Advanced Thermodilution Curve Analysis Tb Mtt: Mean Transit time injection recirculatio time when half of the n indicator has passed the point of detection in the artery ln Tb …and… -1 e DSt: Down Slope time exponential downslope time of thermodilution curve …are important. t MTt DSt

Transpulmonary thermodilution: Volumetric parameters 2 After injection, the indicator passes the following intrathoracic compartments: ITTV PTV CV Bolus Injection RAEDV RVEDV Lungs Thermodilution curve measured with arterial catheter LAEDV LVEDV Left Right Heart The intrathoracic compartments can be considered as a series of “mixing chambers” for the distribution of the injected indicator (intrathoracic thermal volume). The largest mixing chamber in this series are the lungs, here the indicator (cold) has its largest distribution volume (largest thermal volume).

Calculation of volumes ITTV = CO * MTt. TDa RAEDV RVEDV PTV = CO * DSt. TDa PTV GEDV = ITTV - PTV RAEDVRVEDV ITBV = 1. 25 * GEDV RAEDVRVEDV LAEDV LVEDV PBV EVLW* = ITTV ITBV LAEDV LVEDV EVLW* LAEDV LVEDV
 is the ratio of Extravas Lung Water (EVLW*) to")
Pulmonary Vascular Permeability Index (PVPI*) is the ratio of Extravas Lung Water (EVLW*) to pulmonary blood volume (PBV). It allows to type of pulmonary oedema. PVPI* normal Pulmonarv Blood Volume PBV norma = l elevate PVPI norma EVLW*d *l. PBV elevate = Hydrostatic pulmonary edema Permeability pulmonary edema d elevate PBV Normal Lun g Extra Vascular Lung Water PBV * PBV EVLW normal EVLW d PVPI* = elevate PBV * dnorma l

Global Ejection Fraction: Stroke Volume related to End-Diastolic Volume Lungs Right Heart Left Heart EVLW* PBV RAE DV 1 & RVE DV EVLW* Stroke Volume SV 2 LAE DV LVE DV 3 GEF = RVEF = SV RVEDV RV ejection fraction (RVEF) (pulmonary artery thermodilution) LVEF = 4 x SV GEDV SV LVEDV LV ejection fraction (LVEF) (echocardiography) Global Ejection Fraction (GEF) (transpulmonary thermodilution)
![Pulse Contour Analysis - Principle P [mm Hg] t [s] d. P P(t) PCCO](http://slidetodoc.com/presentation_image_h/91a236781690a85744569967a9b8b32c/image-50.jpg "Pulse Contour Analysis - Principle P [mm Hg] t [s] d. P P(t) PCCO")
Pulse Contour Analysis - Principle P [mm Hg] t [s] d. P P(t) PCCO = cal • HR • ( + C(p) • ) dt dt SVR Systole Patient-specific calibration factor (determined by thermodilution) Heart rate Area under pressure curve Shape of pressure curve Aortic compliance

Index of Left Ventricular Contractility* d. Pmx* = d. P/dtmax of arterial pressure curve P [mm Hg] t [s] d. Pmx* represents left ventricular pressure velocity increase and thus is a parameter of myocardial contractility
 represents the variation of stroke volume")
Stroke Volume Variation: Calculation Stroke Volume Variation (SVV) represents the variation of stroke volume (SV) over the ventilatory cycle. SVmax SVmin SVmean SVV is. . . SVmax – SVmin SVV = SVmean . . . measured over last 30 s window … only applicable in controlled mechanically ventilated patients with regular heart rhythm
 represents the variation of the pulse")
Pulse Pressure Variation: Calculation Pulse pressure variation (PPV) represents the variation of the pulse pressure over the ventilatory cycle. PPmean PPmax PPmin PPmax – PPmin PPV = PPmean PPV is. . . …measured over last 30 s window …only applicable in controlled mechanically ventilated patients wit regular beat rhythm

Clinical application CO EVLW* GEDV SVR gs u Dr e Volum What is the current situation? . …………. Cardiac Output! What is the preload? . ………………. . . …Global End-Diastolic Volume! Will volume increase CO? . . ………. Stroke Volume Variation!

Global End-Diastolic Volume, GEDV and Intrathoracic Blood Volume, ITBV have shown to be far more sensitive and specific to cardiac preload compared to the standard cardiac filling pressures CVP + PCWP as well as right ventricular enddiastolic volume. The striking advantage of GEDV and ITBV is that they are not adversely influenced by mechanical ventilation Crit Care 4, 2000 Int Care Med 2002 Eur J Anaesth 19, 2002 Anesth Analg 95, 2002

Extravascular Lung Water, EVLW* has shown to have a clear correlation to severity of ARDS, length of ventilation days, ICU-Stay and Mortality and is superior to assessment of lung edema by chest x-ray and clearly indicates fluid overload Mortality as function of ELWI* in 373 critically ill ICU patients Sakka et al , Chest 2002

Relevance of EVLWManagement n=101 Ventilation days ICU days * * PAC group EVLW* group 22 days 9 days PAC group EVLW* group 15 days 7 days 101 patients with pulmonary edema were randomized to a pulmonary artery catheter (PAC) management group in whom fluid management decisions were guided by PCWP measurements and to an Extravascular Lung Water (EVLW*) management group using a protocol based on the bedside measurement of EVLW *. ICU days and ventilator-days were significantly shorter in patients of the EVLW* group.

SVV and PPV – Clinical Studies Sensitivity SVV and PPV are excellent predictors of volume responsiveness. 1 0, 8 Central Venous Pressure (CVP) can not predict whether volume load leads to an increase in stroke volume or not. Berkenstadt et al, Anesth Analg 92: 984 - 0, 6 0, 4 - - - CVP __ SVV 0, 2 989, 2001 0 0 0, 5 Specificity 1

Normal ranges Parameter Range Unit Ø CI 3. 0 – 5. 0 l/min/m 2 Ø SVI 40 – 60 ml/m 2 Ø GEDI 680 – 800 ml/m 2 Ø ITBI 850 – 1000 ml/m 2 Ø ELWI* 3. 0 – 7. 0 ml/kg Ø PVPI* 1. 0 – 3. 0 Ø SVV 10 % Ø PPV 10 % Ø GEF 25 – 35 % Ø CFI 4. 5 – 6. 5 1/min Ø MAP 70 – 90 mm. Hg Ø SVRI 1700 – 2400 dyn*s*cm-5*m
 R E S U")
Decision tree for hemodynamic / volumetric monitoring CI (l/min/m 2) R E S U L T S <3. 0 <700 <850 GEDI (ml/m 2) or ITBI (ml/m 2) ELWI* (ml/kg) (slowly responding) <700 <850 >700 >850 <10 >10 V+ V+! Cat Cat V- V+ V+! V- 700 -800 850 -1000 >700 >850 700 -800 850 -1000 <10 <10 <10 >5. 5 >30 >4. 5 >25 >5. 5 >30 T >700 GEDI (ml/m 2) H 1. 2 >850 or ITBI (ml/m ) E R T 2. Optimise to SVV** (%)<10 AA PR Y G CFI (1/min) >4. 5 E or GEF (%) >25 T ELWI* (ml/kg) >3. 0 10 <10 >10 <10 OK! 10 Cat = catecholamine / cardiovascular agents V+ = volume loading (! = cautiously) V- = volume contraction ** SVV only applicable in ventilated patients without cardiac arrhythmia

Li. DCO system

Pulse contour analysis • Advantages – Almost continuous data of CO / SV variation – Provide information of preload and EVLW • Disadvantages – Minimal invasive – Optimal arterial pulse signal required • Arrhythmia • Damping • Use of IABP

Partial carbon dioxide rebreathing with application of Fick principle • Fick principle is used for CO measurement • CO = VO 2 / (Ca. O 2 – Cv. O 2) = VCO 2 / (Cv. CO 2 – Ca. CO 2) • Based on the assumption that blood flow through the pulmonary circulation kept constant and absence of shunt • Proportional to change of CO 2 elimination divided by change of ETCO 2 resulting from a brief rebreathing period • The change was measured by NICO sensor
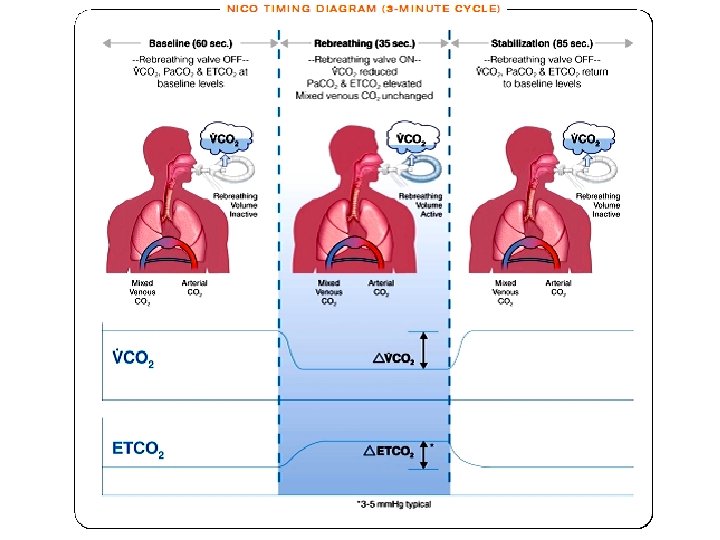
 remains unchanged between baseline")
assume that the mixed venous co 2 concentration (Cvco 2) remains unchanged between baseline and rebreathing conditions S = slope of CO 2 dissociation curve

Partial carbon dioxide rebreathing with application of Fick principle • Advantages – Non invasive • Disadvantages – Only for those mechanically ventilated patient – Variation of ventilation modality and presence of significantly diseased lung affect the CO reading – Not continuous monitoring

Electrical bioimpedance • Made uses of constant electrical current stimulation for identification of thoracic or body impedance variations induced by vascular blood flow

• Electrodes are placed in specific areas on the neck and thorax • A low-grade electrical current, from 2 - 4 m. A is emitted, and received by the adjacent electrodes • Impedance to the current flow produces a waveform • Through electronic evaluation of these waveforms, the timing of aortic opening and closing can be used to calculate the left ventricular ejection time and stroke volume

Electrical bioimpedance • Some report same clinical accuracy as thermodilution technique Crit Care Med 22: 1907 -1912 Chest 111: 333 -337 Crit Care Med 14: 933 -935 • Other report poor agreement in those haemodynamically unstable and post cardiac surgery Crit Care Med 21: 1139 -1142 Crit Care Med 23: 1667 -1673 • Newly generation EB device using upgraded computer technology and refined algorithms to calculate CO and get better results Curr Opin Cardio 19: 229 -237 Int Care Med 32: 2053 -2058

Electrical bioimpedance • Advantage – Non invasive • Disadvantage – Reliability in critically ill patients still not very clear

In conclusion • Haemodynamic monitoring enable early detection of change in patient’s conditions • New techniques provide reasonably good results and less invasive • Always correlate the readings / findings with clinical pictures in order to provide the best treatment options

The End
- Slides: 72