Adolescent Epidemiology Why How to use Adolescent Health


: Why do clinicians/public health specialists need epidemiology?")


 mortality rate is the ratio of the number of deaths")


 measure the")


 Vital statistics (birth, death certificates) collected")


 Source")


 Choose geographical level Access data (get on internet, use")
")


- Slides: 50
Adolescent Epidemiology: Why & How to use Adolescent Health Indicators ? Updated July 2017
At the end of this session the participants will be able to…. Define epidemiology and main indicators Identify the role of epidemiological data and main indicators in understanding adolescent health Access and use available adolescent health data at national and international levels 2
Did you know? ? ? Coffee can cause depression among twins! 3
Epidemiology? Not exactly… 4
Why do clinicians/public health specialists need epidemiology? 5
Group work Exchange in pairs (5 minutes): Why do clinicians/public health specialists need epidemiology? Agree on 2 main reasons 6
? has/does what, Who when, where, & why 7
Epidemiology, definition A scientific discipline that studies the frequency, distribution, in time and space, of diseases, health disorders or health behaviours in defined human populations, as well as their determinants Who has (does) what, when, where and why? Epidemiologists study conditions of good health, as well as the different factors influencing onset, course, and consequences of diseases/health behaviours and possible methods of prevention 8
9
Main health indicators Demographics – – – Size of the population Distribution of the population Rates (birth, death/mortality, fertility…) Life expectancy DALY Morbidity – Prevalence – Incidence Self-reported perceived health, well-being, life-style… 10
Demographics 11
Adolescent population compared to the whole population Source: State of the world population, 2014 12
Distribution of the world’s population by age and sex, 2015 Source: United Nations, Department of Economic and Social Affairs, World Population Prospects: The 2015 Revision (2015) 15
Population of adolescents aged 10 -19 as a proportion of total population, by region, 2016 1, 8 billions of adolescents source UNICEF, 2016 16
Rates: Mortality The (gross) mortality rate is the ratio of the number of deaths (n) in the year to the average total population for the year (N), usually given for 100 000 inhabitants: Mortality rate = (n/N)x 100 000 Specific mortality rates are the number of deaths during the year in a given sub-group (n 1), (age categories, sex, social categories…) / average sub-population (N 1) 17
Mortality rates/1, 000 by age, 2000 - 2012 Estimated 1. 2 million adolescents died in 2015, >3000/day Source: WHO Global Health Estimates, 2012 Title of module 18
Percentage distribution of deaths by gender, 019 y-o, 2012, by cause & age group Source: World Health Organization, Global Health Estimates (GHE) Summary Tables: Deaths by cause, 20 age, sex and region, 2012, WHO Geneva 2014, recalculated by UNICEF.
Top 10 causes of death among adolescents by sex, global, 2012 Source: WHO Global Health Estimates, 2012 21
Disability-adjusted life years: DALYs Combining mortality and morbidity Disability-adjusted life years (DALYs) measure the years of healthy life lost due to ill health, disability or premature death DALYs estimate the gap between current health status and an ideal health status, with the entire population aging free of disease and disability. DALYs are +++ to define public health priorities during adolescence. They indicate the total impact of adolescent health problems and health-related behaviours across the life-course 24
Top 10 causes of DALYs among adolescents by sex, global, 2012 Source: WHO Global Health Estimates, 2012 25
Top 10 causes of death among adolescents by sex, global, 2012 Source: WHO Global Health Estimates, 2012 26
Morbidity indicators 28
Morbidity indicators: prevalence & incidence Population Time Prevalence ? Incidence Subjects with a disease/problem in a given population 29
Prevalence & Incidence Prevalence Incidence 30
Health indicators Morbidity indicators allow to approach the frequency of a health condition/behaviour in a population Prevalence is the proportion of a population affected by a specific condition in a given population at a specified time period : P(t) = Number of cases of disease in given time period/total number in population in that time period Incidence is the number of new cases of a disease during a given time in a given population at risk : I = Number of new cases of disease in given time period/total number in population at risk at that time period [] 31
Factors influencing Prevalence Longer duration of the disease Prolongation of life of patients Increase in new cases (increase in incidence) Shorter duration of disease High case-fatality rate from disease In-migration of cases Decrease in new cases (decrease in incidence) Out-migration of healthy people In-migration of susceptible people Out-migration of cases Improved diagnostic facilities (better reporting) Improved cure rate of cases 32
Sources of data Census (national, regional, various frequencies) Vital statistics (birth, death certificates) collected nationaly, standardised by WHO for global statistics Health status data (National/international surveys on various topics, surveillance data, registry data (cancers, birth defects…), individual or aggregate patient records, mandatory declarations of specific diseases…) Title of module 34
Sources of data Health behaviour data (Health Behaviour in Schoolaged Children, European School Survey Project on Alcohol and Other Drugs, Youth Risk Behaviour Survey, Global Youth Tobacco Survey, Global School -based Student Health Survey, national, local… ) Health economics (health ressources (beds, professionnals, services…), payment records…) Insurance data Clinical records, biological data… Title of module 35
Self-reported data 36
Adolescents perceptions of most important health issues 37
Mental health 38
Title of module 39
Suicide rates of adolescents aged 15– 19 per 100, 000, (2006 -2009 -2013) Source WHO mortality data base 2016, UNICEF, report card 14, 2017 40
Adolescents reporting ≥ 2 psychological symptoms ≥ once a week (feeling low, irritable, nervous, having sleeping difficulties) Source: HBSC, UNICEF report card 14, 2017 41
Top 10 causes of DALYs among adolescents by sex, global, 2012 Source: WHO Global Health Estimates, 2012 Title of module 43
Overweight & obesity Title of module 44
Overweight & obesity, among 15 -19 y-o, 2015 Source: Institute for health metrics and evaluation, 2017 45
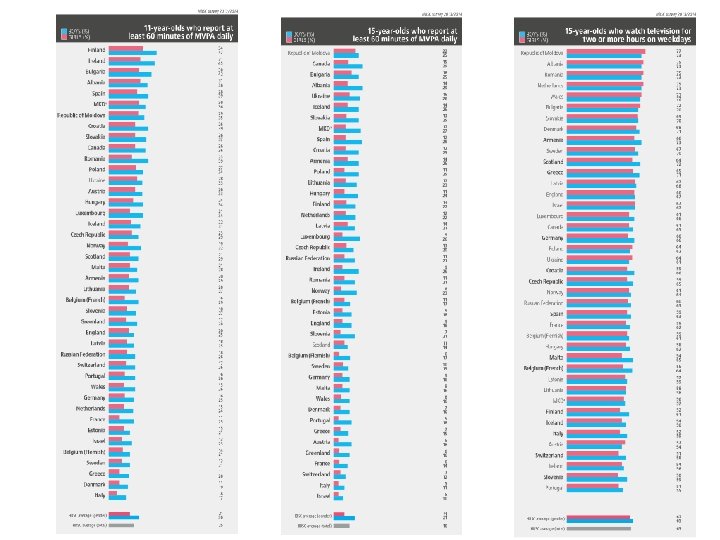
Gender differences, moderate vigourous physical activity, 11, 13, 15, HBSC 2014 Source: WHO obesity report, 2017 47
Associations between family affluence and moderate physical activity 1 Hour/day, 15 year-olds, 2014 Higher rates among higher afflence Lower rates among higher affluence E Godeau HBSC 2014 Nutrition FOIX
Associations between family affluence and overweight and obesity, 15 y-o, 2014 E Godeau HBSC 2014 Nutrition FOIX
Disparities between overweight and perception of being too fat, 15 y-o A question of gender & culture… Overweitgh & obesity Feeling too fat
2017 05 E Godeau HBSC 2014 PES PS
Group work 52
Mind the Gap ! A series of interactive sessions on the impact of gender on health & health behaviours of adolescents
Group work You are asked to participate in a series of interactive sessions on the impact of gender on adolescent health & health behaviour You want to prepare 3 slides to set the scene for your lecture Find striking data showing evidence of the gender gap existing in health & health behaviours among adolescents Choose a couple of topics to illustrate your point 54
At each table Choose topic(s) Choose geographical level Access data (get on internet, use links given) Prepare your 3 slides (by group) Note that those slides can be used (and shared) on Friday morning to prepare your Eu. Teach lecture 55
Where to find some data (choose one or 2 sites depending on your topic) All about population: demographic indicators/countries, intereactive http: //www. ined. fr/en/everything_about_population/ Global health data (WHO), data visualisation… http: //apps. who. int/gho/data/node. sdg. tp-1? lang=en Series of brief reports of health inequalities in rich countries UNICEF report cards: https: //www. unicef-irc. org/publications/series/16/ HBSC website: health behaviours, reports, data visualition, linkks to access data…: https: //www. hbsc. org ESPAD webpage: substance use in EU: http: //www. espad. org/report/home Lancet series and reports: ideas, data, links http: //www. thelancet. com/pbassets/Lancet/stories/our-future/index. html#read-the-report-7593 Global burden of disease: lots of data, interactive data set, data visualisation, all health topics http: //www. healthdata. org/gbd/data Links to fact sheets on adolescents health & health behaviours: http: //www. un. org/youthenvoy/health/ 56
So far we have learned … Some basic definitions of epidemiology and main relevant indicators Some caracteristics of the epidemiology of adolescent health How and where to find relevant data on adolescent health and health behaviours 62
Take home message y g o l o i m e d i Ep Clinic Thank you! 64