Adequacy and Equity in Nevada School Funding A


")
 O E=f(P, R, St,")


- Slides: 23
Adequacy and Equity in Nevada School Funding: A School-Level, Cost Function Analysis Wen Wang, Ph. D. , Indiana University-Purdue University Indianapolis Anna Lukemeyer, J. D. , Ph. D. , University of Nevada Las Vegas
Special Acknowledgements O Carrie Sampson, Ph. D. Candidate, University of Nevada Las Vegas O Jaewon Lim, Ph. D. , University of Nevada Las Vegas O Robin Mendoza, MPA Student, University of Nevada Las Vegas O The Lincy Institute, Las Vegas, Nevada (for funding and support)
Introduction O Nevada ranks among the lowest states in the nation in terms of both student achievement and school funding O 39 th (2013 NAEP 4 th grade reading) O 37 th (2013 NAEP 4 th grade mathematics) O 43 rd (2012 spending per pupil)
Introduction O A number of school funding reform bills are currently under consideration in the Nevada legislature. O This study uses cost function methodology to analyze the adequacy and the equity of the Nevada school finance system O Presentation today: preliminary findings
Current Nevada School Finance System Revenue Sources 6. 6% 30. 8% 62. 6% Local State Federal
Current Nevada School Finance System Primary Sources of State and Local Funds 15% 51% 19% Sales Tax Property Tax Gaming Tax Other Sources
Current Nevada School Finance System O No state funding for capital outlay (i. e. , buildings, etc. ) O Only 17 school districts (coterminous with counties) O Per pupil funding (state and local) determined largely at the state level. There is little leeway for additional local discretionary spending.
Current Nevada School Finance System
Current Nevada School Finance System O Based on enrollment with adjustments made for district economic and geographic characteristics and ability to raise revenue. O Does not structurally account for the relatively large number of ELL or low-income students. O Only allocation for at-risk students is for special education. O Categorical state funding exists for specific purposes such as class-size reduction and early childhood programs.
Current Nevada School Finance System
Current Nevada School Finance System
Current Nevada School Finance System
Research Objectives O Using education cost function methodology and school level data: O Estimate the amount of funding needed to provide students in a hypothetical “average” school a reasonable opportunity to achieve specified performance outcomes O Estimate adjustments to this level of funding based on resource costs and student characteristics
Data and Methods O Primary challenges; O No integrated dataset with the variables needed for a cost function study of Nevada O N=17 school districts
Data and Methods O Current dataset; O School level performance, demographic, and spending data for almost all public schools for school years 2012 -2013 and 2013 -2014 (approximately 635 of the 700 public schools for each year) O District-level data for property tax base, community income and demographics, etc.
Data and Methods O Data underlying findings presented today O Omits combined schools (K-12, K-8, 6 -12), state sponsored charter schools, and special purpose schools. O Cost function study also omits outliers and schools in very sparsely populated counties (Esmeralda and Eureka).
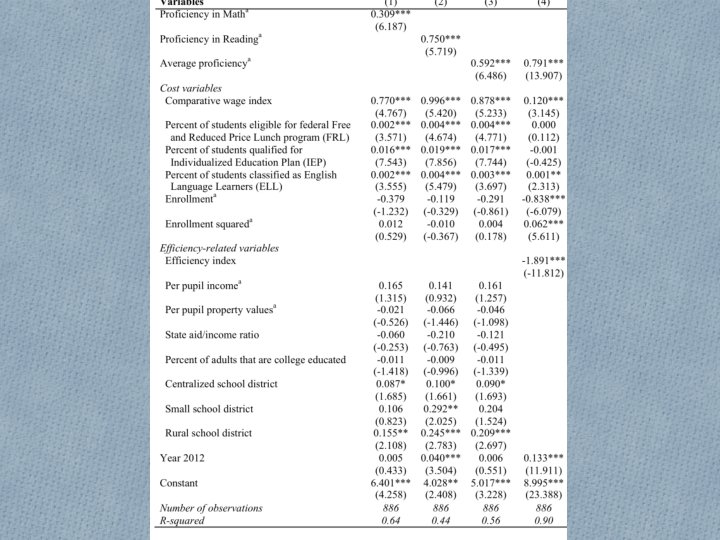
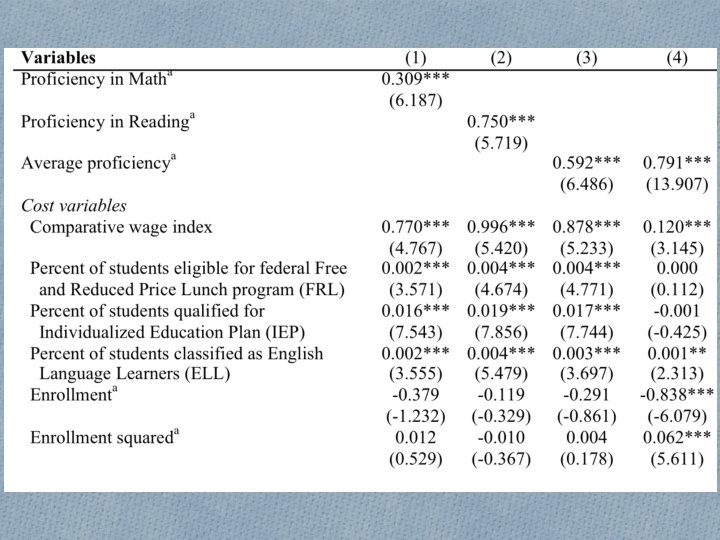
Data and Methods O Cost function model and variables O E=f(P, R, St, Ef) where: O E = Per pupil operating expenditures O P = Student performance (% attaining proficiency in math and reading, treated as endogenous) O R = Resource costs (Comparable Wage Index) O St = Student and family characteristics (enrollment, enrollment squared, FRL, ELL, IEP)
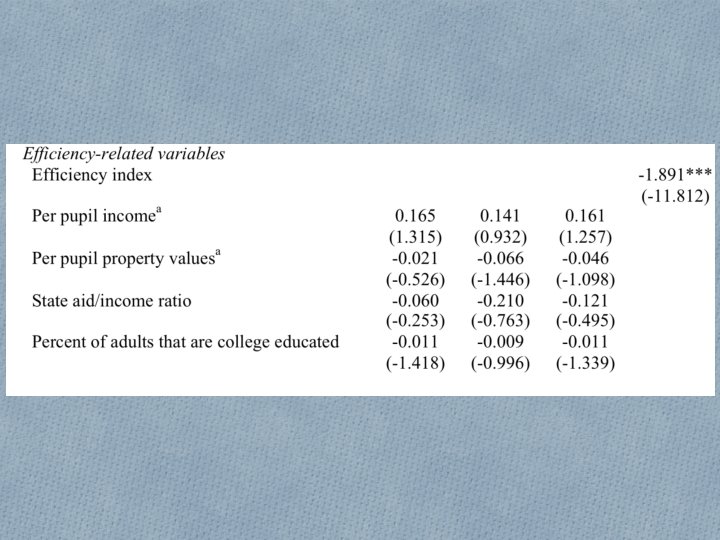
Data and Methods O Cost function model and variables (cont’d) O E=f(P, R, St, Ef) where: O Ef = Efficiency O Income, property value, aid/income ratio, education (proportion of bachelors or higher), district type – large urban, small centralized, rural, small enrollment O Efficiency index (DEA)
Conclusions and Next Steps O Current Nevada school finance system does not formally account for student characteristics and in fact directs money away from school districts with the highest needs (Clark and Washoe). O Suggests that at-risk students require additional funding to achieve
Conclusions and Next Steps O Next steps: O Refine model. O Estimate model using spatial econometric techniques O Calculate Cost Indices and make recommendations O Add to dataset