
Addressing Deer Vehicle Accidents at the Community Scale
- Slides: 33
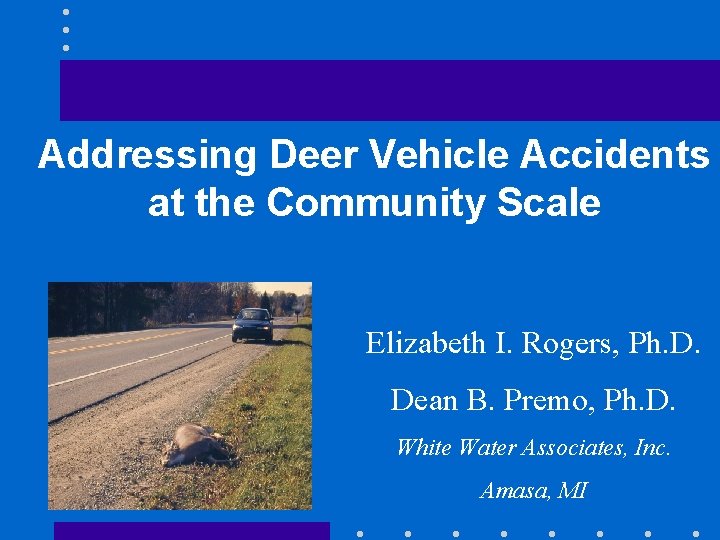
Addressing Deer Vehicle Accidents at the Community Scale Elizabeth I. Rogers, Ph. D. Dean B. Premo, Ph. D. White Water Associates, Inc. Amasa, MI
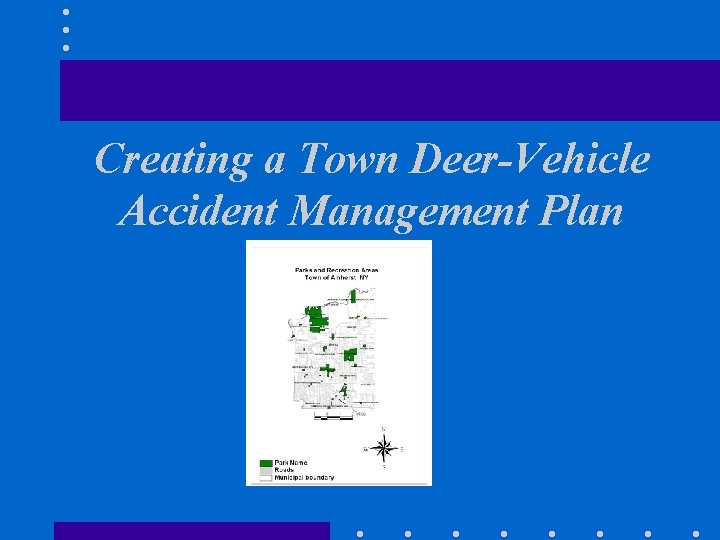
Creating a Town Deer-Vehicle Accident Management Plan
Project Goals • Use the existing GIS project to understand deer-vehicle accident patterns • Create a deer-vehicle accident management plan • Assess data collection and monitoring needs for the future
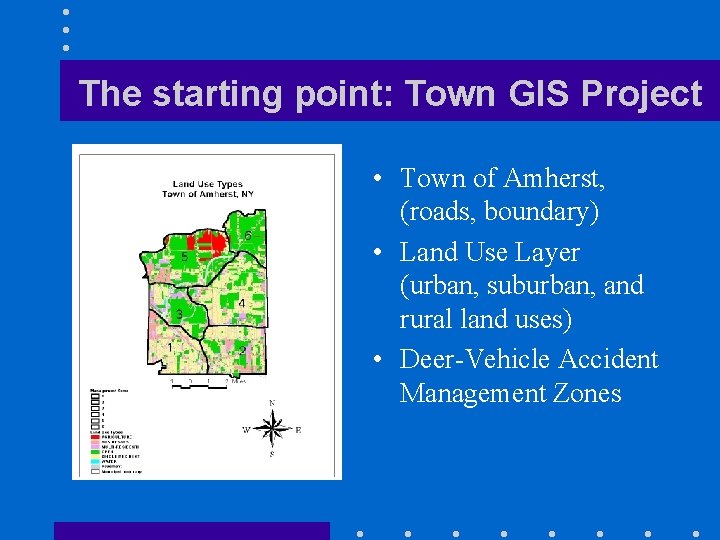
The starting point: Town GIS Project • Town of Amherst, (roads, boundary) • Land Use Layer (urban, suburban, and rural land uses) • Deer-Vehicle Accident Management Zones
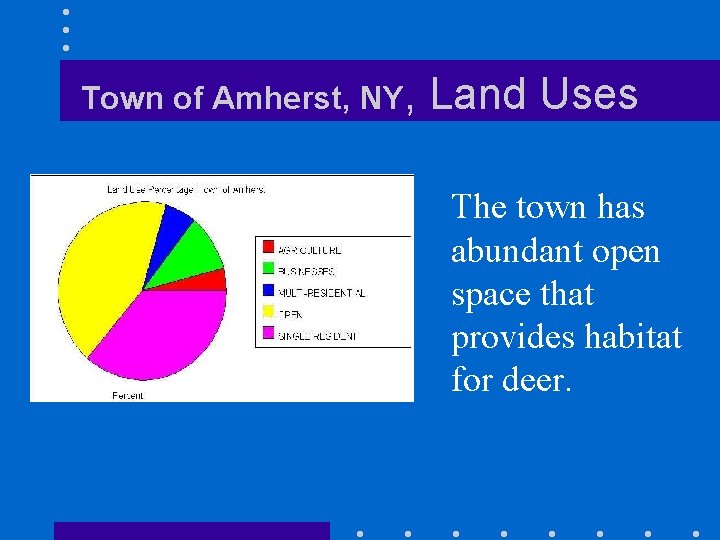
Town of Amherst, NY, Land Uses The town has abundant open space that provides habitat for deer.
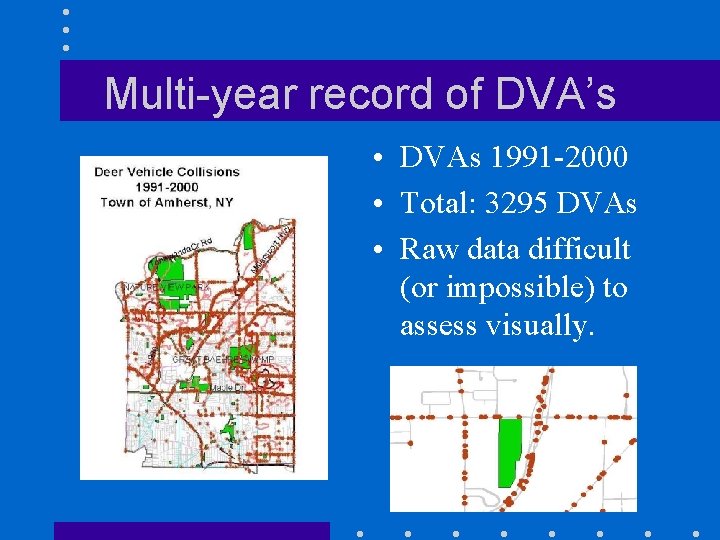
Multi-year record of DVA’s • DVAs 1991 -2000 • Total: 3295 DVAs • Raw data difficult (or impossible) to assess visually.
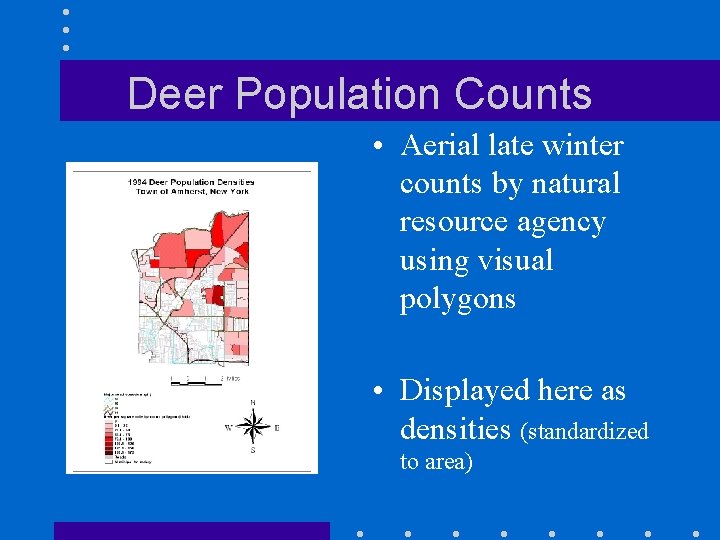
Deer Population Counts • Aerial late winter counts by natural resource agency using visual polygons • Displayed here as densities (standardized to area)
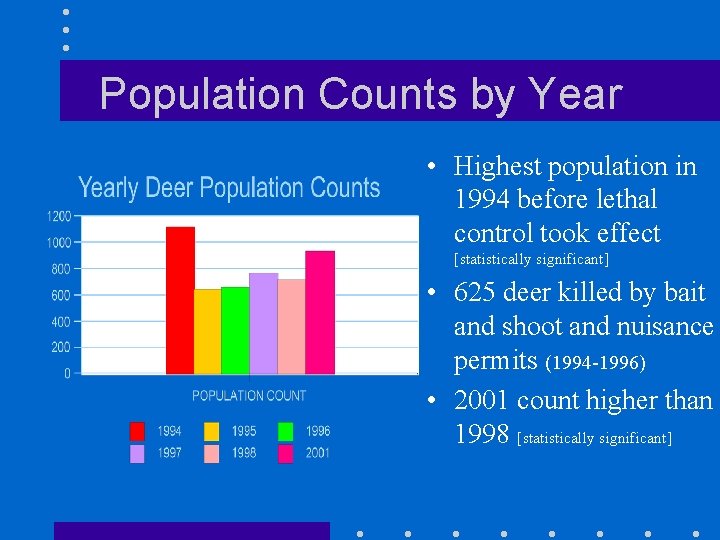
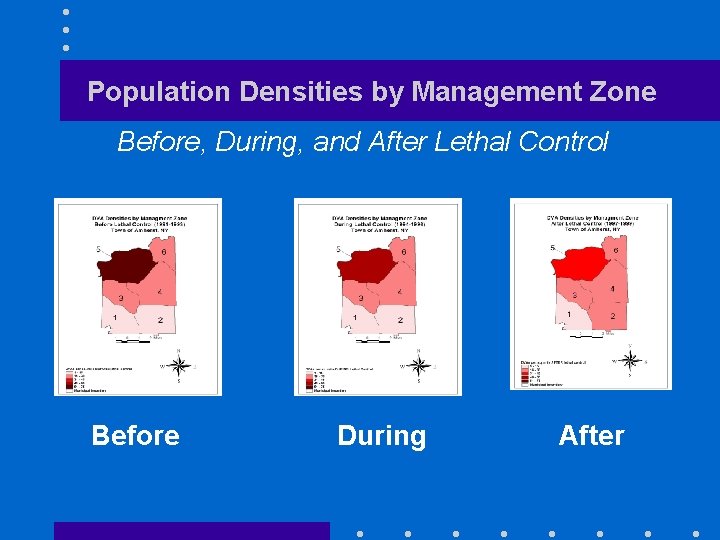
Population Counts by Year • Highest population in 1994 before lethal control took effect [statistically significant] • 625 deer killed by bait and shoot and nuisance permits (1994 -1996) • 2001 count higher than 1998 [statistically significant]
Population Densities by Management Zone Before, During, and After Lethal Control Before During After
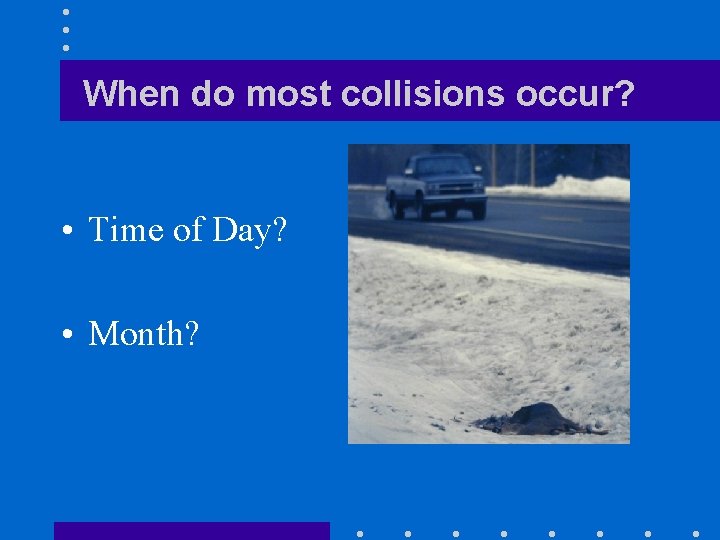
When do most collisions occur? • Time of Day? • Month?
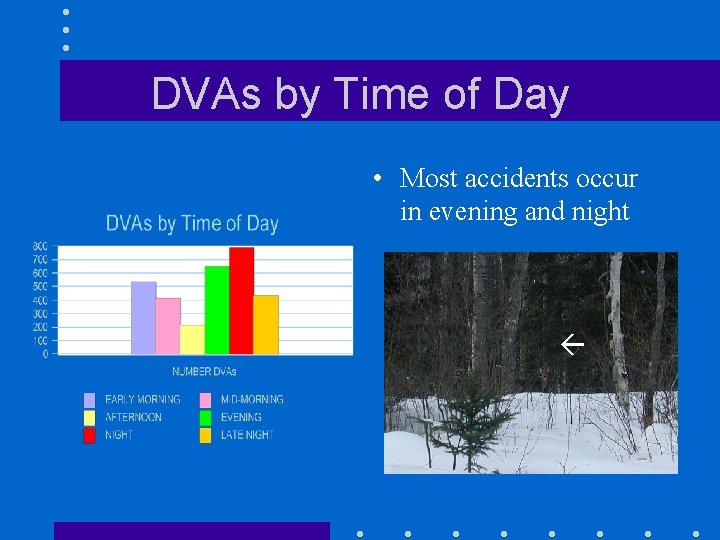
DVAs by Time of Day • Most accidents occur in evening and night
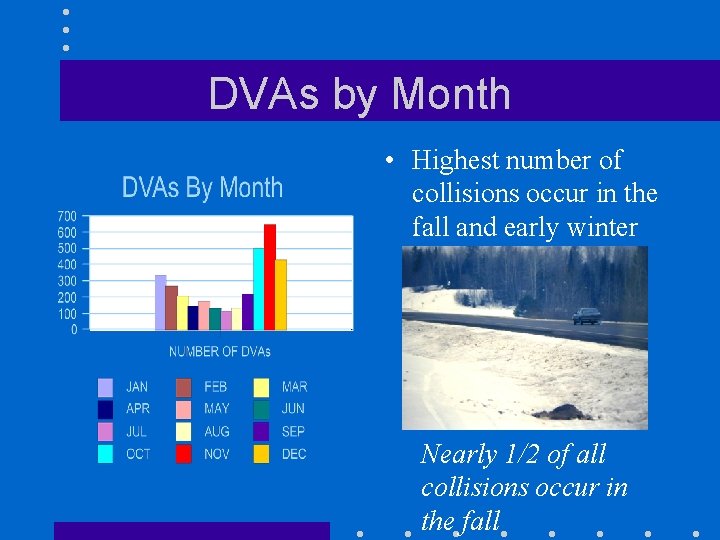
DVAs by Month • Highest number of collisions occur in the fall and early winter Nearly 1/2 of all collisions occur in the fall
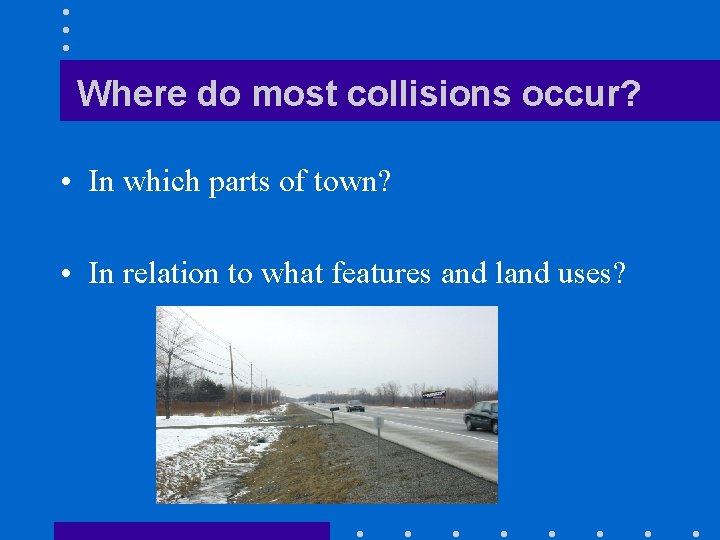
Where do most collisions occur? • In which parts of town? • In relation to what features and land uses?
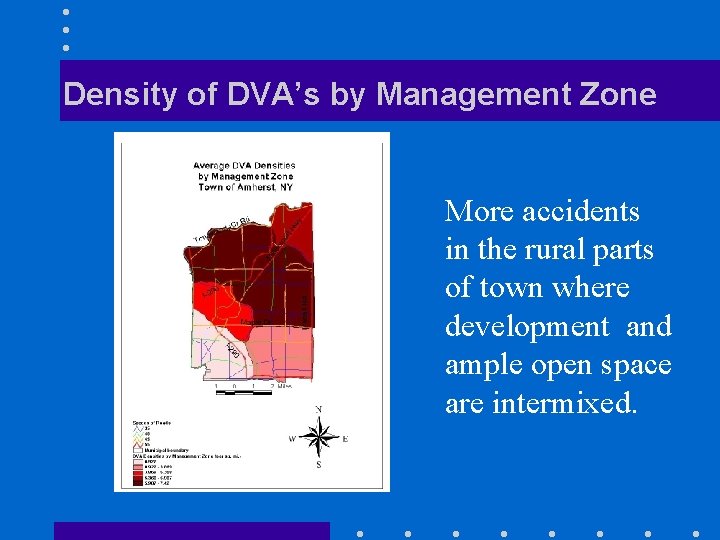
Density of DVA’s by Management Zone More accidents in the rural parts of town where development and ample open space are intermixed.
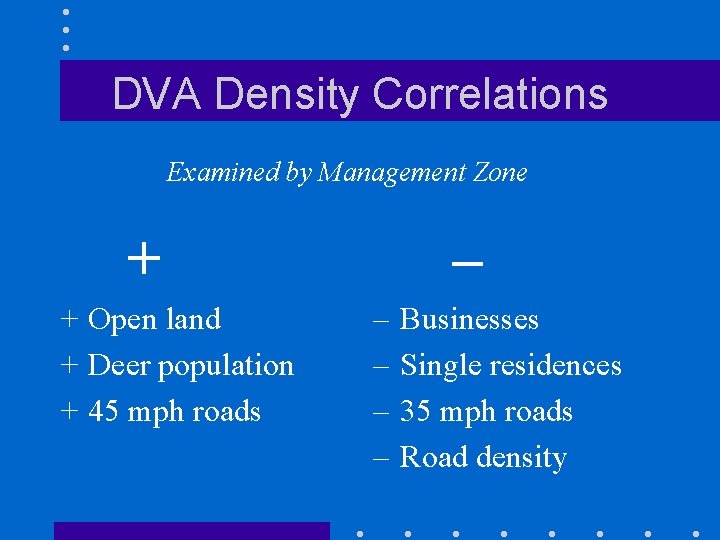
DVA Density Correlations Examined by Management Zone + + Open land + Deer population + 45 mph roads – – – Businesses Single residences 35 mph roads Road density
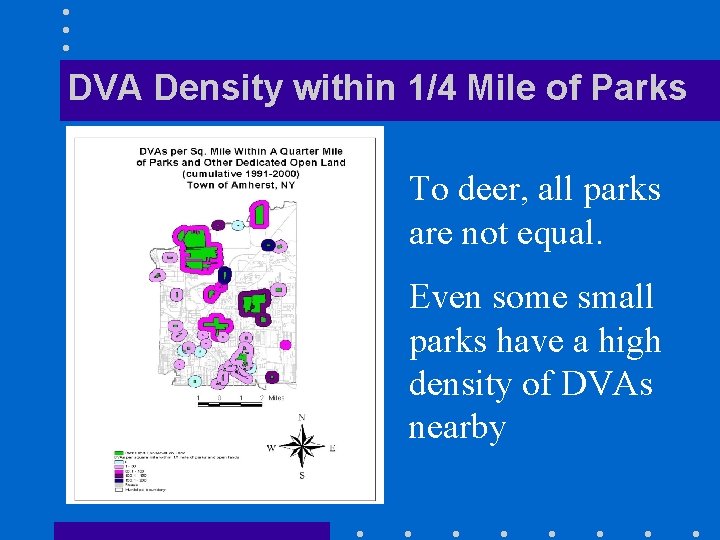
DVA Density within 1/4 Mile of Parks To deer, all parks are not equal. Even some small parks have a high density of DVAs nearby
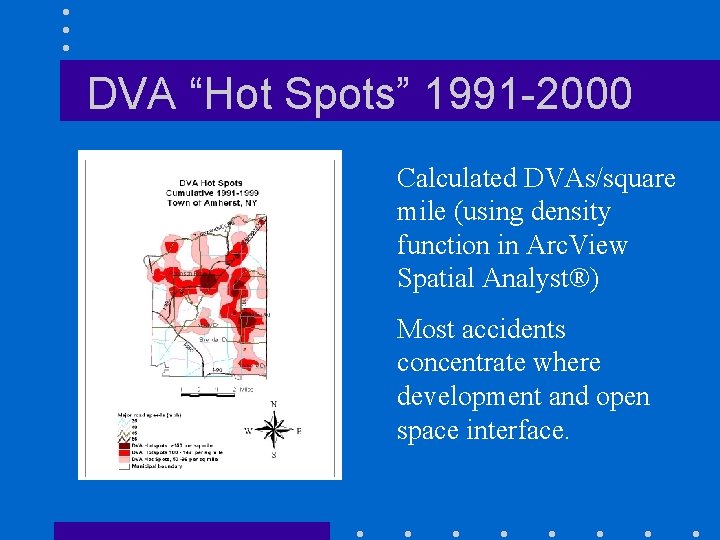
DVA “Hot Spots” 1991 -2000 Calculated DVAs/square mile (using density function in Arc. View Spatial Analyst®) Most accidents concentrate where development and open space interface.
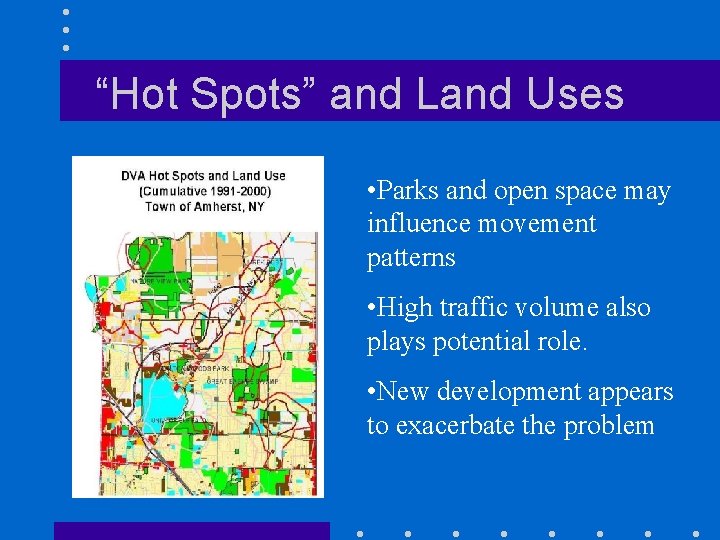
“Hot Spots” and Land Uses • Parks and open space may influence movement patterns • High traffic volume also plays potential role. • New development appears to exacerbate the problem
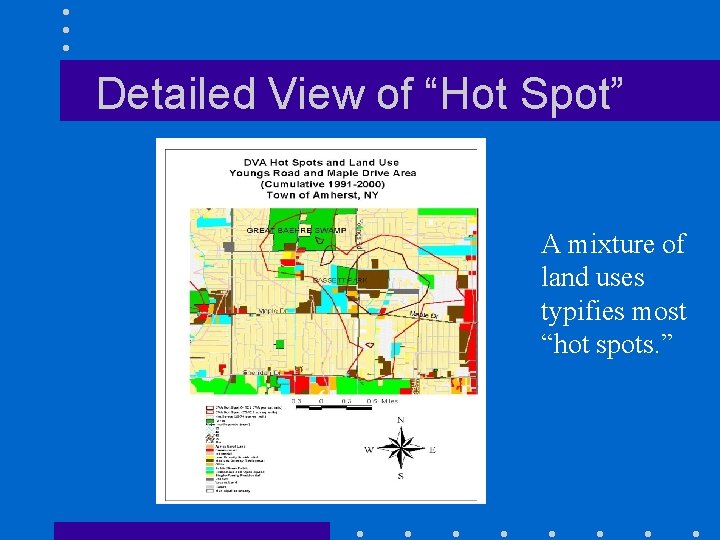
Detailed View of “Hot Spot” A mixture of land uses typifies most “hot spots. ”
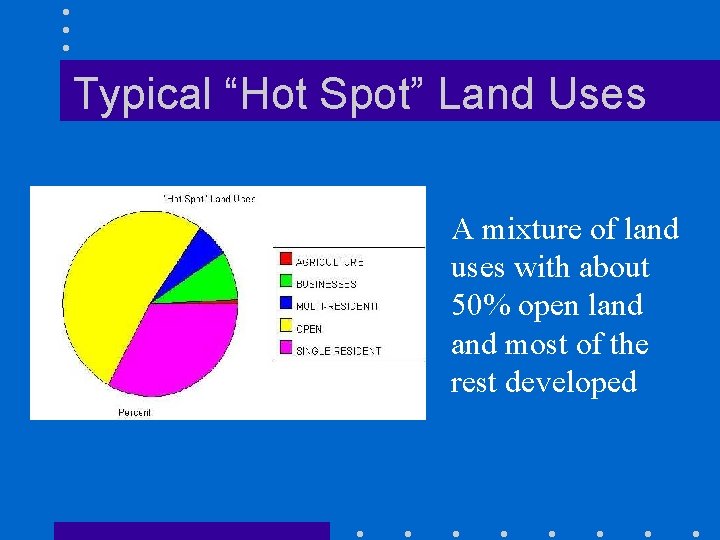
Typical “Hot Spot” Land Uses A mixture of land uses with about 50% open land most of the rest developed
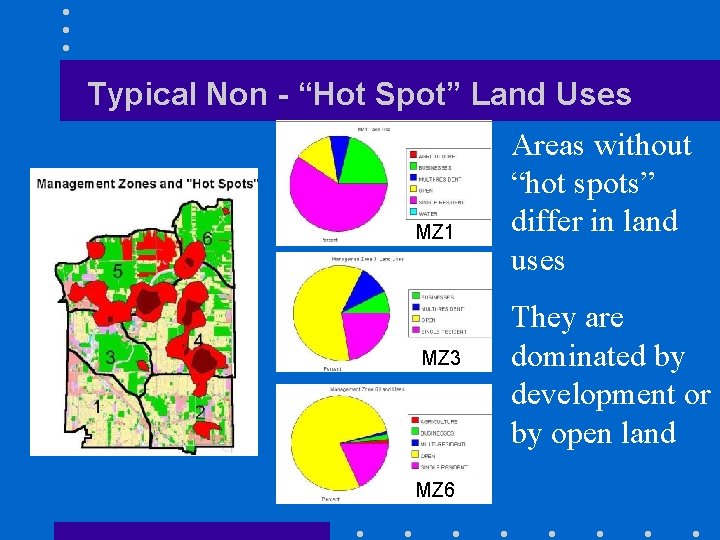
Typical Non - “Hot Spot” Land Uses MZ 1 MZ 3 MZ 6 Areas without “hot spots” differ in land uses They are dominated by development or by open land
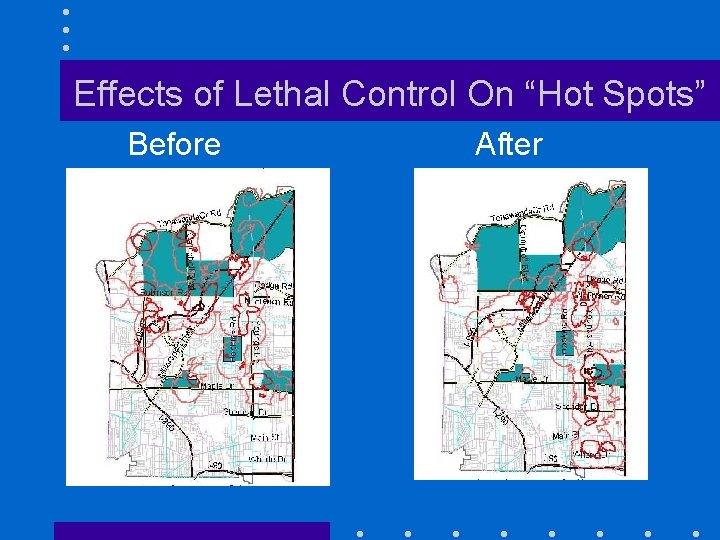
Effects of Lethal Control On “Hot Spots” Before After
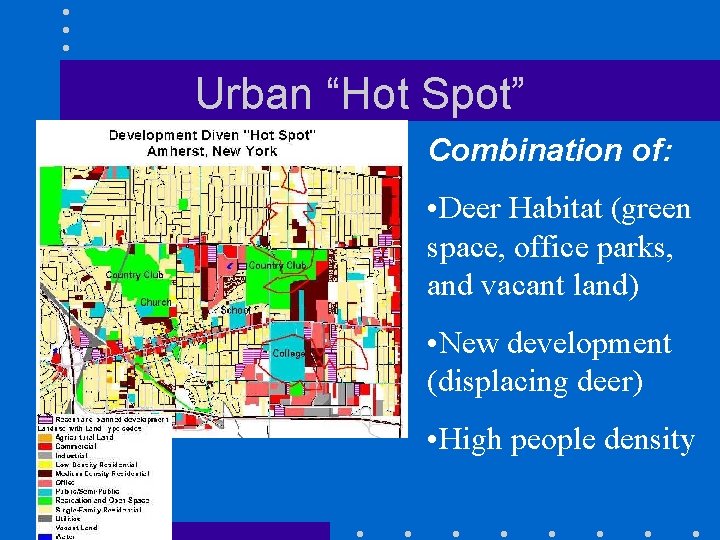
Urban “Hot Spot” Combination of: • Deer Habitat (green space, office parks, and vacant land) • New development (displacing deer) • High people density
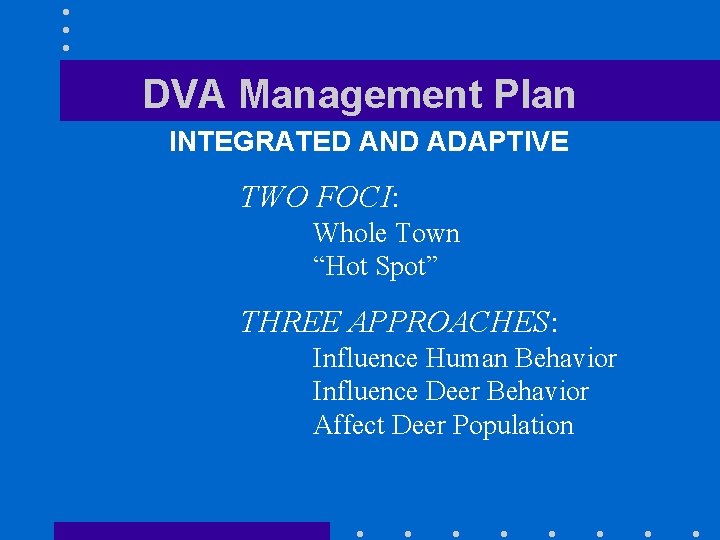
DVA Management Plan INTEGRATED AND ADAPTIVE TWO FOCI: Whole Town “Hot Spot” THREE APPROACHES: Influence Human Behavior Influence Deer Behavior Affect Deer Population
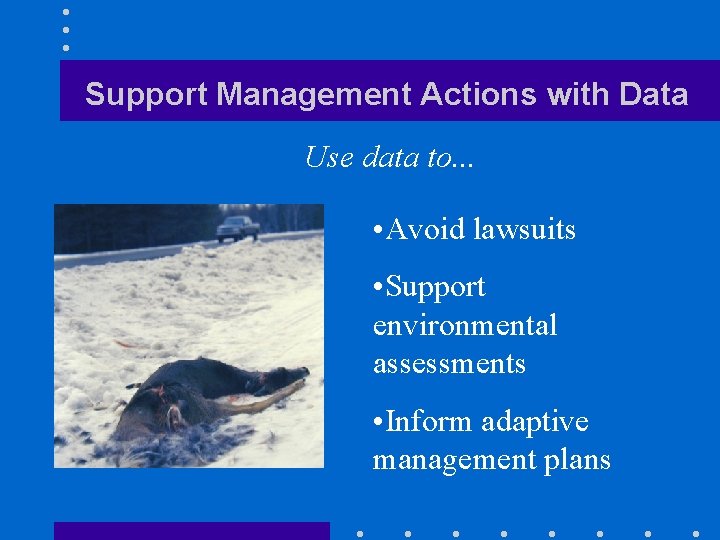
Support Management Actions with Data Use data to. . . • Avoid lawsuits • Support environmental assessments • Inform adaptive management plans
Whole Town Focus • Public education (press releases, pamphlets, posters) • Drivers’ education • Enforce or enact “no deer feeding” laws • Encourage use of nuisance permits • If needed, enact professional lethal control
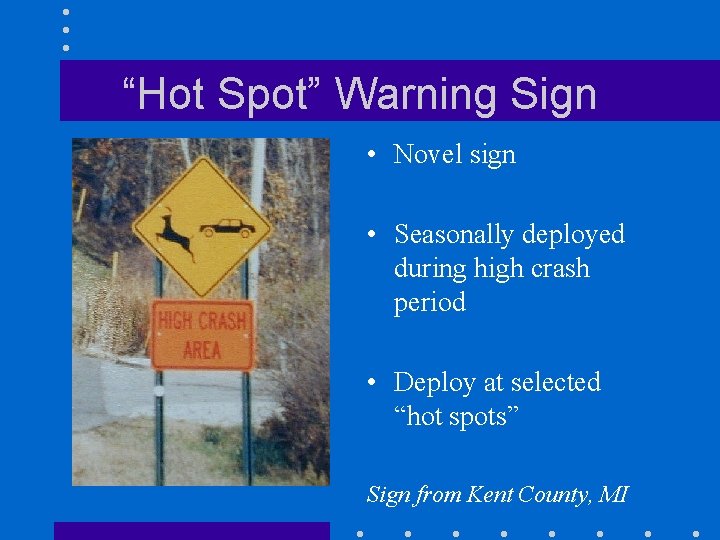
“Hot Spot” Focus • Deploy seasonal warning signs • Facilitate press and media coverage of sign deployment and “hot spots” • Enforce speed limits in areas of “hot spots” • Fence and/or improve roadside visibility with brushing at selected corridor “hot spots”
Management Zones Facilitate Implementation
“Hot Spot” Warning Sign • Novel sign • Seasonally deployed during high crash period • Deploy at selected “hot spots” Sign from Kent County, MI
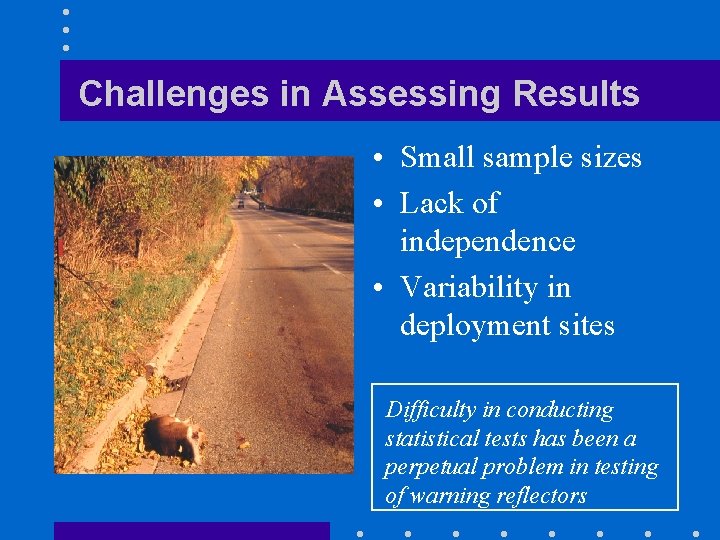
Challenges in Assessing Results • Small sample sizes • Lack of independence • Variability in deployment sites Difficulty in conducting statistical tests has been a perpetual problem in testing of warning reflectors
Information Wish List • DVA database for theme Georeferenced Driver data (age, gender) Time (24 hours, date) • Road (type, speed limit) • Land use (including potential deer habitat) • Development locations • Natural features (streams, lakes, hills) • Deer population counts or estimates
Monitoring Suggestions • Need ongoing multi-year data on deer populations and DVAs • Summarize changes in patterns with GIS spatial analysis • Visually examine changes in locations and intensities of “hot spots” • Statistically test for significant changes in DVA and population numbers when possible • Monitor health of vegetation in parks
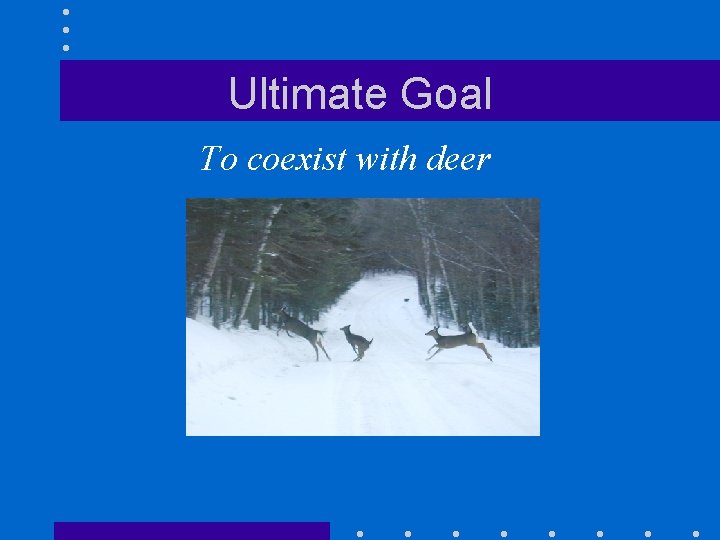
Ultimate Goal To coexist with deer