Adaptationism and the Adaptive Landscape Genomic imprinting mathematical


- Slides: 31

Adaptationism and the Adaptive Landscape Genomic imprinting, mathematical models, and notions of optimality in evolution

Overview • Adaptationism • Zoom and Grain in the adaptive landscape • Mathematical models of genomic imprinting

Adaptationism • Primary role for natural selection in evolution – versus drift, historical and developmental constraints, etc. • Modern debate framed by the Sociobiology wars (Wilson, Dawkins, Lewontin, Gould, etc. ) • Continuation with Evolutionary Psychology, but • Partial reconciliation in most fields – Tests of selection, contemporary systematics

Types of adaptationism • Empirical – Central causal role for selection • Explanatory – Selection answers the big questions • Methodological – Selection is a good organizing concept – Godfrey-Smith (2001)

The Adaptive Landscape • Natural selection is conceived of as a hillclimbing algorithm

Caveats • Units (genotype vs. phenotype, population vs. individual fitness) • High dimensionality • Topology of the landscape • Dependence on other organisms • Hill-climbing metaphor implies a deterministic process

Zoom level 1 • High level analyses invoke rugged landscapes, which emphasize the role of historical contingency

Zoom level 2 • Intermediate levels of analysis focus on local regions with a small number of peaks, emphasizing optimization

Zoom level 3 • Low-level analyses reveal the discontinuities in the fitness landscape, emphasizing drift, recombination, etc.

Zoom level 3 • Low-level analyses reveal the discontinuities in the fitness landscape, emphasizing drift, recombination, etc.

Sickle-cell anemia • Hb. A / Hb. A Resistant parents – Susceptible • Hb. A / Hb. S – Resistant • Hb. S / Hb. S – Sickle-cell Susceptible Resistant Sickle-cell

Population-genetic timescale Hb. A / Hb. S Hb. A / Hb. A Hb. S / Hb. S ~100 generations • Mendelian segregation recreates sub-optimal phenotypes every generation

Mutation timescale Hb. A + Hb. S Hb. A ~104 generations • The mutation giving rise to the Hb. S allele represents a partial adaptation to malaria

Chromosomal rearrangement timescale Hb. AS Hb. A + Hb. S Hb. A ~108 generations • A (hypothetical) rearrangement could give rise to a single chromosome containing both the Hb. A and Hb. S alleles. This new allele should sweep to fixation.

Immune-system evolution timescale Ig. M Ig. A Ig. G Ig. E Hb. AS Ig- Hb. A + Hb. S Hb. A ~1010+ generations • In principle, we could ask why our immune system is susceptible to malaria at all.

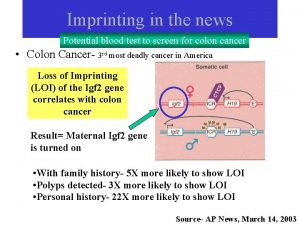
Genomic Imprinting • Non-equivalence of maternal and paternal genomes • Normal development in mammals requires both

Genomic Imprinting • Epigenetic differences result in differences in expression Oogenesis gene 1 gene 2 Spermatogenesis gene 1 • DNA methylation – reversible chemical modification of the DNA gene 1 gene 2

Reciprocal heterozygotes are non-equivalent ≠

Conflict over resources

Inclusive fitness Asymmetries in relatedness Maternal optimum Paternal optimum Fitness increases as more resources are acquired for self Fitness decreases as cost to siblings becomes too great Growth factor expression level

Conflict over resources Maternal expression Growth-enhancing locus Unimprinted gene Cis-acting maternal modifiers Maternal optimum Paternal expression Cis-acting paternal modifiers

Conflict over resources Maternal expression Growth-suppressing locus Unimprinted gene Cis-acting maternal modifiers Paternal optimum Maternal optimum Paternal expression Cis-acting paternal modifiers

Game-theoretic / stability analysis models of imprinting • • X - expression level Wm - matrilineal fitness Wp - patrilineal fitness U - individual fitness V - fitness of other offspring G - resource demand C - cost of gene expression 2 p - fraction of mother’s offspring with the same father Growth enhancer:

Population-genetic models • Two sibs, paternal imprinting • Fitness of unimprinted sibs: 1 – e. g. , AA • A - unimprinted allele • a - imprintable allele • a = A when maternally inherited • a -> (a) when paternally inherited • • AA = a. A a(a) = A(a) • Fitness if both imprinted: 1+u – e. g. , a(a), A(a) • If only one is imprinted: – e. g. , AA & A(a) – Imprinted fitness: 1 -s for A(a) – Unimprinted fitness: 1+t for AA

Population-genetic models • Parameters: allele frequencies, fitnesses, frequency of multiple paternity – Spencer, Feldman, and Clark 1998 Genetics

Population-genetic models • Two sibs, paternal imprinting • Fitness of unimprinted sibs: 1 – e. g. , AA • A - unimprinted allele • a - imprintable allele • a = A when maternally inherited • a -> (a) when paternally inherited • • AA = a. A a(a) = A(a) • Fitness if both imprinted: 1+u – e. g. , a(a), A(a) • If only one is imprinted: – e. g. , AA & A(a) – Imprinted fitness: 1 -s for A(a) – Unimprinted fitness: 1+t for AA • Monandrous females: – a invades A if u > s – a stable if u > t/2 • Polyandrous females: – a invades A if s < 0 – a stable if u > t/2

Predictions and contradictions • Game-theoretic • Population-genetic • Imprinting requires multiple paternity (p < 1/2) • Allele favoring lower expression will be completely silenced • Particular combinations of s, t, and u can produce stable polymorphisms • Multiple paternity is not required • Maternal silencing for growth enhancers is more likely, but paternal silencing can occur – maternal silencing of growth enhancers – paternal silencing of growth suppressors

Paternally silenced growth enhancer Maternal expression Growth-enhancing locus Unimprinted gene Reduced paternal expression would be favored from these points Maternal optimum Paternal expression Cis-acting maternal modifiers Cis-acting paternal modifiers

Key assumption • Game-theoretic models assume that the unimprinted expression level is at its optimum before the introduction of an imprinted allele • Is this assumption a good one? • Gene expression array analyses of population-level variation reveal a high level of variation • This implies a good opportunity for selection to find the optimum

Separation of timescales in the evolution of imprinting Imprinting opens up a new dimension in strategy space Unimprinted alleles are restricted to a subspace in the fitness landscape If mutations that quantitatively change gene expression are much more common than those that give rise to imprinting, imprinting will always arise in the context of an optimized expression level

Take-home message • Choice of a particular modeling framework implies certain assumptions that can affect your interpretation of your results • When smart people doing reasonable things disagree, there is probably something interesting going on
 Genomic imprinting definition
 Sitcr
Sitcr Imprint definition psychology
 Barovo telo
 Proximate cause and ultimate cause
 Genomik imprinting
 Principle of genomic equivalence
 Genomic england
 Genomic england
 Anneke seller
 Genomic instability
 Genomic
 Genomic signal processing
 Comparative genomic hybridization animation
 Genomic equivalence definition
 Non mathematical economics
 Hình ảnh bộ gõ cơ thể búng tay
 Slidetodoc
 Bổ thể
 Tỉ lệ cơ thể trẻ em
 Gấu đi như thế nào
 Tư thế worm breton
 Chúa sống lại
 Môn thể thao bắt đầu bằng chữ đua
 Thế nào là hệ số cao nhất
 Các châu lục và đại dương trên thế giới
 Cong thức tính động năng
 Trời xanh đây là của chúng ta thể thơ
 Cách giải mật thư tọa độ
 Phép trừ bù
 độ dài liên kết
 Các châu lục và đại dương trên thế giới
