Acuity Measurement Basic Visual Fields Andrew Miller Lead

Acuity Measurement Basic Visual Fields Andrew Miller Lead Optometrist Focus Birmingham

Introduction • A lot to fit in, apologies • Morning – Acuity – Visual Fields Testing • Afternoon – Understanding Spectacle Prescriptions – Little About Low Vision Assessment

Distance Vision/Visual Acuity • • • Measures maximal spatial resolution Tells us what people can see in the distance! Core Measurement Easy to take, but many ways to do it. . . – – 6/60 20/200 1. 00 log. MAR 0. 1 • Snellen • Decimal notation • log. MAR

Snellen • In 1862 Dr Herman Snelling introduced a chart made of letters on a 5 x 5 grid • “Normal vision” is defined as being able to resolve a letter of 5 minutes of arc at 6 m distance. • Common usage

Snellen is represented by a fraction E. g. 6/6 6/24 The top number tells us the testing distance The Bottom number tells us how much bigger (or further away)the letter was than the standard letter • Arithmetic Scale • • – So the 6/12 letter is twice as big as the 6/6 – The 6/18 is half the size of the 6/36 – 3/60 is equivalent of 6/120

Snellen Around the World • Americans still use feet and inches • Therefore 6 m becomes 20 ft • 6/6 becomes 20/20 • Europeans commonly use a decimal notation. • They simply convert the Snellen fraction into a decimal – – – 6/6 6/12 6/60 = 1. 0 = 0. 5 = 0. 1

Snellen Pros • • Quick Used a lot Reasonably well understood Often what people quote even if they have measured acuity in a different way Cons • Aimed at fully sighted people • Large Gaps at lower acuity bands • Too few letters at the top of the chart • Depressing for low vision patients • Uneven Crowding • Not reproducible? • How do I measure 6/48 • What if acuity is less than 6/60?

log. MAR and ETDRS Chart log. MAR is what I use! Chart is logarithmic Needs some mental arithmetic Or a calculator!

log. MAR and ETDRS Chart How does it work? Test at 4 m Every line has a value. Top line is 1. 00 Every line lower the value DECREASES by 0. 1. Second row 0. 9 Third row 0. 8 If get every letter right you score the value for the line.

log. MAR and ETDRS Chart For every letter you get wrong you add 0. 02 to the value of the line e. g. if you read 2 letters wrong on the 0. 90 line your log. MAR value is 0. 90 + 0. 02 = 0. 94 log. MAR If you cannot read the chart at 4 m you test at half the distance and add 0. 30 to your score

log. MAR Pro Con Linear Progression • Even Gaps • Even Crowding Greater range of acuity levels Better subjective measurement • • Can calculate per letter Much more accurate for determining low vision • Better for seeing if your interventions have worked • Patients feel happy they can read something • Letters even legibility • • Needs more knowledge People often don’t understand your result Takes longer Harder with kids?

Idiot’s Guide? Poor Acuity Good Acuity Snellen 6/60 6/6 Decimal 0. 1 1. 0 log. MAR 1. 00 log. MAR 0. 00 log. MAR Low Value High Value Snellen GOOD BAD Decimal BAD GOOD log. MAR GOOD BAD

Does Acuity Tell Us Everything? • VA tells us a very specific piece of information and does not give the whole picture • Other Measurements We Should Be Aware of when assessing Visual Function – CSF – Visual Fields – Accommodation – Colour vision – Reading speed/acuity

Contrast Sensitivity Function Loss • CSF measures how well you see when contrast falls. • Optic Nerve lesion or lens opacity often leaves CSF reduced. • Causes – Difficulty reading packaging – Problems seeing kerbs – Problems seeing gradients

Contrast Sensitivity Function Loss • Various Ways of Measuring Contrast Sensitivity

CSF what can you do? • CHANGE THE CONTRAST – Use Higher Contrast – Contrasting Backgrounds – Paint Stair Edges – Bold Pens – Electronic enhancement • Improve Lighting • Magnification Not Helpful

Visual Fields Andrew Miller MSc MCOptom

Introduction • • • What are visual fields Methods of Field Testing Fields and low vision assessments What Does it Mean to the Patient Action Points Conclusions

Normal Visual Fields • The field of vision is defined as the area that is perceived simultaneously by a fixating eye. The limits of the normal field of vision are 60° into the superior field, 75° into the inferior field, 110° temporally, and 60° nasally. • Harry Moss Traquair (1875 -1954) "an island of vision or hill of vision surrounded by a sea of blindness".

Hill of Vision

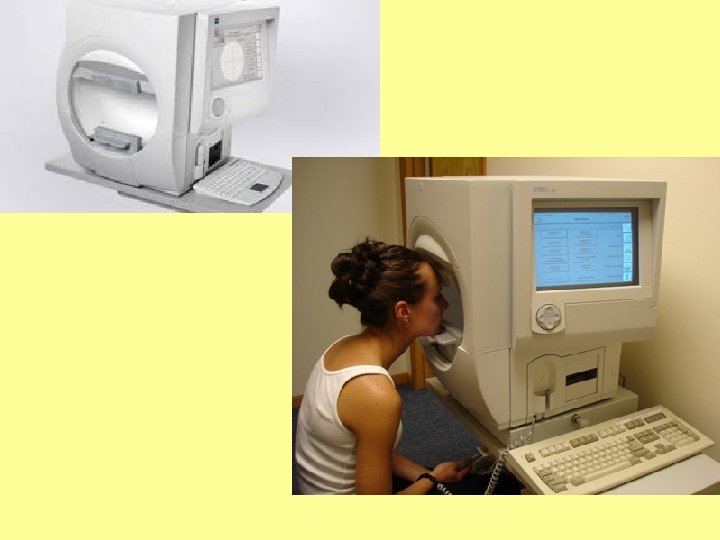
Testing Visual Fields • Visual Fields assess the height and extent of the hill of vision • Different Methods – Static – Kinetic • Formal – Goldmann – Humphrey – Henson • Informal – Amsler – Confrontation – Observation

Static Testing • Size and location of the test target remain constant. � The shape of the island is defined by repeating a threshold measurement at various locations in the field of vision � Retinal sensitivity at a specific location is determined by varying the brightness of the test target. • Either – Full Threshold (accurate/slower) – Supra Threshold (screening/quicker)

Static Testing- full threshold JODY R. PILTZ-SEYMOUR, ONECA HEATH-PHILLIP and STEPHEN M. DRANCE

Results from Static Perimetry • Full Threshold

Static Testing- Supra threshold

Results from Static Perimetry • Supra Threshold

Kinetic Fields • Stimulus moved from a non-seeing area of the visual field to a seeing area along a set meridian. • Repeated along other meridians, usually spaced every 15°. • In kinetic perimetry, one attempts to find locations in the visual field of equal retinal sensitivity. • Lines joining points of equal sensitivity called isopter. • Change luminance and the size of the target is changed to plot other isopters.
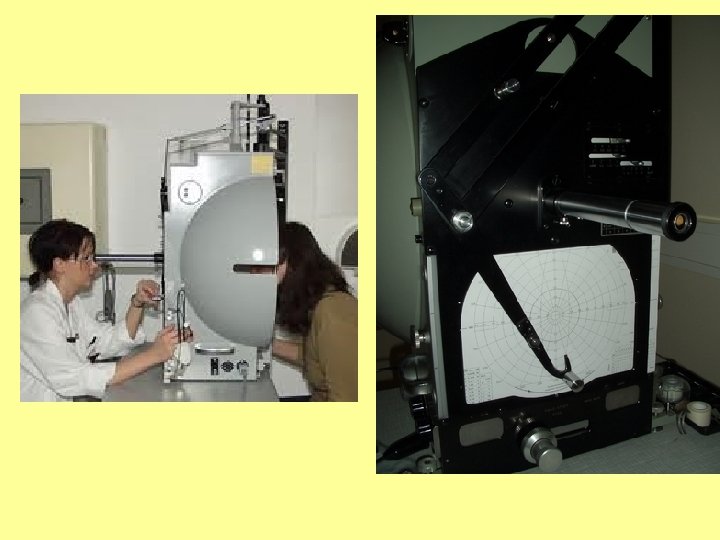

Results From Kinetic Perimetry

Differences • In kinetic perimetry, the island of vision is approached horizontally. Isopters can be considered the contour lines on the hill of vision • Static approached vertically • Static automated more easily • Kinetic better with poorer acuity?

Informal Fields Testing • Confrontation Testing • Amsler Grid • Observation

Scottish Sensory Centre

Pros and Cons Pros Cons Easy to get it wrong Simple Too Simple Can be done at school Not quantifiable

Fields and Low Vision • I use the Esterman test – 120 targets – Wide test arc (160 degrees horizontally) – Targets are bright – Test is done binocularly – Static Test – Pt. watches fixation light – Pt. press button when light seen • Gives a real world view of the pattern of greatest loss

Plot example

Symptoms of Field loss • Assumption – “Black in centre of vision” – “Just turn your head more” • Reality – Simulation specs are poor – Fields Loss often not well self reported – Hard to Judge where field loss starts and finishes

FIELD LOSS • You “don’t know what you can’t see” • Sim Specs are not real Life • Action – Counselling (orientation awareness) – Mobility Training

Loss of Fields : Symptoms and Case Study 82 year old man Stroke 2 years ago. Seen hospital “nothing could be done” Stroke has given dad a problem with his left eye. Son noticed dad very withdrawn since moving to a new residential home. • Staff saying he is only interested in the television and ignores people. • • •

Field Plot

Field Plot

Field Loss • Field loss causes the problems we suspect. – Tripping – Falling over – Fear – Isolation • But not necessarily the symptoms we expect
- Slides: 42