
Actually Doing Technology Product Strategy Outline l l


- Slides: 87
Actually Doing (Technology & Product) Strategy
Outline: l l l Why do I need an innovation strategy? How will we create value? How will we capture value? How will we deliver value? Doing strategy in practice
Agenda l Why making choices is so important • (and so hard) l What can be done
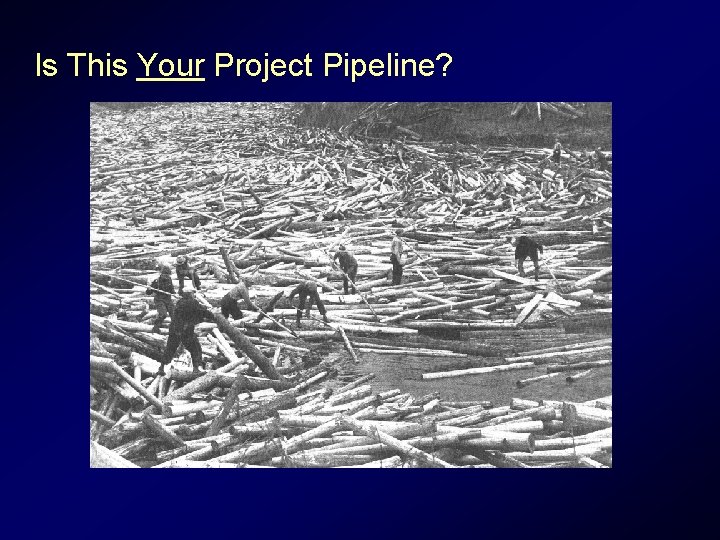
Is This Your Project Pipeline?
Why is it so hard to kill project #26? l It’s a “good” project! – – – It meets NPV, ROI goals An important customer wants it The CEO/my boss wants it It’s Frank’s project It might be the project that saves my bacon Good managers can meet stretch goals I’m a good manager) l Making difficult decisions takes time and eats energy l (and
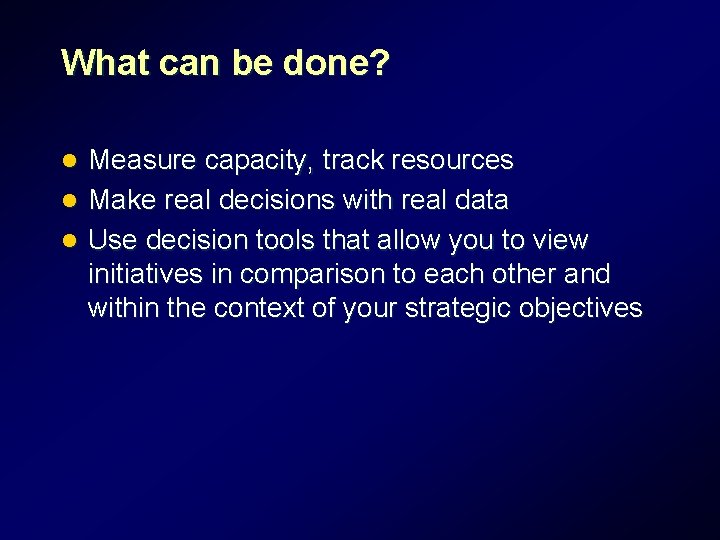
What can be done? Measure capacity, track resources l Make real decisions with real data l Use decision tools that allow you to view initiatives in comparison to each other and within the context of your strategic objectives l
Measure capacity, track resources
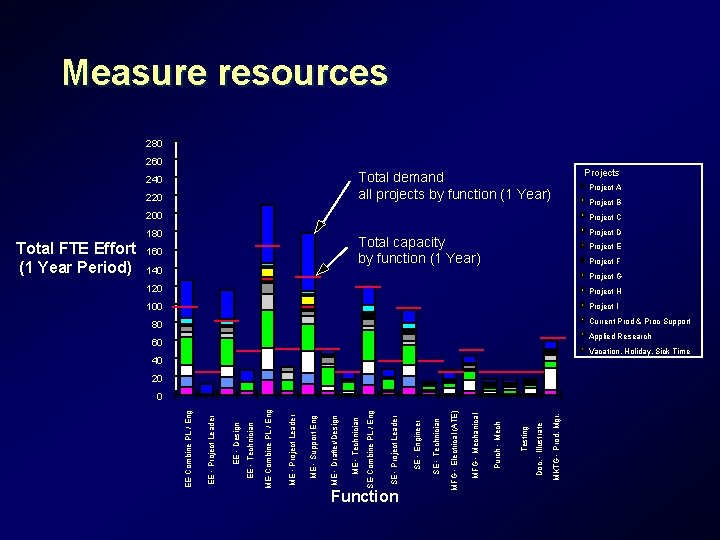
Measure resources 280 260 Projects Total demand all projects by function (1 Year) 240 220 Project A Project B 200 Project C 180 160 140 Project E Project F Project G 120 Project H 100 Project I Current Prod & Proc Support 80 Applied Research 60 Vacation, Holiday, Sick Time 40 20 MKTG - Prod. Mgr. Doc. - Illustrate Testing Purch - Mech MFG - Mechanical SE - Technician MFG - Electrical (ATE) Function SE - Engineer SE - Project Leader SE-Combine PL / Eng ME - Technician ME - Drafter/Design ME - Support Eng ME - Project Leader ME-Combine PL / Eng EE - Technician EE - Design EE - Project Leader 0 EE-Combine PL / Eng Total FTE Effort (1 Year Period) Project D Total capacity by function (1 Year)
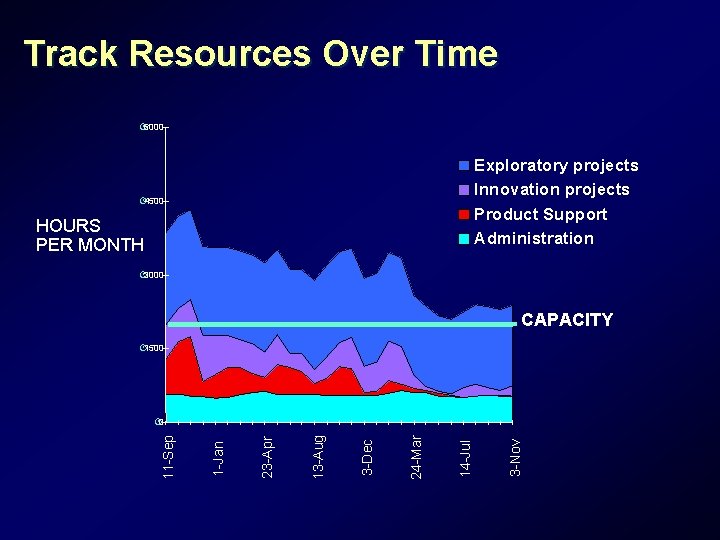
Track Resources Over Time · 6000 Exploratory projects Innovation projects Product Support Administration · 4500 HOURS PER MONTH · 3000 CAPACITY · 1500 3 -Nov 14 -Jul 24 -Mar 3 -Dec 13 -Aug 23 -Apr 1 -Jan 11 -Sep · 0
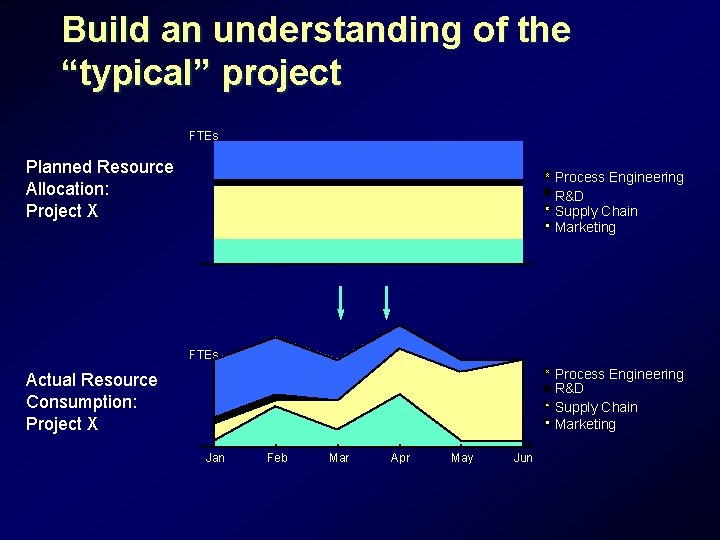
Build an understanding of the “typical” project FTEs Planned Resource Allocation: Project X Process Engineering R&D Supply Chain Marketing FTEs Process Engineering R&D Supply Chain Marketing Actual Resource Consumption: Project X Jan Feb Mar Apr May Jun
Making real decisions with real data
Technology Strategy in Practice Strategies are worthless unless they are linked to real resource allocation decisions l Decide l – – – Who will make the decisions How often By what criteria
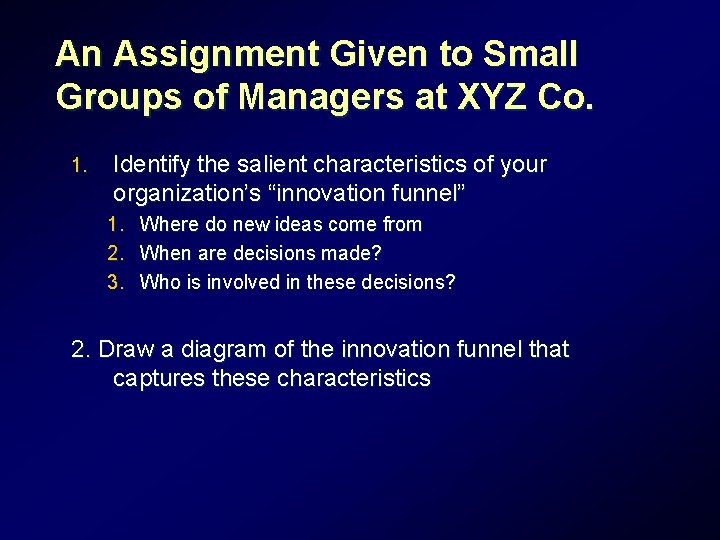
An Assignment Given to Small Groups of Managers at XYZ Co. 1. Identify the salient characteristics of your organization’s “innovation funnel” 1. 2. 3. Where do new ideas come from When are decisions made? Who is involved in these decisions? 2. Draw a diagram of the innovation funnel that captures these characteristics
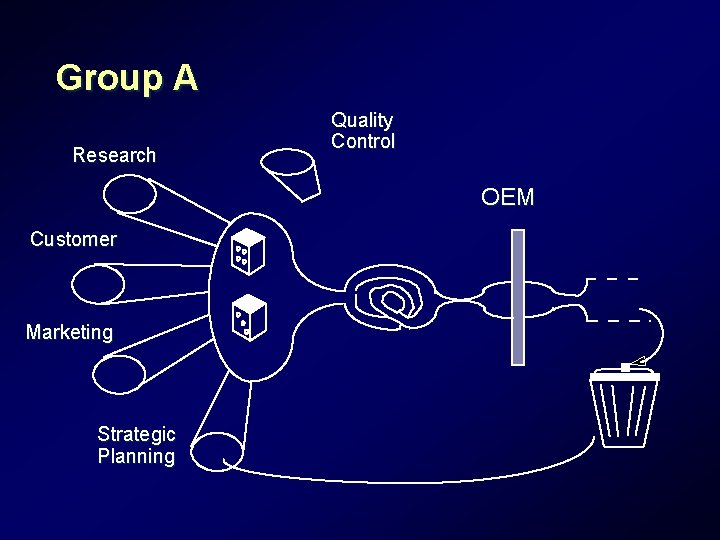
Group A Research Quality Control OEM Customer Marketing Strategic Planning
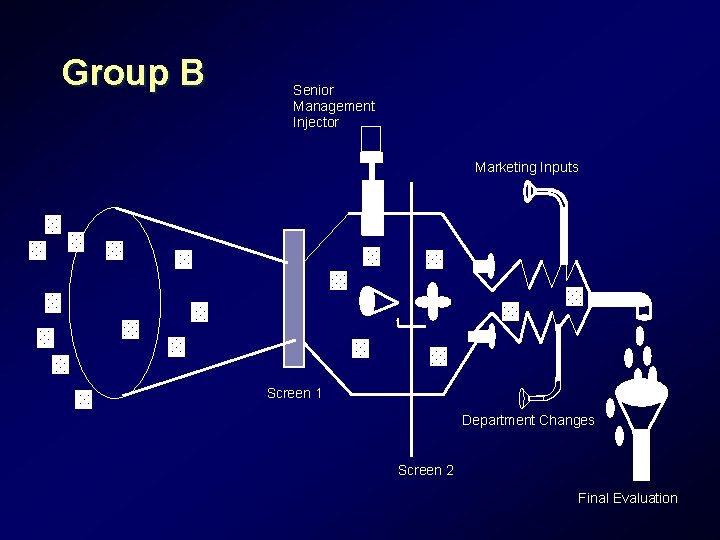
Group B Senior Management Injector Marketing Inputs Screen 1 Department Changes Screen 2 Final Evaluation
10 -minute exercise: Funnels You Have Known What does the innovation funnel at your company look like?
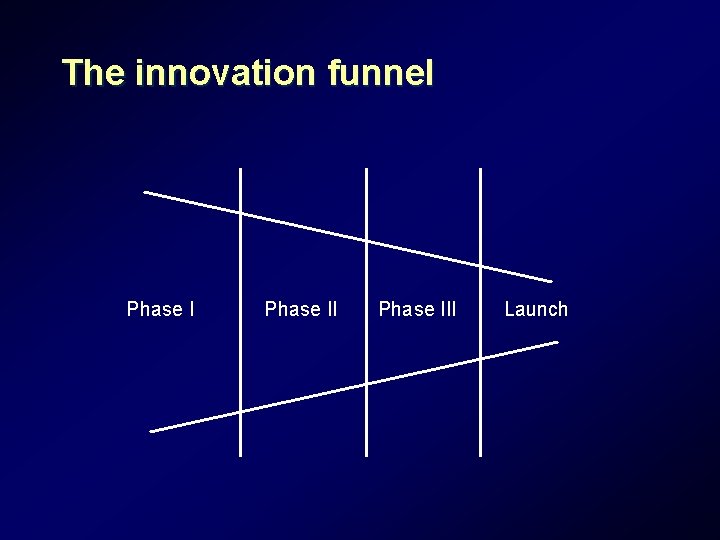
The innovation funnel Phase III Launch
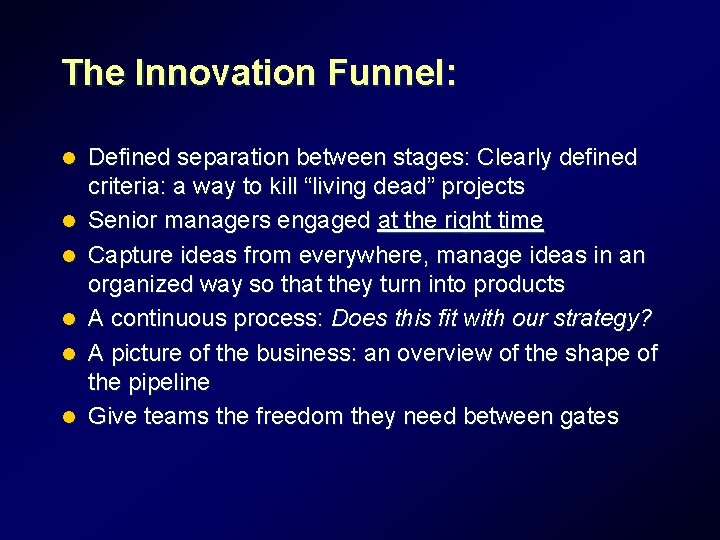
The Innovation Funnel: l l l Defined separation between stages: Clearly defined criteria: a way to kill “living dead” projects Senior managers engaged at the right time Capture ideas from everywhere, manage ideas in an organized way so that they turn into products A continuous process: Does this fit with our strategy? A picture of the business: an overview of the shape of the pipeline Give teams the freedom they need between gates
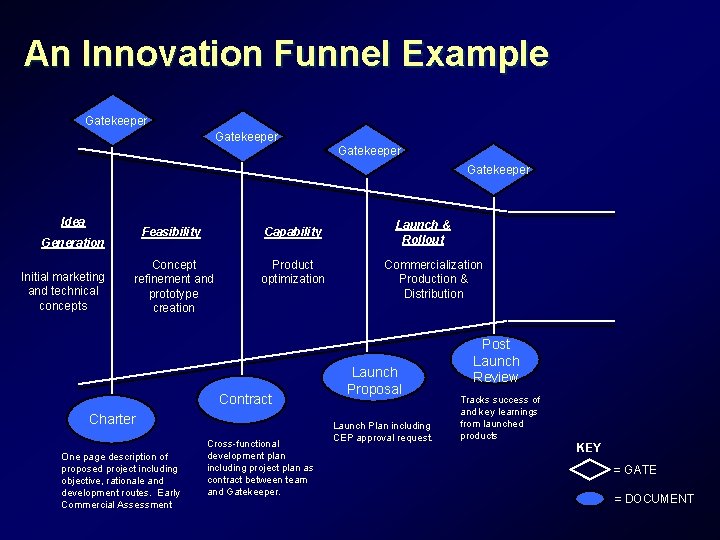
An Innovation Funnel Example Gatekeeper Idea Feasibility Capability Concept refinement and prototype creation Product optimization Generation Initial marketing and technical concepts Contract Charter One page description of proposed project including objective, rationale and development routes. Early Commercial Assessment Cross-functional development plan including project plan as contract between team and Gatekeeper. Launch & Rollout Commercialization Production & Distribution Launch Proposal Launch Plan including CEP approval request. Post Launch Review Tracks success of and key learnings from launched products KEY = GATE = DOCUMENT
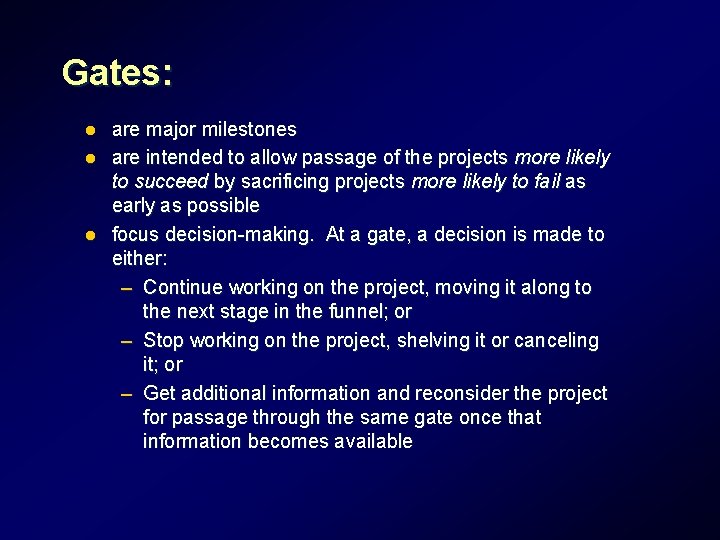
Gates: are major milestones l are intended to allow passage of the projects more likely to succeed by sacrificing projects more likely to fail as early as possible l focus decision-making. At a gate, a decision is made to either: – Continue working on the project, moving it along to the next stage in the funnel; or – Stop working on the project, shelving it or canceling it; or – Get additional information and reconsider the project for passage through the same gate once that information becomes available l
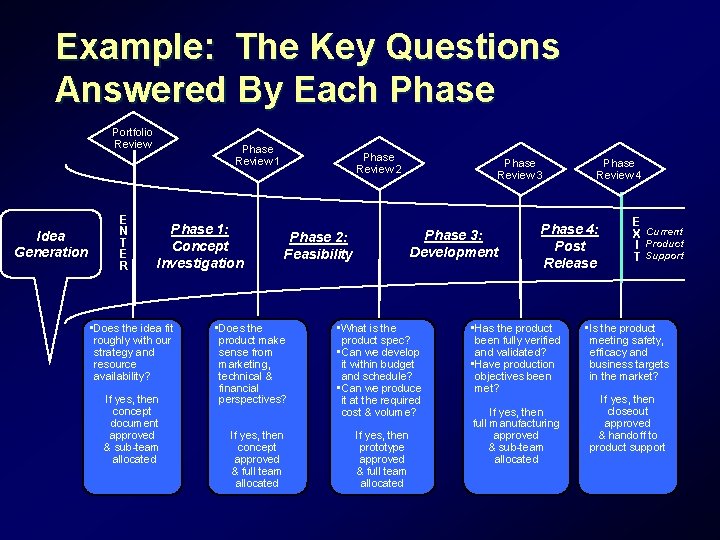
Example: The Key Questions Answered By Each Phase Portfolio Review Idea Generation E N T E R Phase Review 1 Phase 1: Concept Investigation • Does the idea fit roughly with our strategy and resource availability? If yes, then concept document approved & sub-team allocated Phase Review 2 Phase 3: Development Phase 2: Feasibility • Does the product make sense from marketing, technical & financial perspectives? If yes, then concept approved & full team allocated Phase Review 3 • What is the product spec? • Can we develop it within budget and schedule? • Can we produce it at the required cost & volume? If yes, then prototype approved & full team allocated Phase Review 4 Phase 4: Post Release • Has the product been fully verified and validated? • Have production objectives been met? If yes, then full manufacturing approved & sub-team allocated E X Current I Product T Support • Is the product meeting safety, efficacy and business targets in the market? If yes, then closeout approved & handoff to product support
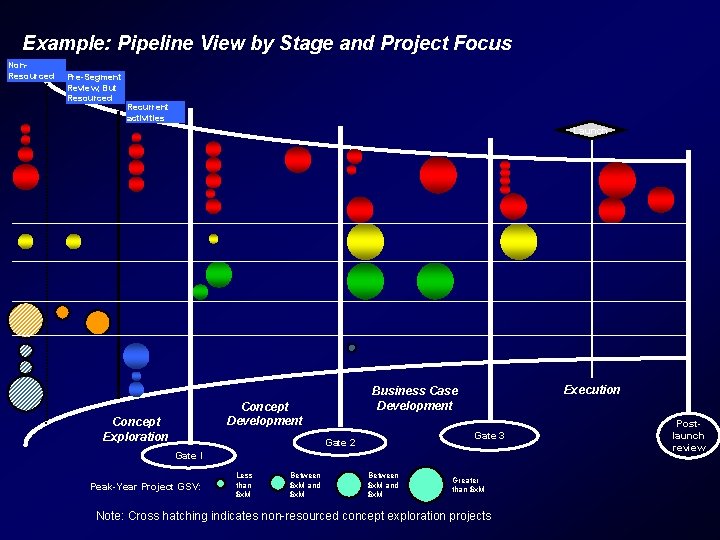
Example: Pipeline View by Stage and Project Focus Non. Resourced Pre-Segment Review, But Resourced Recurrent activities Launch Concept Development Concept Exploration Execution Business Case Development Gate 3 Gate 2 Gate I Peak-Year Project GSV: Less than $x. M Between $x. M and $x. M Greater than $x. M Note: Cross hatching indicates non-resourced concept exploration projects Postlaunch review
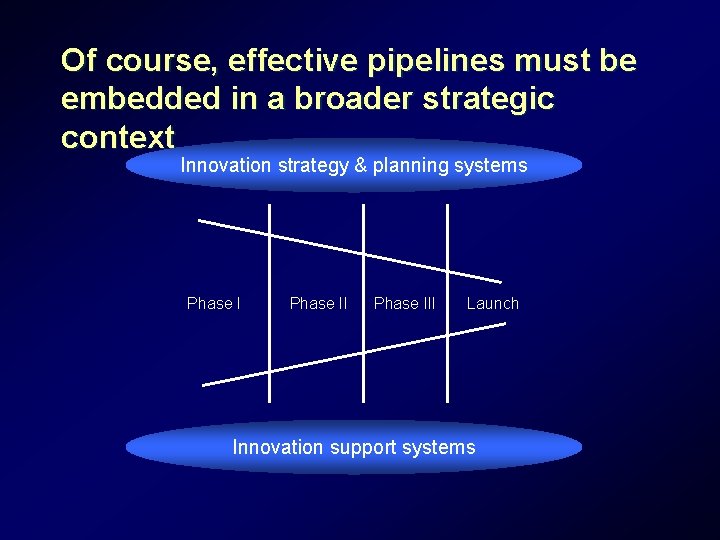
Of course, effective pipelines must be embedded in a broader strategic context Innovation strategy & planning systems Phase III Launch Innovation support systems
The Reality?
Making a funnel work: l Formally: – Pacing the funnel to the needs of the business, not the other way around – Involving key decision makers early l Informally: – Leadership: tolerating “high respect, high conflict” debate – Trust: “but this would only work if we told the truth…” – Consistency
BUT…. l By what criteria do we make decisions at the gates?
Using decision tools that allow you to compare initiatives against each other (and the degree to which they fit your strategy)
Analytical (? ) Tools for Making Choices l Financial Tools: – IRR & NPV – Risk vs Return – Options l Portfolio Concepts: – The Aggregate Project Plan l Scenario Analysis
IRR and NPV: A great place to begin but a terrible place to finish? Strengths l A focus on the quantifiable costs and benefits of the project l Allows for easy ranking and comparison l l Weaknesses Forces a focus on “the numbers” Neglects the role of uncertainty Neglects strategic considerations Ignores interdependency between projects
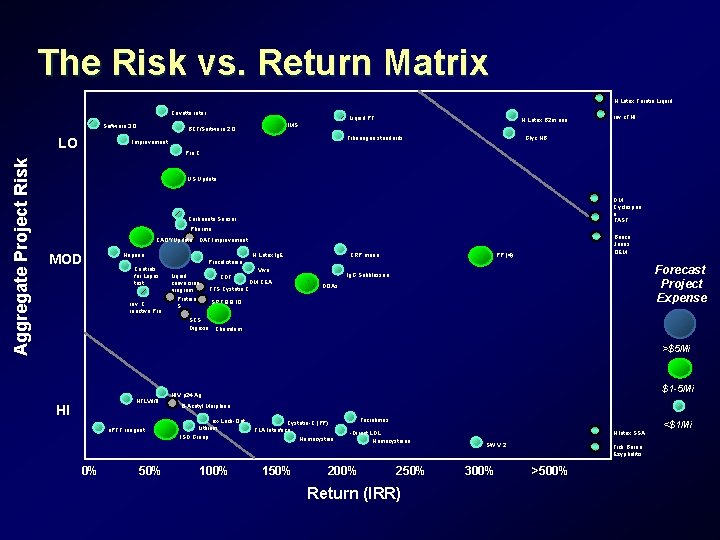
The Risk vs. Return Matrix N Latex Ferritin Liquid Cuvette rotor Software 3. 0 Aggregate Project Risk LO Liquid PT N Latex B 2 m neu IMS BCT/Software 2. 0 Fibrinogen standards Improvement rev c. TNI Glyc HB Pro C US Update DM Cyclospori n FAST Carbonate Sensor Pharma CAQ*/Update MOD Heparin Controls for Lupus test rev. C reactive Pro Bence Jones OEM DAT Improvement N Latex lg. E CRP mono PP (4) Procalcitonin Liquid conversion program Protein S CDT Viva DM CEA TTS Cystatin C Forecast Project Expense lg. G Subklassen DOAs SRT 8, 9, 10 SCS Digoxin Chemilum >$5 Mi HTLV/I/II HI a. PTT reagent 0% 50% $1 -5 Mi HIV p 24 Ag 6 -Acetyl Morphine ex-Lock-Out Lithium ISD Group 100% Cystatin-C (PP) TLA Interface Homocystein 150% Tacrolimus -Direct LDL Homocysteine 200% 250% Return (IRR) N latex SSA SW V 2 300% Tick Borne Ezyphalitis >500% <$1 Mi
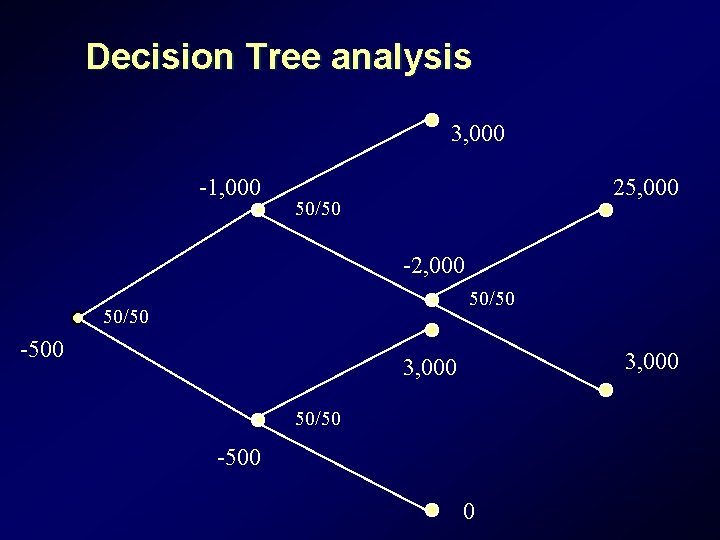
Decision Tree analysis 3, 000 -1, 000 25, 000 50/50 -2, 000 50/50 -500 3, 000 50/50 -500 0
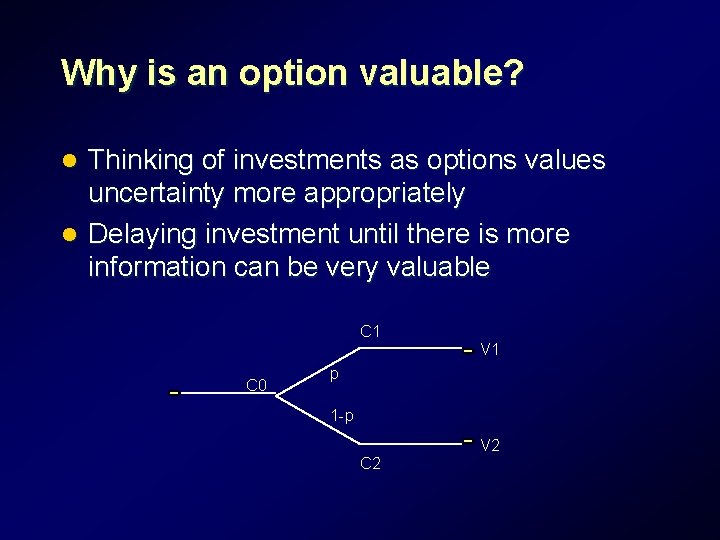
Why is an option valuable? Thinking of investments as options values uncertainty more appropriately l Delaying investment until there is more information can be very valuable l C 1 V 1 C 0 p 1 -p V 2 C 2
When is thinking of a project as an “option” likely to be fruitful? When the future is very uncertain l When investing now will create unique opportunities for the firm l When failing to invest now means that it will be very expensive to invest later l
How much is an option worth? l See “Investment Opportunities as Real Options: Getting Started on the Numbers” (and references therein) – by Timothy Luerhrman In the back of your binders
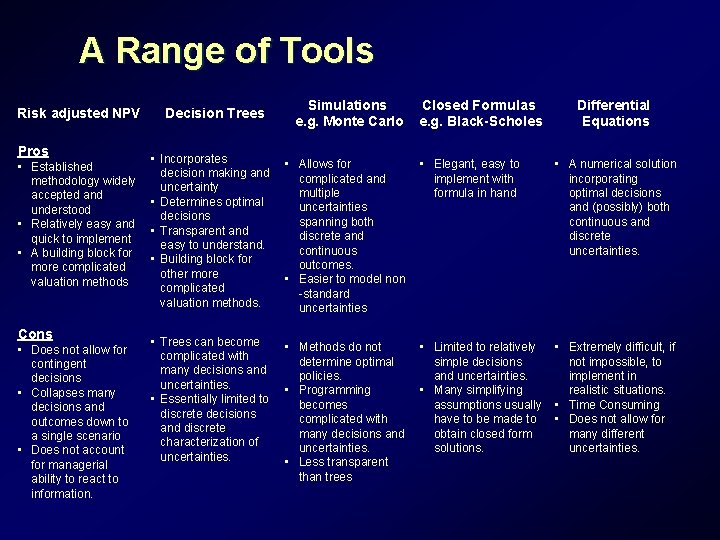
A Range of Tools Risk adjusted NPV Pros • Established methodology widely accepted and understood • Relatively easy and quick to implement • A building block for more complicated valuation methods Cons • Does not allow for contingent decisions • Collapses many decisions and outcomes down to a single scenario • Does not account for managerial ability to react to information. Decision Trees Simulations e. g. Monte Carlo Closed Formulas e. g. Black-Scholes Differential Equations • Incorporates decision making and uncertainty • Determines optimal decisions • Transparent and easy to understand. • Building block for other more complicated valuation methods. • Allows for complicated and multiple uncertainties spanning both discrete and continuous outcomes. • Easier to model non -standard uncertainties • Elegant, easy to implement with formula in hand • A numerical solution incorporating optimal decisions and (possibly) both continuous and discrete uncertainties. • Trees can become complicated with many decisions and uncertainties. • Essentially limited to discrete decisions and discrete characterization of uncertainties. • Methods do not determine optimal policies. • Programming becomes complicated with many decisions and uncertainties. • Less transparent than trees • Limited to relatively simple decisions and uncertainties. • Many simplifying assumptions usually have to be made to obtain closed form solutions. • Extremely difficult, if not impossible, to implement in realistic situations. • Time Consuming • Does not allow for many different uncertainties.
Portfolio Concepts: Aggregate Planning Tools
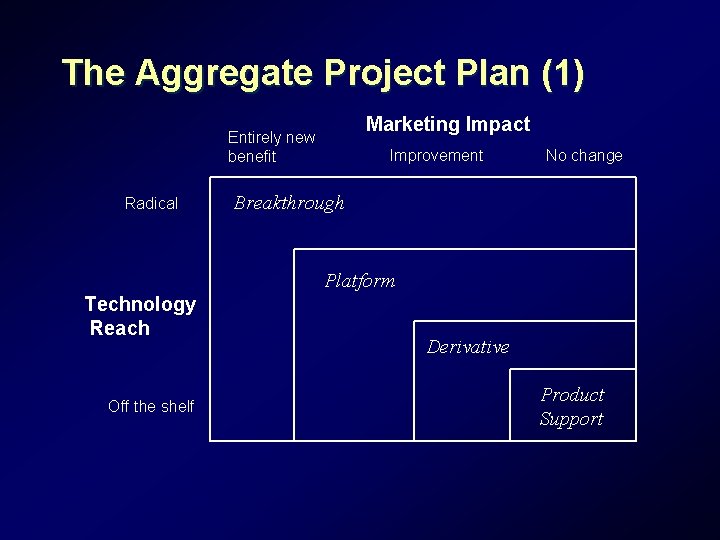
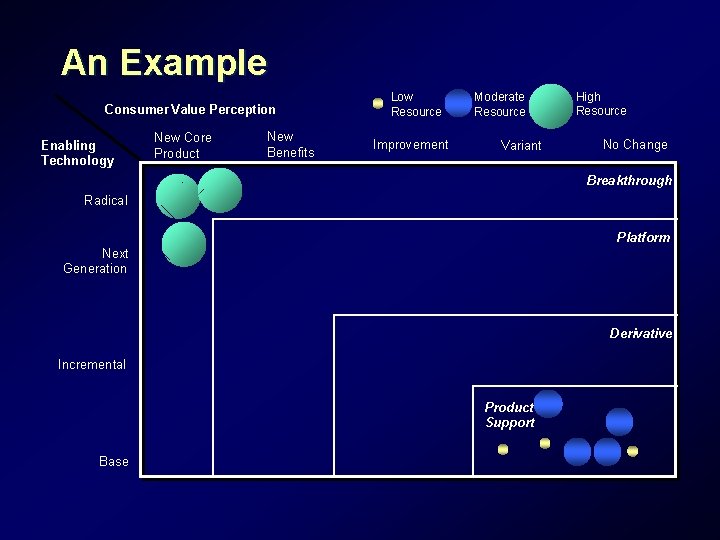
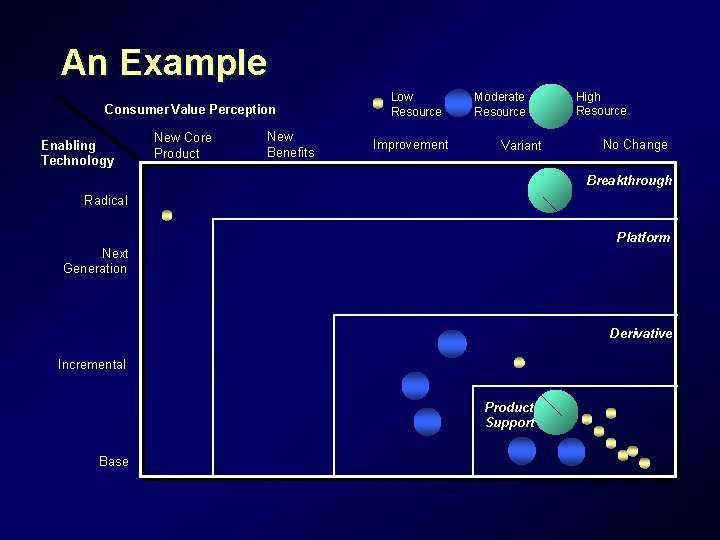
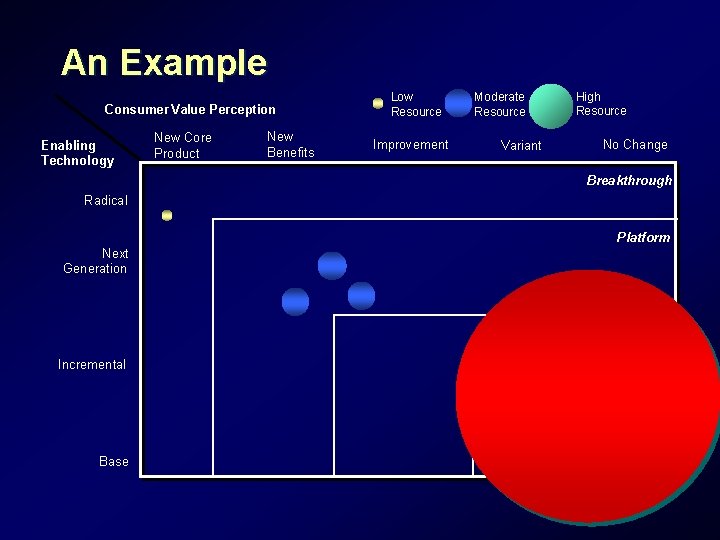
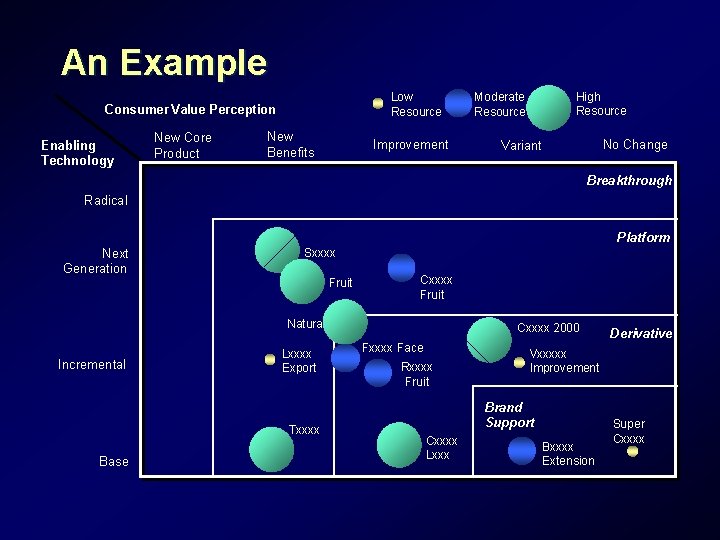
The Aggregate Project Plan (1) Marketing Impact Entirely new benefit Radical Improvement No change Breakthrough Platform Technology Reach Off the shelf Derivative Product Support
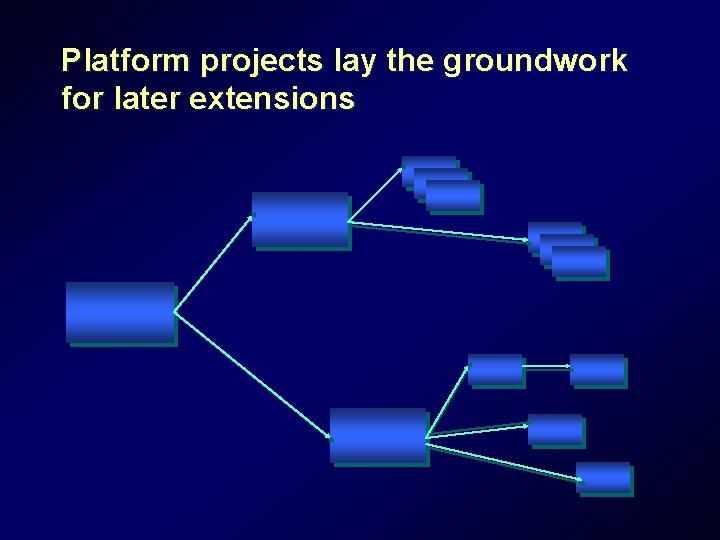
Platform projects lay the groundwork for later extensions
An Example Consumer Value Perception Enabling Technology New Core Product New Benefits Low Resource Improvement Moderate Resource Variant High Resource No Change Breakthrough Radical Platform Next Generation Derivative Incremental Product Support Base
An Example Consumer Value Perception Enabling Technology New Core Product New Benefits Low Resource Improvement Moderate Resource Variant High Resource No Change Breakthrough Radical Platform Next Generation Derivative Incremental Product Support Base
An Example Consumer Value Perception Enabling Technology New Core Product New Benefits Low Resource Improvement Moderate Resource Variant High Resource No Change Breakthrough Radical Platform Next Generation Derivative Incremental Product Support Base
An Example Low Resource Consumer Value Perception Enabling Technology New Core Product New Benefits Improvement High Resource Moderate Resource No Change Variant Breakthrough Radical Platform Next Generation Sxxxx Fruit Cxxxx Fruit Natural Incremental Lxxxx Export Txxxx Base Cxxxx 2000 Fxxxx Face Rxxxx Fruit Vxxxxx Improvement Brand Support Cxxxx Lxxx Derivative Bxxxx Extension Super Cxxxx
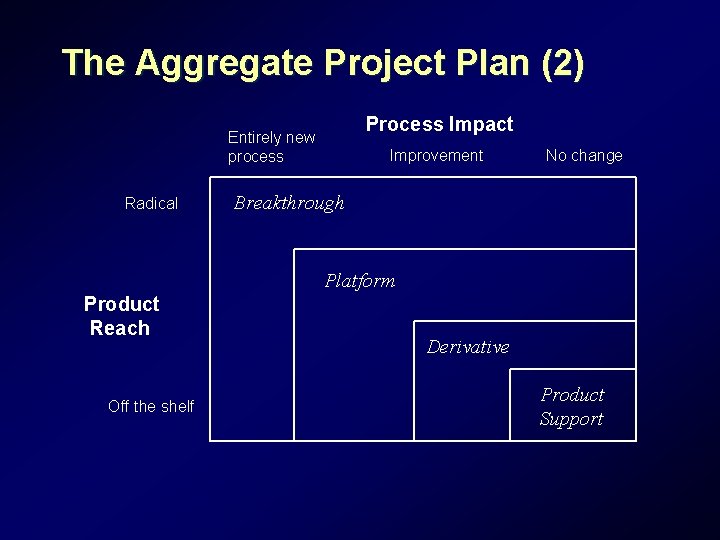
The Aggregate Project Plan (2) Process Impact Entirely new process Radical Improvement No change Breakthrough Platform Product Reach Off the shelf Derivative Product Support
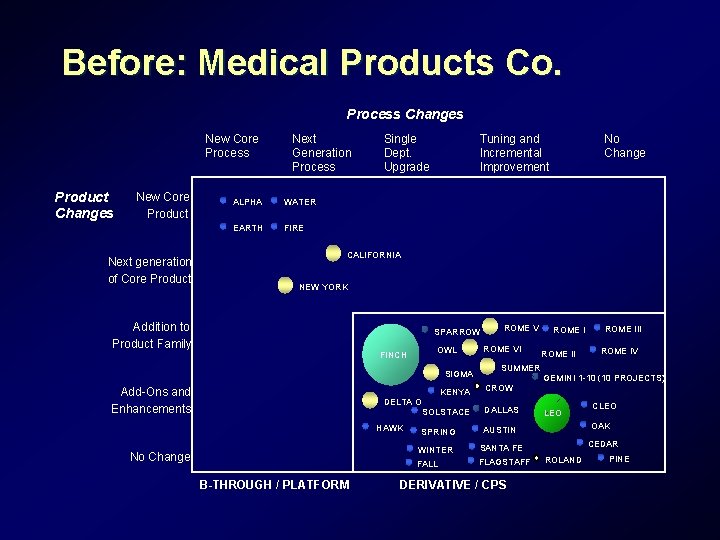
Before: Medical Products Co. Process Changes New Core Process Product Changes New Core Product Next generation of Core Product Next Generation Process ALPHA WATER EARTH FIRE Single Dept. Upgrade Tuning and Incremental Improvement No Change CALIFORNIA NEW YORK Addition to Product Family SPARROW OWL FINCH SIGMA Add-Ons and Enhancements DELTA O HAWK No Change B-THROUGH / PLATFORM KENYA ROME VI SUMMER CROW ROME III ROME IV GEMINI 1 -10 (10 PROJECTS) CLEO SOLSTACE DALLAS SPRING AUSTIN OAK WINTER SANTA FE CEDAR FALL FLAGSTAFF DERIVATIVE / CPS LEO ROLAND PINE
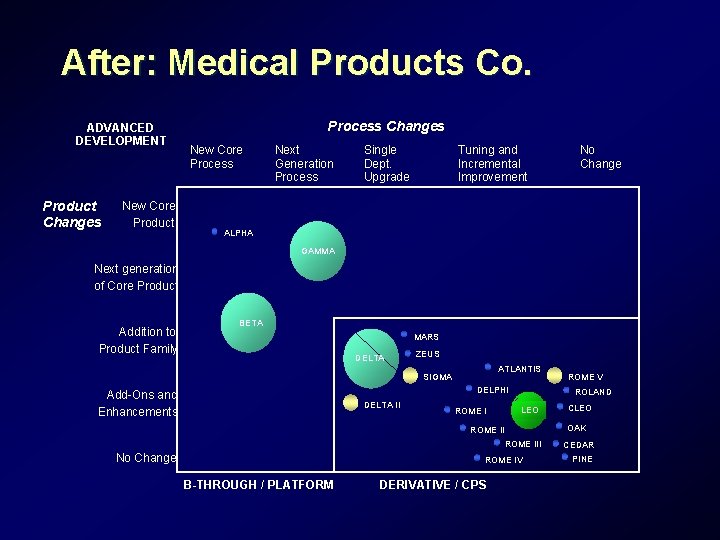
After: Medical Products Co. ADVANCED DEVELOPMENT Product Changes New Core Product Process Changes New Core Process Next Generation Process Single Dept. Upgrade Tuning and Incremental Improvement No Change ALPHA GAMMA VENUS Next generation of Core Product Addition to Product Family BETA MARS DELTA I ZEUS ATLANTIS SIGMA DELPHI Add-Ons and Enhancements DELTA II ROLAND LEO ROME III No Change ROME IV B-THROUGH / PLATFORM DERIVATIVE / CPS ROME V CLEO OAK CEDAR PINE
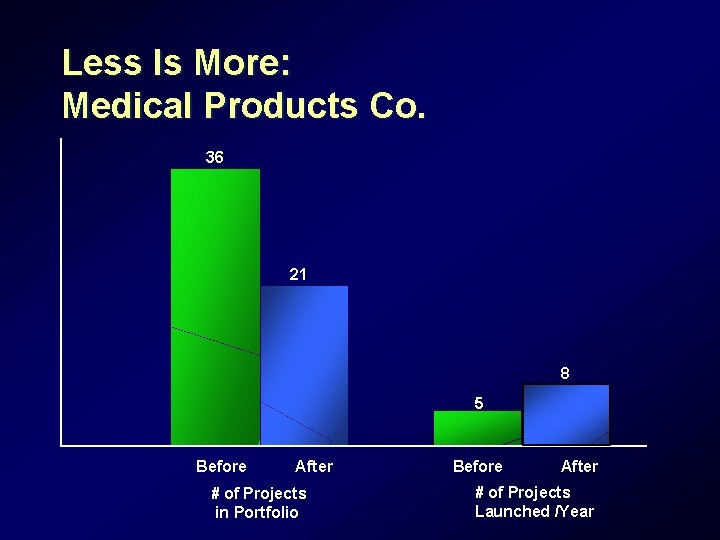
Less Is More: Medical Products Co. 36 21 8 5 Before After # of Projects in Portfolio Before After # of Projects Launched /Year
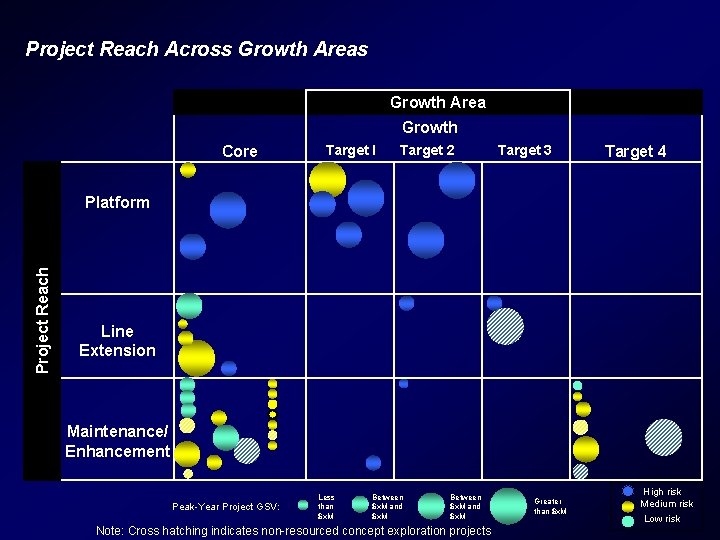
Project Reach Across Growth Area Growth Core Target l Target 2 Target 3 Target 4 Project Reach Platform Line Extension Maintenance/ Enhancement Peak-Year Project GSV: Less than $x. M Between $x. M and $x. M Note: Cross hatching indicates non-resourced concept exploration projects Greater than $x. M High risk Medium risk Low risk
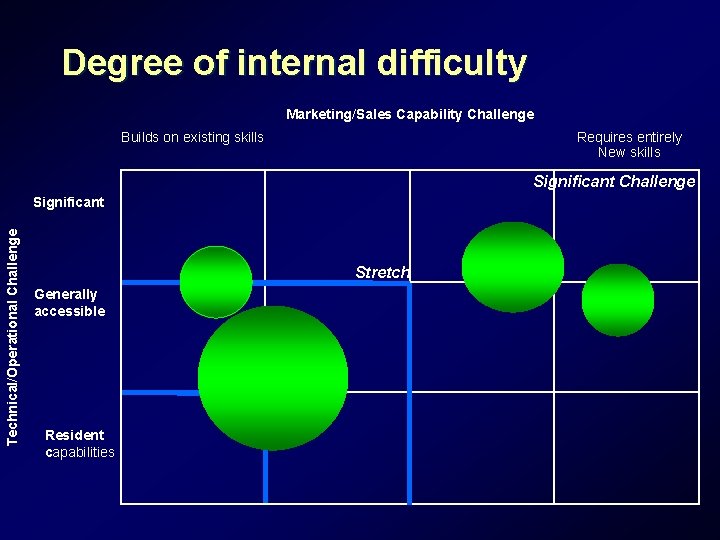
Degree of internal difficulty Marketing/Sales Capability Challenge Builds on existing skills Requires entirely New skills Significant Challenge Technical/Operational Challenge Significant Stretch Generally accessible Support Resident capabilities
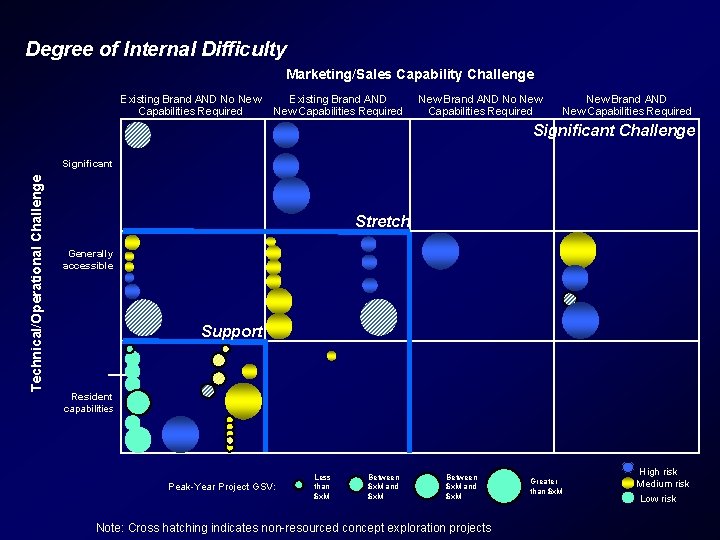
Degree of Internal Difficulty Marketing/Sales Capability Challenge Existing Brand AND No New Capabilities Required Existing Brand AND New Capabilities Required New Brand AND No New Capabilities Required New Brand AND New Capabilities Required Significant Challenge Technical/Operational Challenge Significant Stretch Generally accessible Support Resident capabilities Peak-Year Project GSV: Less than $x. M Between $x. M and $x. M Note: Cross hatching indicates non-resourced concept exploration projects Greater than $x. M High risk Medium risk Low risk
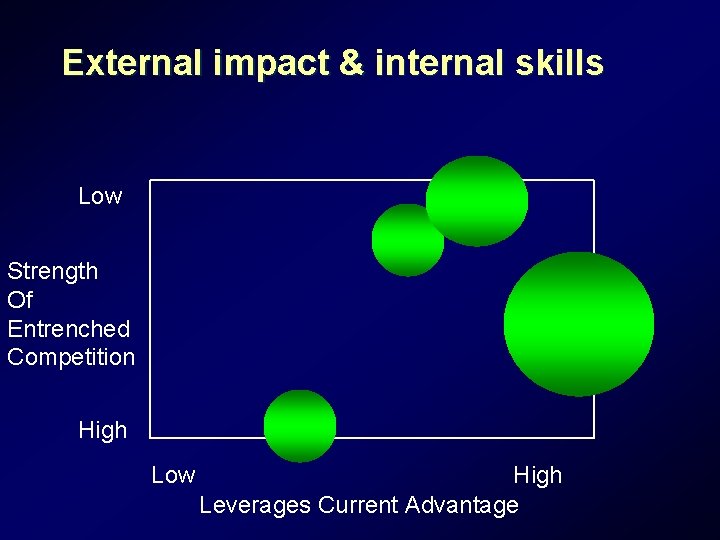
External impact & internal skills Low Strength Of Entrenched Competition High Low High Leverages Current Advantage
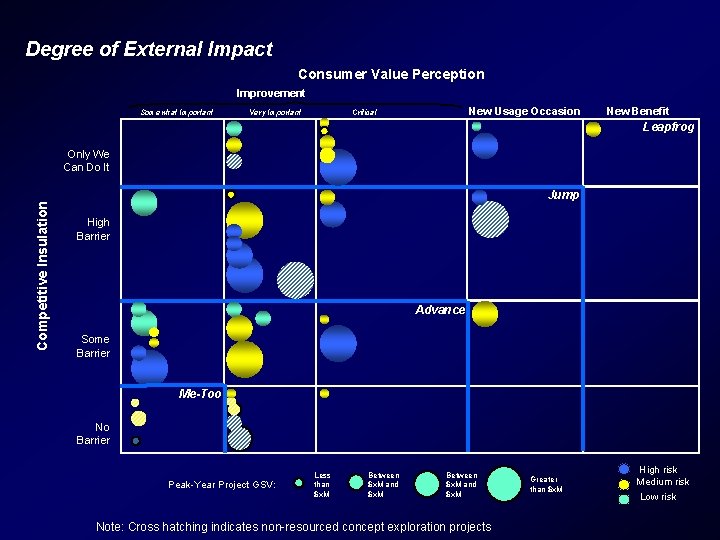
Degree of External Impact Consumer Value Perception Improvement Somewhat Important Very Important New Usage Occasion Critical New Benefit Leapfrog Only We Can Do It Competitive Insulation Jump High Barrier Advance Some Barrier Me-Too No Barrier Peak-Year Project GSV: Less than $x. M Between $x. M and $x. M Note: Cross hatching indicates non-resourced concept exploration projects Greater than $x. M High risk Medium risk Low risk
Benefits of an Aggregate Project Plan: Explicit choice of projects balances the long and short term, allows for the explicit discussion of the match to strategy l Match between project type and organizational form allows for a focus on the generation of competence l Focus builds speed and productivity for the individual and the organization l
Strategy and Scenario Analysis
Strategy and Scenario Analysis Formulating a strategy requires judgment about the future l But the future is complex & hard to predict l Scenarios provide a way to manage this complexity l
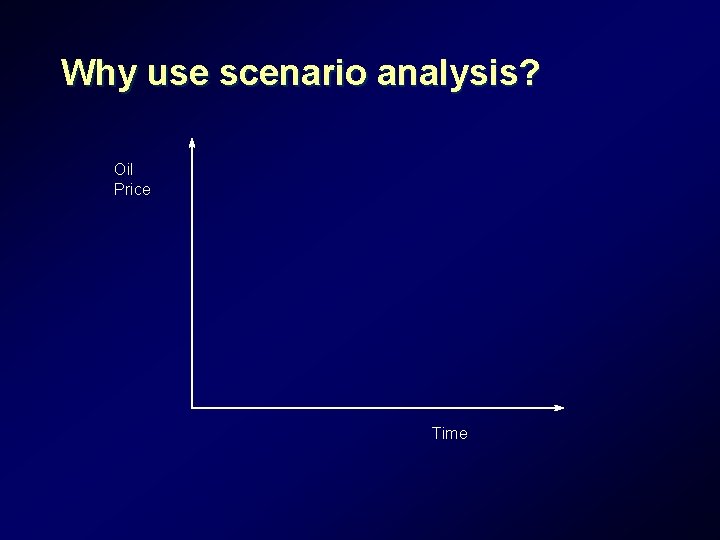
Why use scenario analysis? Oil Price Time
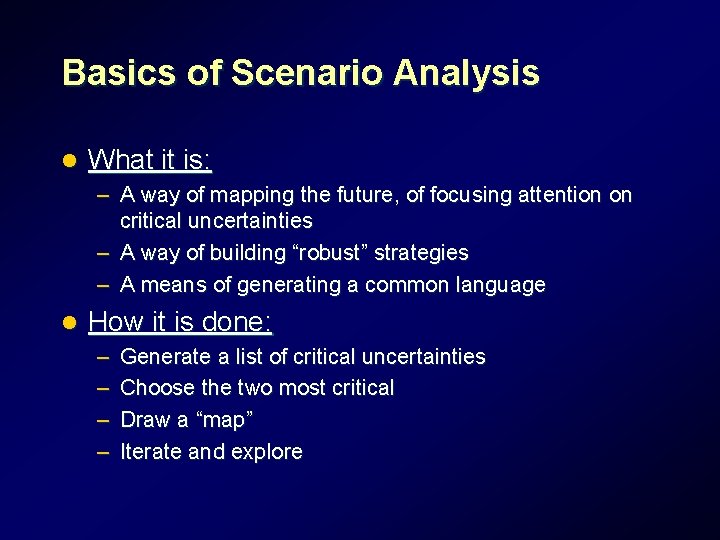
Basics of Scenario Analysis l What it is: – A way of mapping the future, of focusing attention on critical uncertainties – A way of building “robust” strategies – A means of generating a common language l How it is done: – – Generate a list of critical uncertainties Choose the two most critical Draw a “map” Iterate and explore
Predicting the future of the Pharmaceutical Industry
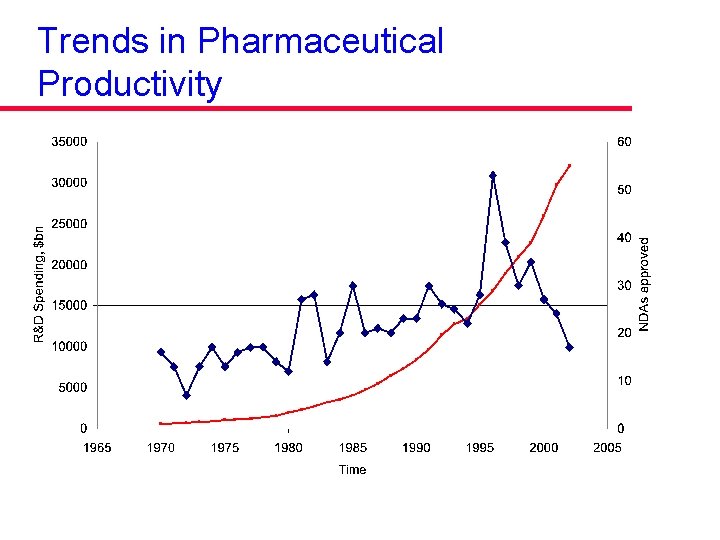
The Roots of Turmoil Dramatically declining research productivity l Major technological shifts l Fundamental environmental challenges l Significant new entry l
The Productivity Crisis
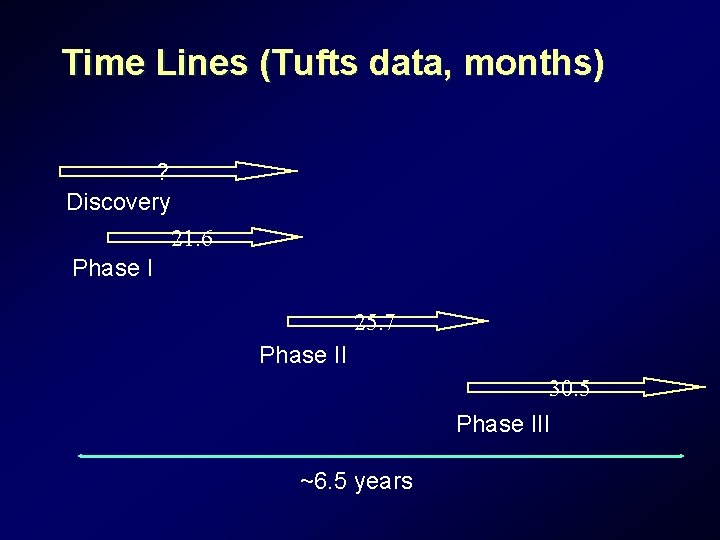
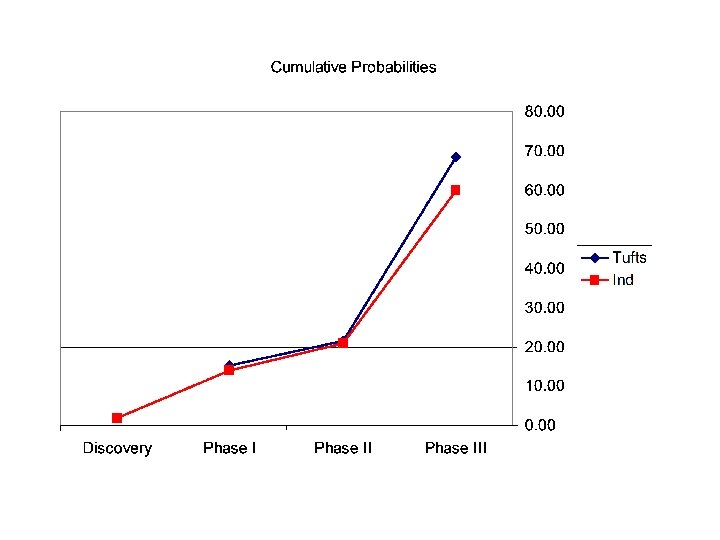
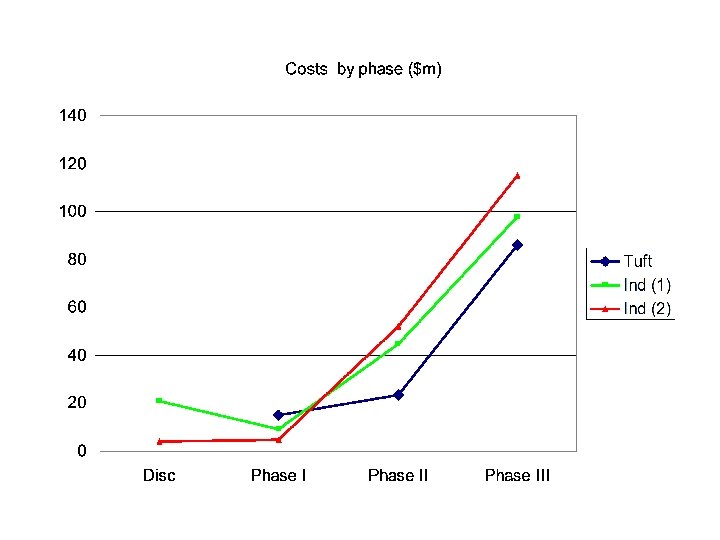
Time Lines (Tufts data, months) ? Discovery 21. 6 Phase I 25. 7 Phase II 30. 5 Phase III ~6. 5 years
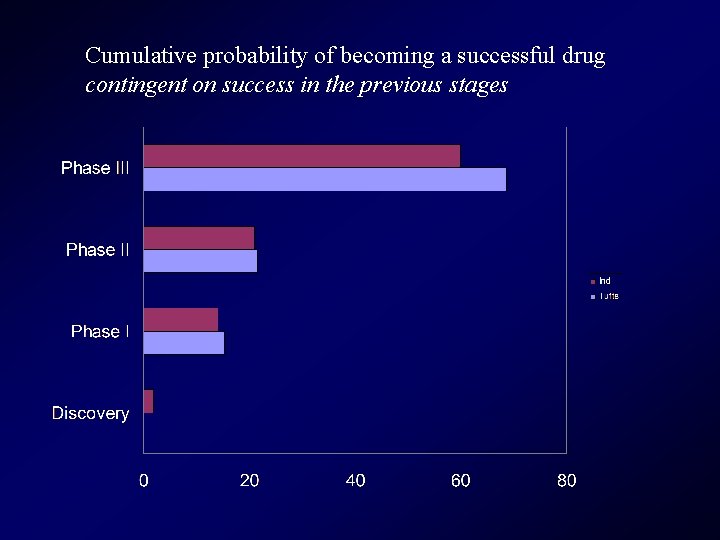
Cumulative probability of becoming a successful drug contingent on success in the previous stages
Trends in Pharmaceutical Productivity
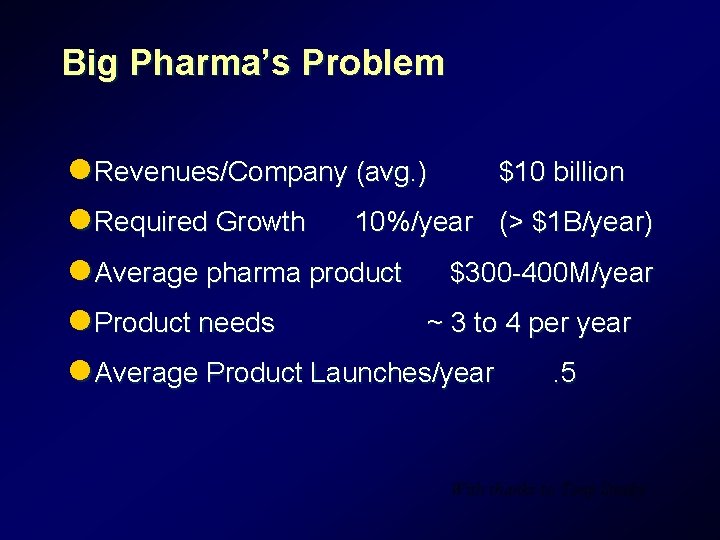
Big Pharma’s Problem l Revenues/Company (avg. ) $10 billion l Required Growth 10%/year (> $1 B/year) l Average pharma product $300 -400 M/year l Product needs ~ 3 to 4 per year l Average Product Launches/year. 5 With thanks to Tony Sinsky
Major Technological Shifts l From “rational” drug discovery – Small molecules, hypothesis driven research l To the “omics” and “systems biology” – Understanding the “deep structure” of disease and the functioning of the genome and the cell
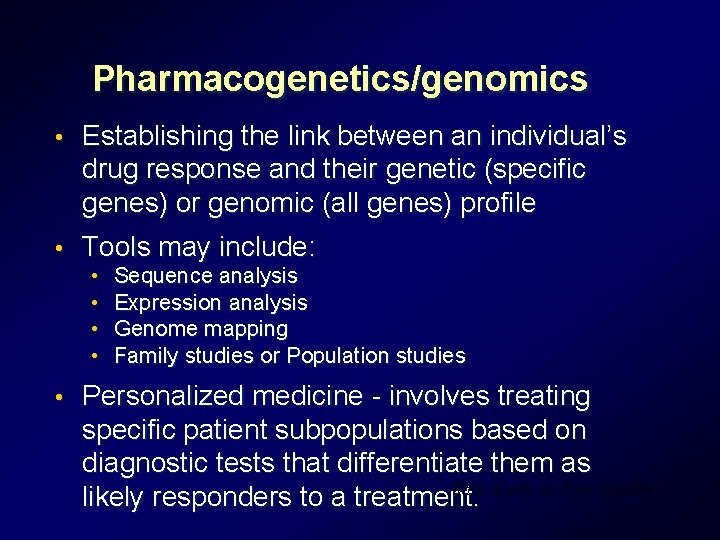
Pharmacogenetics/genomics • Establishing the link between an individual’s drug response and their genetic (specific genes) or genomic (all genes) profile • Tools may include: • • • Sequence analysis Expression analysis Genome mapping Family studies or Population studies Personalized medicine - involves treating specific patient subpopulations based on diagnostic tests that differentiate them as With thanks to Tony Sinskey likely responders to a treatment.
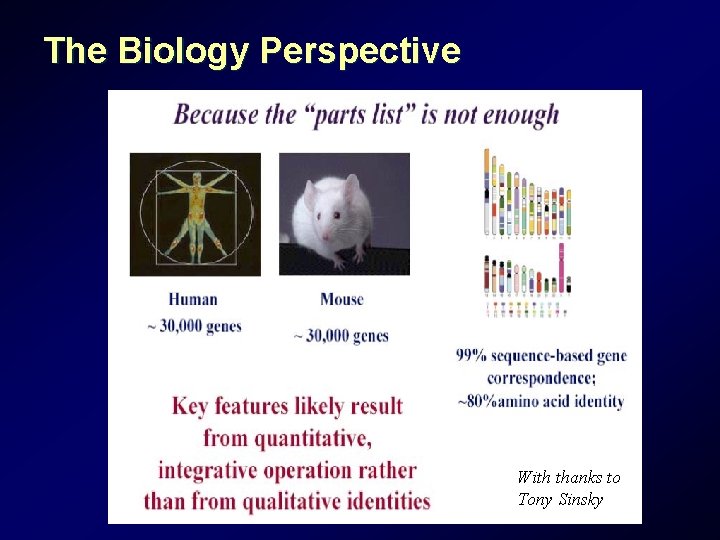
The Biology Perspective With thanks to Tony Sinsky
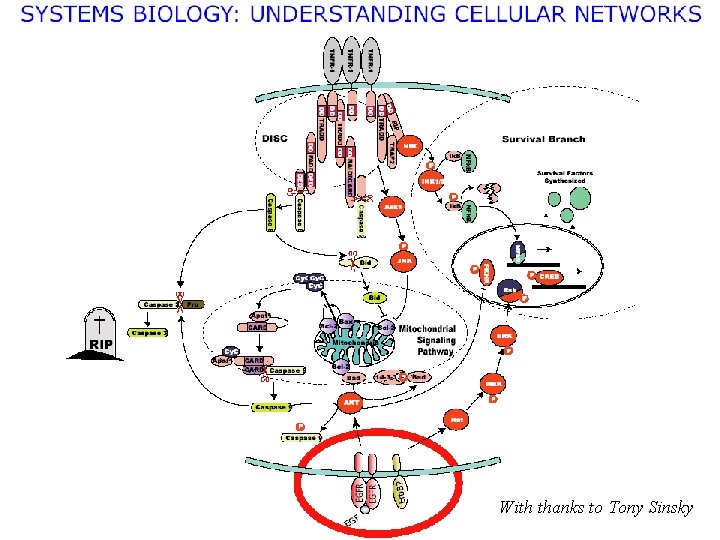
With thanks to Tony Sinsky
Environmental Challenges
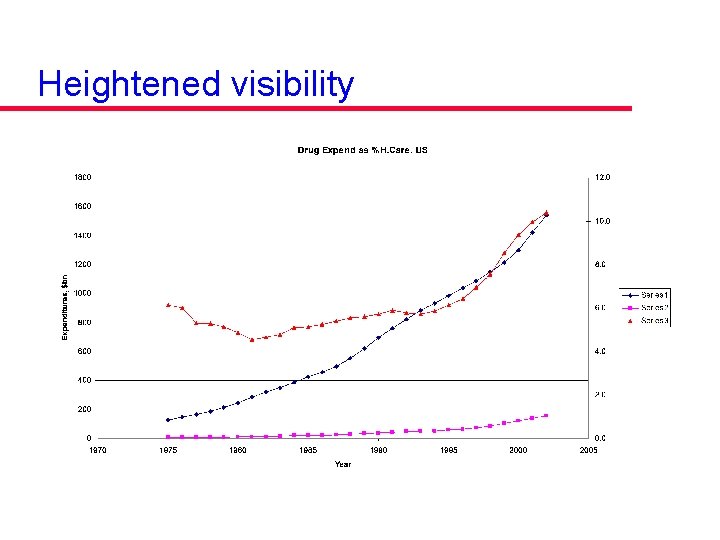
Heightened visibility
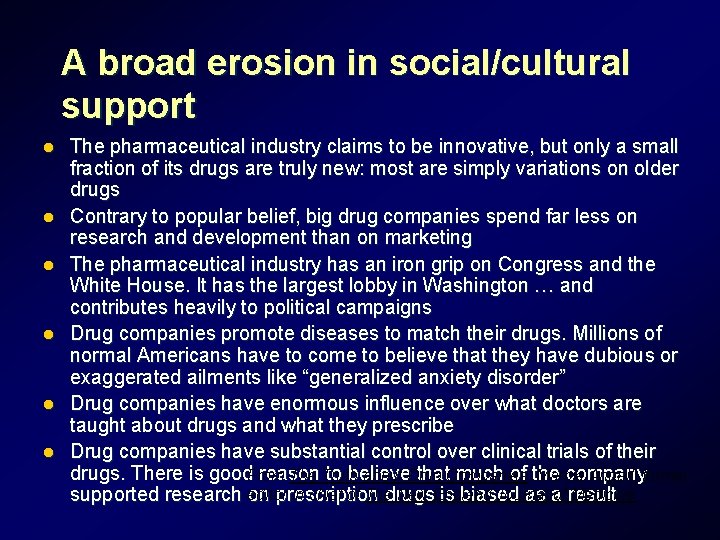
A broad erosion in social/cultural support l l l The pharmaceutical industry claims to be innovative, but only a small fraction of its drugs are truly new: most are simply variations on older drugs Contrary to popular belief, big drug companies spend far less on research and development than on marketing The pharmaceutical industry has an iron grip on Congress and the White House. It has the largest lobby in Washington … and contributes heavily to political campaigns Drug companies promote diseases to match their drugs. Millions of normal Americans have to come to believe that they have dubious or exaggerated ailments like “generalized anxiety disorder” Drug companies have enormous influence over what doctors are taught about drugs and what they prescribe Drug companies have substantial control over clinical trials of their drugs. There is good. From reason to believe that. Companies, much of the company The Truth about Drug Marcia Angell, former in chief of Thedrugs New England Journal Medicine supported research editor on prescription is biased as aof result
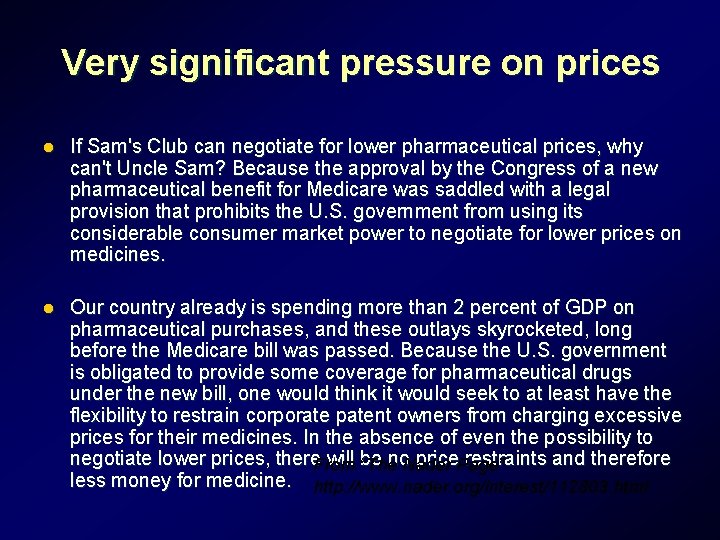
Very significant pressure on prices l If Sam's Club can negotiate for lower pharmaceutical prices, why can't Uncle Sam? Because the approval by the Congress of a new pharmaceutical benefit for Medicare was saddled with a legal provision that prohibits the U. S. government from using its considerable consumer market power to negotiate for lower prices on medicines. l Our country already is spending more than 2 percent of GDP on pharmaceutical purchases, and these outlays skyrocketed, long before the Medicare bill was passed. Because the U. S. government is obligated to provide some coverage for pharmaceutical drugs under the new bill, one would think it would seek to at least have the flexibility to restrain corporate patent owners from charging excessive prices for their medicines. In the absence of even the possibility to negotiate lower prices, there. From will be no. Nader price. Page” restraints and therefore “The less money for medicine. http: //www. nader. org/interest/112803. html
Significant new entry l Indian Pharmaceutical Industry l Companies Mentioned in this report include: - Aarti Drugs - Abbott India - Ajanta Pharma - Alembic Astrazeneca Pharma - Aurobindo Pharma - Aventis Pharma - Cadila Health - Cipla Dr. Reddy - Elder Pharma - German Remedies - Glaxo Smithkline - Ind Swift Lab - Ipca Laboratories J B Chemical Jagson Pharma K D L Biotech Kopran - Krebs Biochem - Lupin - Lyka Labs Medicorp Tech - Merck - Natco Pharma - Nicholas Piramal - Novartis - Orchid Chemicals - Organon - Panacea Bio - Pfizer - Pharmacia Ranbaxy - R P G Life Sciences - Shasun Chemicals - Siris Limited Sterling Biotech - Strides Arcolab - Sun Pharma - Suven Life Sciences http: //www. researchandmarkets. com/feats/download_pdf. asp? report_id=35229. - Torrent Pharma - Unichem Lab - Wockhardt - Wyeth Ltd - Zandu Pharma l COMMUNICATIONS COMPANY, INC. PHARMACEUTICAL INDUSTRY ESTIMATED AT U. S. $19. 4 § 25 Van Zant Street, Norwalk, CT 06855 CHINESE BILLION IN 2002 §BUSINESS
Exercise: l l l Generate a list of the major uncertainties facing the pharmaceutical and/or the medical device industry today Choose two, and draw a “map” What kinds of worlds have you defined? Can you name them? Iterate until you’re comfortable you have found four worlds that are both plausible and strategically important Be prepared to present your results to the group
Why may scenario analysis be useful? It focuses attention away from “the official future” and allows the robustness of a strategy to be evaluated l It focuses attention on critical uncertainties, allowing the organization to track them over time l It may spark creativity, imagination and a rethinking of core strategy l
Making choices using analytical tools: Summary Financial tools are critically important, but should not substitute for strategic thinking l Choices must be made as a portfolio, so that different projects are explicitly traded off against each other l It may be important to consider the robustness of a strategy: what will happen if the world looks very, very different? l
Summary
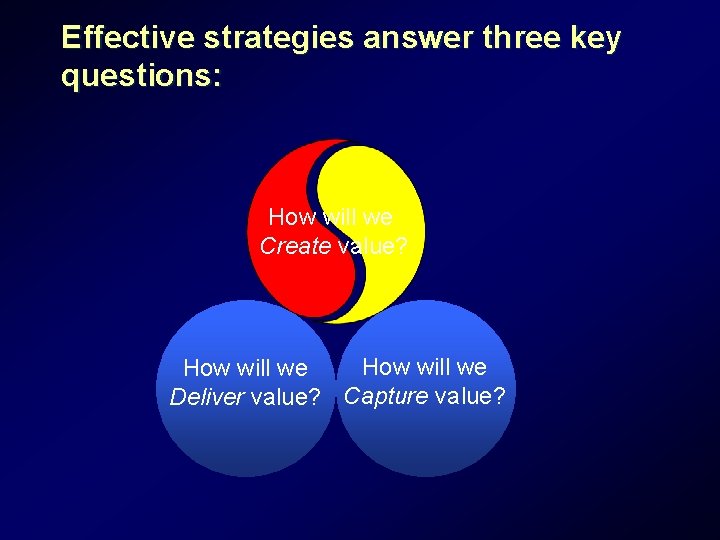
Effective strategies answer three key questions: How will we Create value? How will we Deliver value? Capture value?
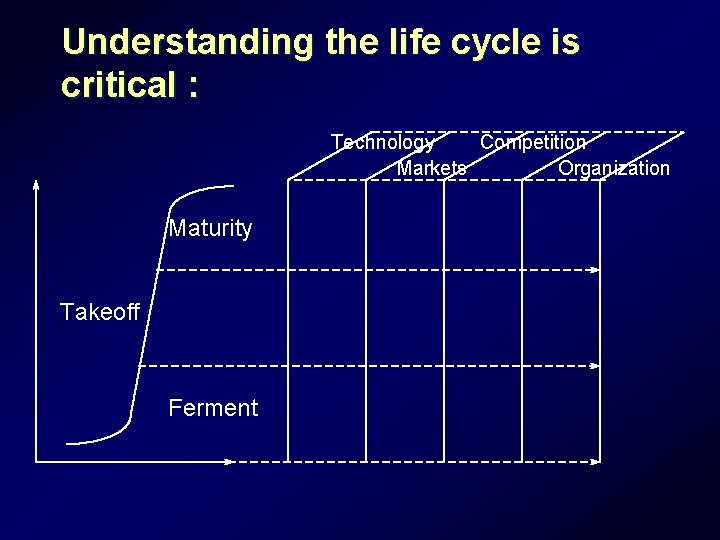
Understanding the life cycle is critical : Technology Competition Markets Organization Maturity Takeoff Ferment
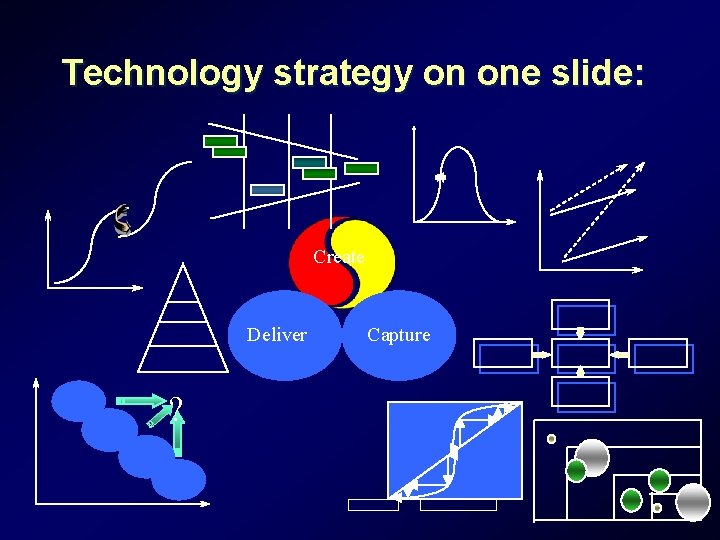
Technology strategy on one slide: Create Deliver ? Capture
What happens on Monday morning? Or: Getting there from here
Acting as a strategic catalyst requires mastering many roles l Information gatherer – What are the problems and opportunities? l Analyst – What are the key choices? What should we do? l Advocate and teacher – Presentation of information and analysis in ways that stimulate debate about the key issues l Leader – Modeling the use of time and attention – Supporting the team in making real decisions
Two case studies Medtronics l Kirkham Instruments l
Successful Implementation: Common Lessons l Senior management commitment & involvement – Senior steering committee – Empowered champion l Diagnostic phase – Aligned with the market – As well as with the existing culture and organization l A designed implementation plan – Up front – With appropriate expectations l Allocating resources to match the design.
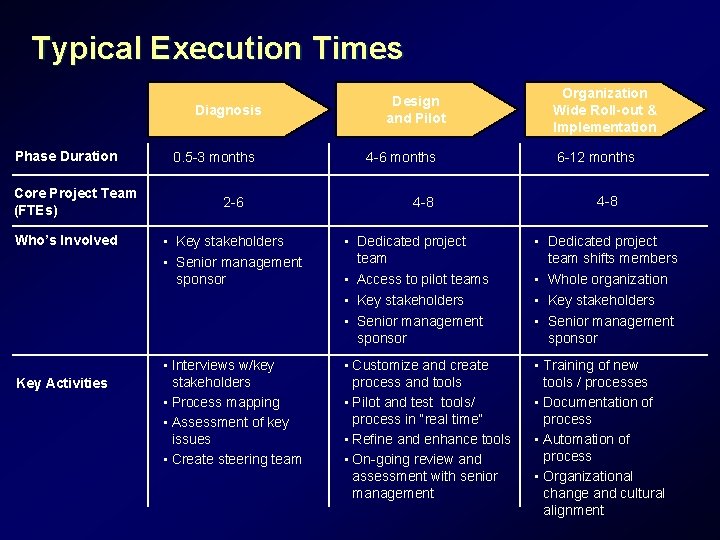
Typical Execution Times Diagnosis Phase Duration Core Project Team (FTEs) Who’s Involved Key Activities 0. 5 -3 months 2 -6 Design and Pilot 4 -6 months 4 -8 Organization Wide Roll-out & Implementation 6 -12 months 4 -8 • Key stakeholders • Senior management sponsor • Dedicated project team • Access to pilot teams • Key stakeholders • Senior management sponsor • Dedicated project team shifts members • Whole organization • Key stakeholders • Senior management sponsor • Interviews w/key stakeholders • Process mapping • Assessment of key issues • Create steering team • Customize and create process and tools • Pilot and test tools/ process in “real time” • Refine and enhance tools • On-going review and assessment with senior management • Training of new tools / processes • Documentation of process • Automation of process • Organizational change and cultural alignment
Good Luck!