Activity Diagrams Activity diagrams describe the workflow behavior

Activity Diagrams Activity diagrams describe the workflow behavior of a system. The diagrams describe the state of activities by showing the sequence of activities performed. Activity diagrams can show activities that are conditional or parallel.

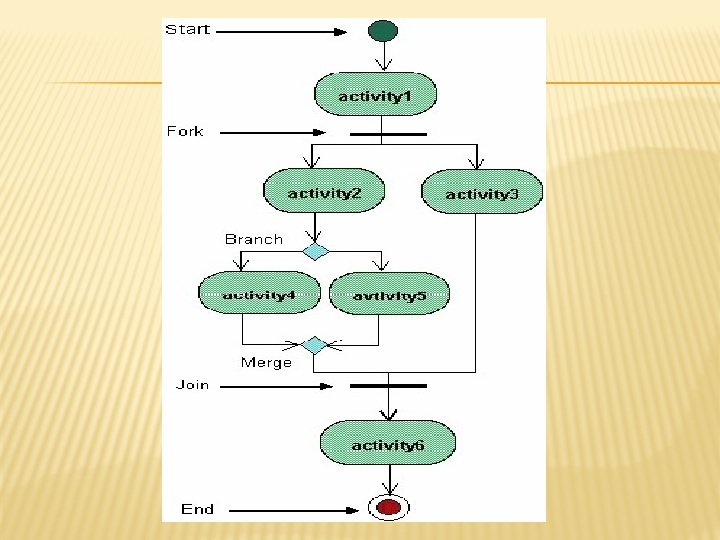
When to Use: Activity Diagrams are also useful for: analyzing a use case by describing what actions need to take place and when they should occur; How to Draw: Activity Diagrams Activity diagrams show the flow of activities through the system. Diagrams are read from top to bottom and have branches and forks to describe conditions and parallel activities. A fork is used when multiple activities are occurring at the same time.

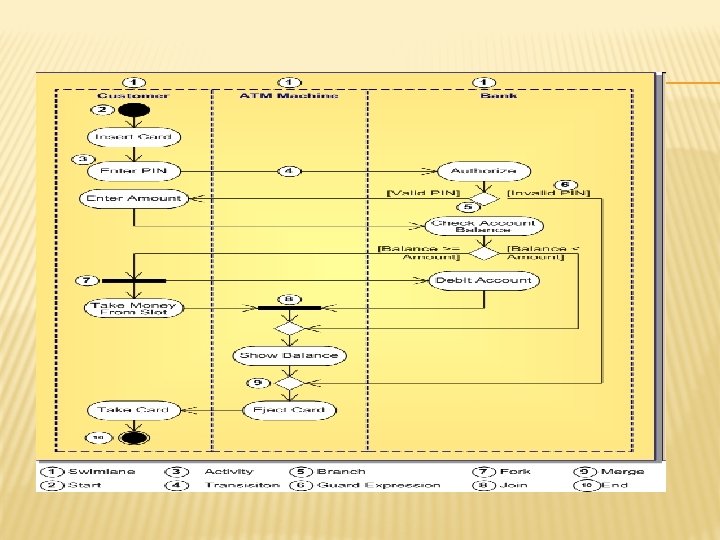
Elements of an Activity diagram Element and its description Initial Activity: This shows the starting point or first activity of the flow. Denoted by a solid circle. This is similar to the notation used for Initial State. Activity: Represented by a rectangle with rounded (almost oval) edges. Decisions: Similar to flowcharts, a logic where a decision is to be made is depicted by a diamond, with the options written on either sides of the arrows emerging from the diamond, within box brackets. Signal: When an activity sends or receives a message, that activity is called a signal. Signals are of two types: Input signal (Message receiving activity) shown by a concave polygon and Output signal (Message sending activity) shown by a convex polygon. Symbol

Concurrent Activities: Some activities occur simultaneously or in parallel. Such activities are called concurrent activities. For example, listening to the lecturer and looking at the blackboard is a parallel activity. This is represented by a horizontal split (thick dark line) and the two concurrent activities next to each other, and the horizontal line again to show the end of the parallel activity. Final Activity: The end of the Activity diagram is shown by a bull's eye symbol, also called as a final activity.

activity diagram for processing an order

STATE CHART DIAGRAM � Also called state diagram. � Shows the sequence of states that an object goes through during its lifetime in response to outside stimuli and messages. � During analysis, we use state diagram to indicate the dynamic behavior of the system � During design, we use state diagram to specify dynamic behavior of individual classes or collaboration between the classes

ESSENTIAL ELEMENTS OF STATE DIAGRAM

- Slides: 10