Activity 27 Investigating Boomtowns Weather R h c

Activity 27 Investigating Boomtown’s Weather R h c u M w o H ? ? e v i e c e R wn o t m o o B s e ain Do

Challenge. . . Is Boomtown’s rainfall likely to cause flooding? Key Vocabulary. . . v v v Average Mean Median Mode Sample size

Getting Started: �Read the Introduction on page 14. In your notebook, List the places that water comes from. � Rain � River flow from mountains � Ocean waves hitting the beach �Discuss in your groups. . . What is the difference between flooding and a rainfall pattern? �Flooding occurs when a lot of water falls or melts in a short amount of time. �A rainfall pattern is the typical amount of water an area receives from rain.

�Discuss in your groups. . . What effect could flooding have on Boomtown? • • Increased current speed in the river Flooded streets / buildings Saturated soil Soil washed away

Calculating Mean, Median and Mode

Practice:
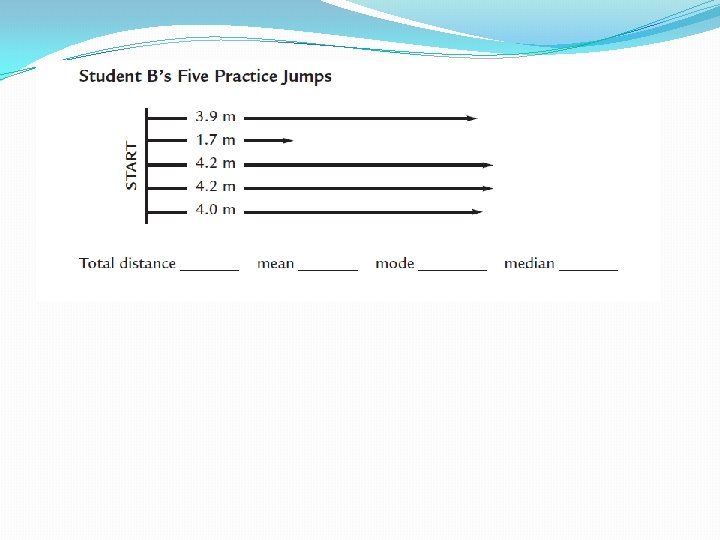

�Discuss this with your partner. Try to answer both questions. �Even though their averages are the same, Student B usually jumps farther than Student A. �Student B’s median and mode jumps are longer than Student A’s longest jump. �What could explain the one jump that is so different from the others? �Scientists sometimes discard this type of data is there is a reasonable explanation for why it doesn’t fit.

The meet: �How confident are you that Student B will win the meet? �At the meet, here were the results: �Student A jumped 3. 5, 3. 6, and 3. 9 �Student B jumped 3. 8, 4. 3 and 4. 1 �What does this do to their statistics? �Who do you think is likely to do better in the next meet? �Is your confidence increasing or decreasing?

Sample Size �It is hard to determine a meaningful average based on just a few data points �As you collect more data, you are more likely to obtain representative results. �Sample size is the number of data in a sample

Procedure �Read steps #1 -6 on pages 15 and 16. �You must find the mean, median and mode for centimeters for Table 1 (page 15) and Table 2 (page 16). �Your GRAPHS should graph only the centimeters data.
 �Answer questions 1, 2 and 4 with your group. Write")
Analysis Questions (Page 16) �Answer questions 1, 2 and 4 with your group. Write your answers in your notebook.

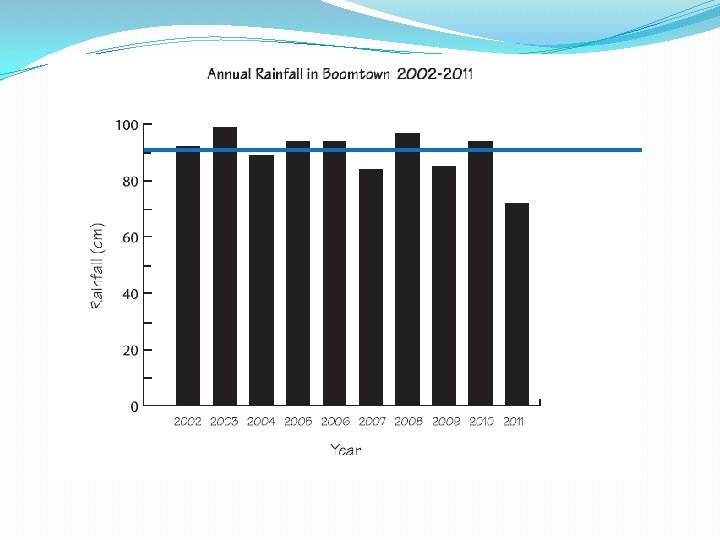
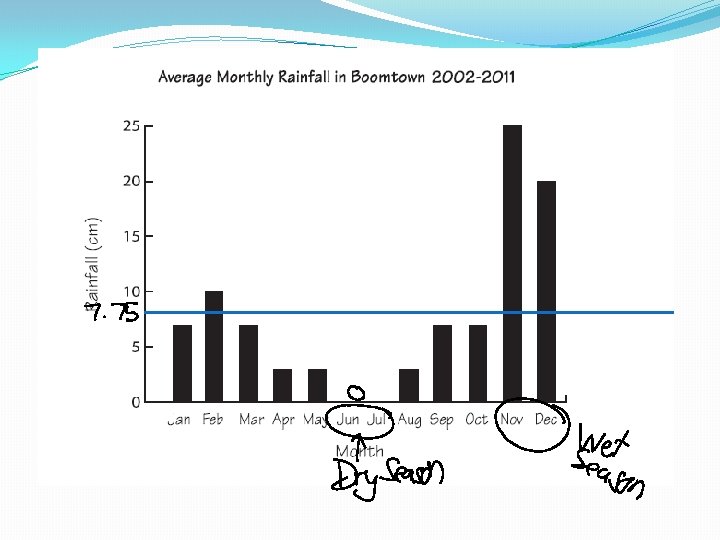
Analysis Answers � 1. Boomtown’s annual rainfall is usually between abut 72 and 99 cm. �However, in 2011, it was unusually low, at 72 cm. �The monthly average rainfall FLUCTUATES much more. It is as low as 0 cm in some months, and as much as 25 cm during the peak rainfall in November. �There is a clear rainy season in late fall and winter; and a dry season in the late spring and summer

� 2 a. The annual rainfall is fairly consistent from year to year with a mean of 90 cm/year, a mode of 94 cm/year, and a median of 92 cm/year. This is not a lot of rainfall overall. � 2 b. The rainfall is not evenly distributed throughout the year. The mean is 7. 75 cm / month, but the mode is only 3 and 7 cm/month. �Although most months get only 3 cm of rain, and there is not rain in June and July, November gets an average of 25 cm. This has a significant effect in raising the mean.

4. �A. Each location is a possibility. . . � Hills may have landslides or mudslides during heavy rain . � The wetlands could flood during heavy rain. � Parts of the cliff could be washed away during heavy rain. �B. Each location is a possibility. However, the Delta Marsh is likely to be the most affected by a flood since the marsh is at the lowest elevation and the river runs directly through it.
- Slides: 17